Why this matters
AI spend now comes from every department, and it can double in a week without anyone deciding it should. The invoice arrives after the month closes. By then the usual response is a spend cap, which slows every team, including the ones getting real work done with AI.
You need to know about spend that breaks its normal pattern while there’s still time to act. The alert should reach the person who can act on it, with proper context and detail. A plain “spend went up” alert doesn’t help enough. You shouldn’t have to spend an hour determining which team, user, and service caused it.
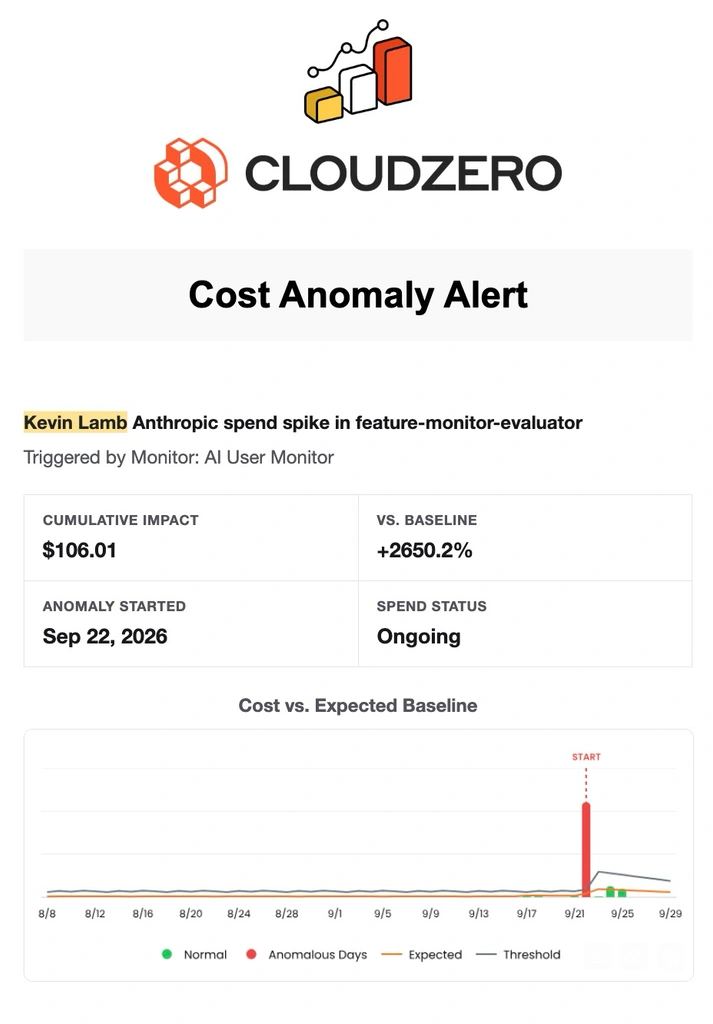
Image: Monitors sends out a cost anomaly alert so right person can take action on the AI spend spike.
Monitors, part of last week’s AI Signals launch, watches your spend against its own history. When something moves out of pattern, it opens an incident with the cost impact and contributors attached.
What we built
Monitors covers AI (and cloud and Kubernetes) spend in one place. It learns the normal pattern of each slice of spend from your history, forecasts expected cost, and flags when that comes in well above forecast.
You choose what to watch. A monitor can cover a team, product, customer, model, account, service, or any other Dimension in your allocation model. You also set how much movement counts, as a percentage above forecast, a minimum dollar impact, or both.
Thresholds that are too tight send so many alerts that people stop reading them. Thresholds that are too loose let a runaway job run for days before anyone hears about it. With separate monitors, a research team can experiment without triggering alerts while a production workload gets a tighter setting.
Three system monitors start as soon as you turn Monitors on. They cover spend by account, by service, and AI spend by user.
Each incident includes a plain-language summary, deviation against the forecast, a spend chart, and the resources that drove it, plus a link to Explorer filtered to the incident. Alerts go to the notification channel you prefer. Your team moves each incident from Active to Investigating to Resolved and records why it happened, whether the spend was known, the cause was fixed, or it wasn’t an anomaly. That history is what you bring to a budget review when someone asks why AI spend jumped last month and what was done about it.
How it works
Monitors is in public preview. Open Labs from your profile menu and turn on Monitors for yourself, or for your whole organization if you’re an admin. Then select Monitors in the left navigation. (Register here for our October 7 webinar to see Monitors and additional CloudZero AI capabilities in action.)
The Incidents tab shows every incident from the last 60 days and their total cost impact. To add a monitor, go to the Monitors tab and select New Monitor. Pick a cost type, scope it with a group-by and filters, check the cost preview, set thresholds, and add email recipients or a Slack channel ID.
CloudZero checks each monitor after your cost data refreshes. It closes an incident on its own once spend has been normal for seven days.
Monitors is the updated version of Anomaly Detection and will replace it over time. You can use both until then.
Read more about Monitors in docs →