AWS Lambda can be an easy-to-implement solution for those looking for serverless application deployments and operations. However, how can you be sure that you are getting the most for your money when it comes to utilizing this service?
This guide will explain some of the tools and resources at your disposal — whether you’re utilizing the AWS console, trying to optimize your code and design, or a combination of the two.
To get started on what and how AWS Lambda prices their service take a look at our article that covers that for you.
Lambda Optimization Tools And Resources
To accurately measure any cloud resource or component allocation you need to understand two types of provisioning in the cloud computing space — over-provisioning and under-provisioning.
Over-provisioning is when you allocate a surplus of resources or components to any one service or operation in your cloud. This can cause wasted costs and resources to be thrown out the window. Essentially, you are giving away free money because you overestimated what was needed to run your operation.
Under-provisioning is when you allocate too few resources or components to any one service or operation in your cloud. This can cause constant reactive scenarios, operational pain, wasted operational costs, and service disruptions or failures.
To ideally provision your resources in AWS Lambda, you have some well-known tools to assist in identifying, calculating, implementing, and provisioning them. This gives you the ability to maintain your operation, with the potential to automate its scale for effective and efficient delivery.
AWS Lambda Power Tuning
Credit: GitHub – AWS Lambda Power Tuning
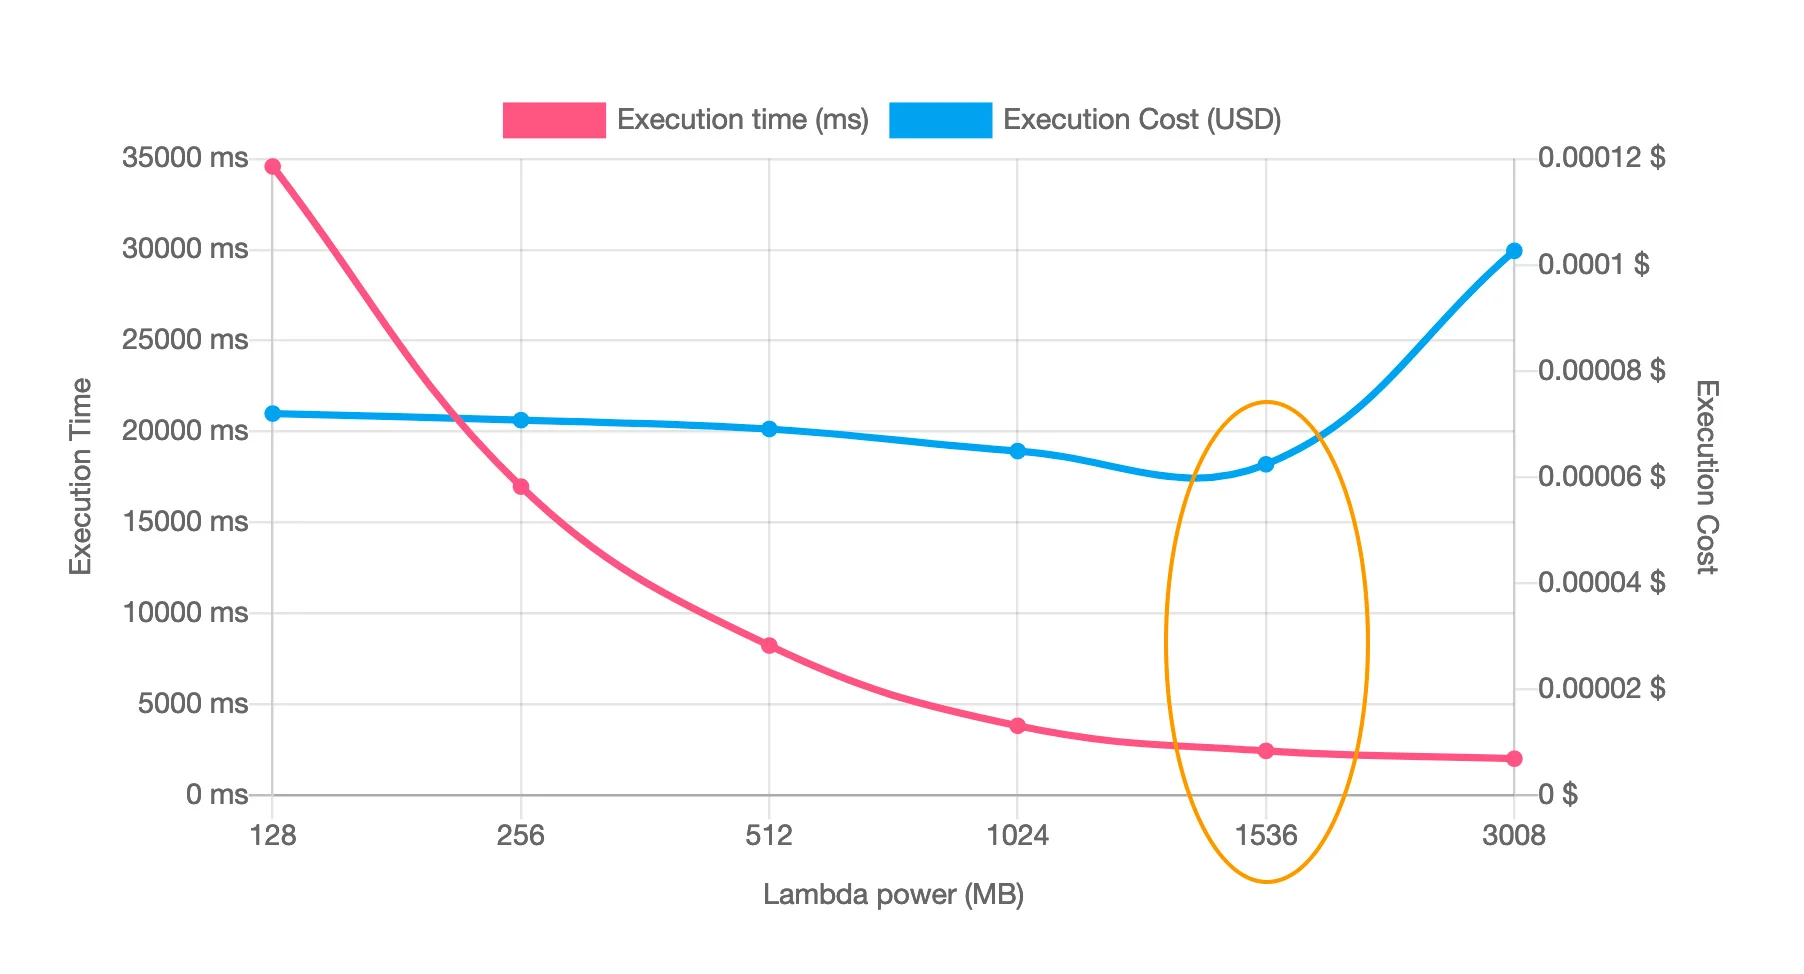
AWS Lambda Power Tuning is an open-source tool powered by AWS Step Functions that tests your Lambda function across multiple memory configurations — from 128 MB to 10 GB — and produces a visual cost-versus-duration tradeoff analysis. What makes this tool particularly valuable is that Lambda allocates CPU power proportionally to memory: at 1,769 MB, your function gets one full vCPU, with fractional allocation below that threshold and additional cores above it. Power Tuning reveals the sweet spot where adding memory actually lowers total cost because faster execution more than offsets the higher per-millisecond rate. The tool supports three optimization strategies (cost, speed, and balanced) and can be deployed via code or user interface (UI).
AWS Compute Optimizer
AWS Compute Optimizer uses machine learning to analyze your Lambda function’s utilization over the past 14 days and delivers specific memory-size recommendations. It identifies two types of optimization opportunities: functions that are over-provisioned (where you can reduce memory to cut costs) and compute-intensive functions that would benefit from more memory and CPU to reduce execution duration. Unlike Power Tuning, Compute Optimizer runs passively in the background — there is no need to execute test invocations. Enable it at the account level and check back for refreshed recommendations daily. For teams managing dozens or hundreds of Lambda functions, Compute Optimizer is the fastest path to identifying which ones deserve a closer look with Power Tuning.
AWS Lambda Metrics and AWS CloudWatch
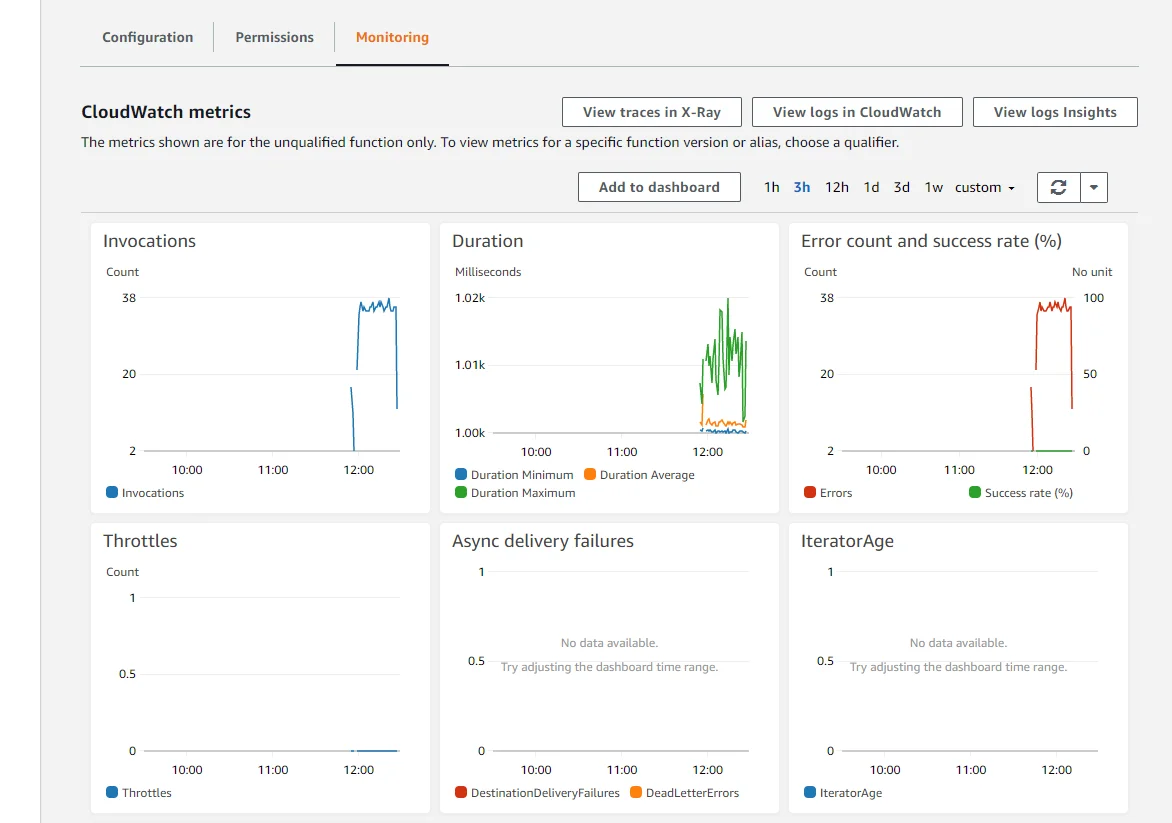
When a Lambda function’s processing is complete it will send its invocation metrics free of charge to AWS CloudWatch. However, these metrics can be deemed useless if you don’t utilize them correctly.
To do so you can create various alarms, monitors, CloudWatch metrics, or custom metrics to gain insight. These insights can allow you to identify if you need to upscale or downscale your resources, implement optimization improvements, or catch potential service disruptions.
Credit: AWS – Logging and metrics with CloudWatch
AWS Cost Explorer
This is another tool that allows you to have an overview of your AWS Services and their associated costs and usage. You can do this by filtering by location/region, availability zones, individual services (i.e. AWS Lambda), individual Lambda functions, and/or with a Lambda resource ID.
By utilizing the AWS Cost Explorer you can view its costs and usage to develop robust reports, studies, and measure trends to build a scalable operation.
CloudZero
CloudZero is a cloud cost intelligence platform that helps you understand, control, and optimize your AWS Lambda costs — while combining all of your cloud spend into a single pane of glass.
The platform provides AI-powered anomaly detection that automatically compares hourly spend against historical patterns to surface unusual cost behavior before it becomes a billing surprise. CloudZero’s Dimensions let you map Lambda costs directly to your business structure — by team, product, feature, or customer — rather than being limited to AWS’s native tagging and account hierarchies. You can view individual Lambda functions, their invocations, cost allocations, and correlating cost changes over time.
CloudZero gives you complete control to optimize, budget, and scale your serverless applications with cost efficiency and profit in mind.
Report
Finance needs to prove AI’s return: CloudZero report
260 senior finance leaders (more than half CFOs) told us why the speed of seeing AI spend, not the size of it, separates who pulls ahead on AI from who gets burned.
Managing Cold Starts And Memory Allocation
Two of the biggest factors in Lambda cost and performance are cold starts and memory configuration — and they are closely related.
A cold start happens when Lambda creates a new execution environment for your function, which includes downloading code, initializing the runtime, and running any initialization logic outside the handler. This added latency directly increases billed duration. For latency-sensitive workloads, AWS offers Provisioned Concurrency, which keeps a set number of execution environments pre-initialized and ready to respond immediately. Keep in mind that Provisioned Concurrency has its own cost, so it makes sense primarily for functions that sit on critical user-facing paths.
Beyond Provisioned Concurrency, you can reduce cold start impact by keeping deployment packages small (removing unnecessary dependencies and using Lambda Layers for shared libraries), choosing a lightweight runtime like Python or Node.js for latency-sensitive functions, and initializing SDK clients and database connections outside the handler so they persist across warm invocations.
On memory allocation: Lambda charges by the GB-second, and the relationship between memory and cost is not always intuitive. A function configured with 512 MB that finishes in 200 ms costs the same as a 1,024 MB function that finishes in 100 ms. But if more memory lets your function finish significantly faster, the net cost can actually decrease. Running ARM64 (Graviton2) architecture is another easy lever — it delivers up to 20% lower cost at comparable or better performance for most workloads, and switching requires only a configuration change.
Best Practices To Implement Lambda Optimization With Code
While having the tools above are some great ways to assist with optimizing your AWS Lambda service, there are some best practices and methods you can use if you are designing, building, and maintaining your service via Infrastructure as Code (IaC).
Optimizing code with AWS CDK and AWS SDK
It’s no secret that there are several ways you can optimize your code. However, when it comes to optimizing the code for your Lambda functions there are a number of things you can keep in mind.
These are:
- Utilize various client initializations via the AWS SDK
- Reuse resources that can be stored in memory
- Utilize the AWS CDK to implement optimized runtime in your Lambda functions
- Template and/or develop detailed configurations for consistency among AWS resources
- Separate core logic and handlers from one another
- Develop versions of a function by an individual user to prevent possible security issues
- Implement dynamic values with API calls instead of static ones
- Ensure package dependencies are up-to-date
- Implement robust logging and error handling for debugging and alerting
Implementing error handling and alerts
Having robust and detailed error handling for your logs is critical to debugging and resolving issues that can be occurring with your AWS Lambda functions and cloud computing infrastructure.
Consider implementing error handling for your Lambda function invocations and implementing alerts to make you aware of issues such as throttling on sources that do not automatically scale.
If you want to utilize another AWS Service you can consider AWS X-Ray’s SDK. It might have something you can use out of the box!
Load testing
Load testing can be a great practice to prevent a disaster from occurring before you even launch or release new updates. Various open-source tools exist that allow you to execute, measure, and identify that configurations and resources are allocated correctly within AWS Lambda.
By load testing your serverless applications in AWS Lambda, consider some questions if it were to be deemed successful:
- Are logs, metrics, and alerts running successfully?
- Are certain thresholds triggering alerts/alarms?
- Do I have the correct alerts/alarms in place?
- Do I need to make threshold adjustments to alerting/alarms to prevent service disruptions?
- Are resources too much or too little as the service scales?
Conclusion
It is important to study, observe, and design AWS Lambda with optimization in mind. Thankfully, you have various tools provided by AWS and other third-party platforms that can assist — from Power Tuning for finding the right memory configuration to Compute Optimizer for passive, ML-driven recommendations.
If you have time restrictions for implementation, consider revisiting to design and operate Lambda for scale. And if you are managing Lambda across multiple teams or products, a platform like CloudZero can map those costs to the business dimensions that actually matter — giving engineering and finance a shared view of where serverless spend is going and why.
AWS Lambda is a powerful tool, but its costs can add up quickly if its design is not thought through for operation and scalability — which can cause issues with the overall service, resulting in degraded performance or outright failure.