Why this matters
Most AI spend comes in with no tags and no owner attached. Your provider console shows total spend, maybe broken out by API key or model. It won’t tell you that the sales team spent $1,700 on Claude this week, let alone what the work was.
And the problem is growing. McKinsey found that 56% of organizations now use AI in three or more business functions. More teams means more spend, and most companies respond with a spending cap. Set it too low and you slow down the work you wanted AI to help with. Set it too high and you’re paying for spend nobody can explain.
When your CFO asks what the company got for its AI budget, you can’t really say.
What we built
Activity categorization, part of our AI Signals Launch, assigns each AI request to one of dozens of business activities. The names are familiar terms your teams already use:
- Engineering work shows up as feature development, debugging, code review, and testing.
- Sales work includes account research, outreach, deal strategy, and renewal planning.
- Marketing includes content, design assets, and campaign analytics.
- Other functions include support replies, financial analysis, recruiting, contract drafting, meeting prep, and more.
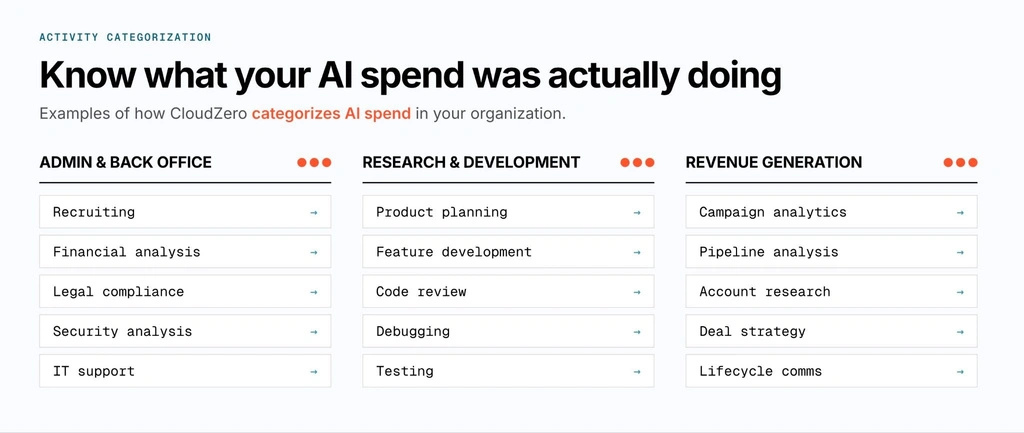
Image: Examples of AI spend categories CloudZero tracks.
The classification is based on the work, not the person’s title or team. A finance analyst and an engineer could use the same model on the same day, and CloudZero categorizes their requests under different activities because their work was different.
Activity is one dimension alongside department, team, person, model, provider, and repo. Combined, they give you a complete picture of where AI spend goes and what it pays for.
The classification runs in a data plane inside your own network. User prompts never leave your environment. CloudZero receives only metadata: activity, model, token count.
We ran it on ourselves first. Our Customer Success team turned out to be CloudZero’s second-largest AI spender behind Engineering, which nobody would have guessed from the provider bills.
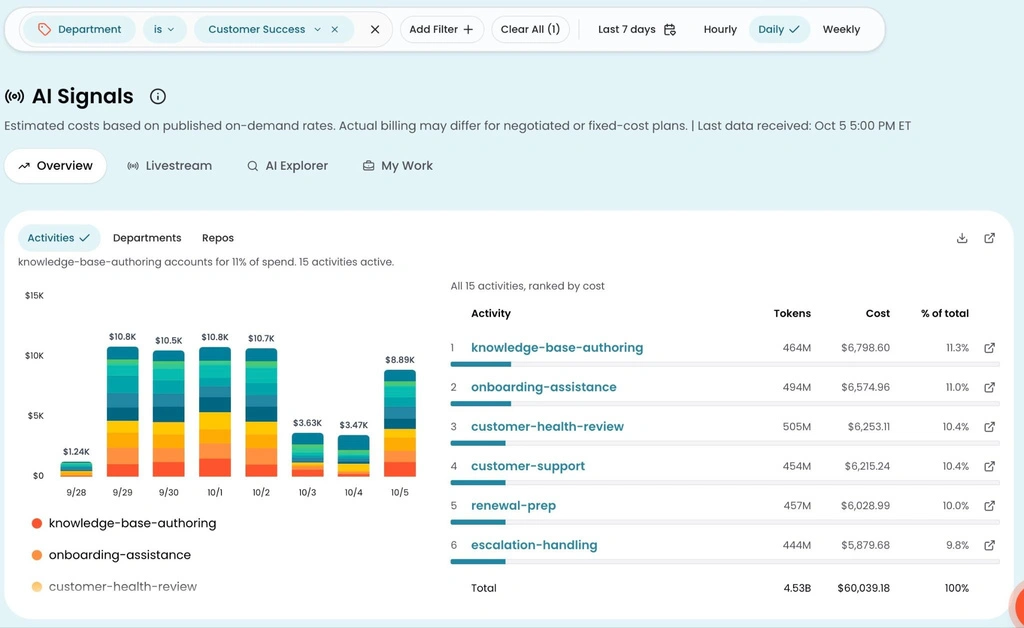
AI Signals Overview, filtered to Customer Success. Activity categorization shows where the team’s AI spend goes, from knowledge base authoring to renewal prep.
How it works
In AI Signals, the Overview page ranks AI spend by activity, highest cost first. You can filter by department, person, or model and the whole view refilters to that slice.
Say sales spend doubled this month. Filter to Sales and look at the Activities card. Most of the increase is account research and pipeline review, which matches a big quarter. A small slice is something nobody planned for, and now you know who to ask about it.
With that in place, you can defend a team’s budget with the work it paid for, move a high-volume activity like ticket summaries to a cheaper model, run showback by department, and plan next year’s AI budget by function.
Livestream, the live feed of incoming AI events, tags each event with its activity.