If you were anywhere near LinkedIn last week, you probably saw us launch AI Signals. We weren’t exactly quiet about it. (Press release, a couple of blog posts, and more social posts than we’d like to admit. Sorry about your feed.) We covered the why behind AI Signals already, but I wanted to actually walk you through what you’re seeing on the screen.
Sooner or later someone asks what the company spent on AI last month. Usually it’s the CFO, and there’s almost always a follow-up the invoice can’t answer: spent on what?
That’s where it gets challenging. Anthropic, OpenAI, Cursor, Copilot. Each sends its own bill, and none of them know your org chart. A provider console can tell you a model ran. It can’t tell you the sales team ran it for demo prep, or that a big chunk of engineering’s spend went to code review. So the number you report is a total, and a total is where the questions start.
The safe move is to cap everyone’s AI usage. That stops the runaway bill but it also puts the same limit on your best experiment and on the script somebody forgot to turn off. If you leave it wide open, you find out about the overrun when the invoice arrives.
What we built
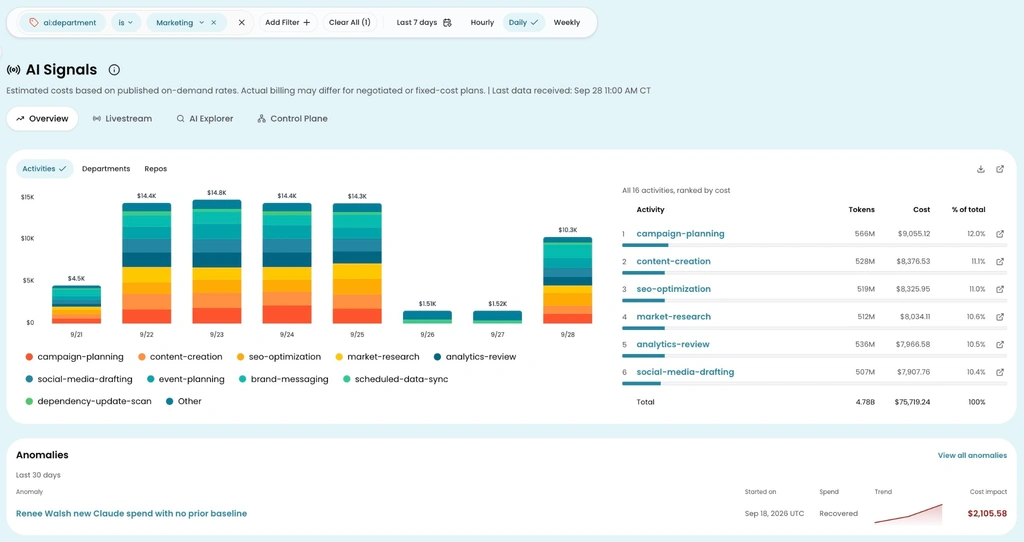
Image: Overview filtered to Marketing. Spend breaks down by activity, with campaign-planning and content-creation leading the week. An anomaly card at the bottom flags a new spend pattern worth investigating.
AI Signals Overview is now generally available. It’s the first thing you see when you open AI Signals in CloudZero.
At the top are the headline numbers: total AI cost, projected end-of-month spend, active users, cost per active user, and how each changed from the prior period. Below that, cost and tokens sit side by side over time, broken down by model, at hourly, daily, or weekly detail.
Then the breakdowns. Spend ranked by department, repository, and business activity, with CloudZero classifying the work into categories like prospecting, code review, and content drafting. Top models, top users, and cache savings each get their own panel,and a new anomalies card surfaces the biggest AI cost spikes directly on the page.
Click any department, user, or model and every chart, table, and headline number on the page refilters to that slice. Every row links into AI Explorer with your filters already applied, and every table exports.
How it works
Picture the CFO asking why marketing’s AI spend jumped this month. You click Marketing and see that the increase sits in content drafting. You click the model behind it, and you see the handful of people driving it. That’s quick insights that lead to quick answers. And it’s the conversation that decides whether a team gets more budget or a closer look.
Costs shown are estimates based on published on-demand rates, so they show up weeks before the invoice. For month-end close, reconcile against the provider bill. Spend that can’t yet be tied to a department appears as its own row, so you can see exactly how much still needs an owner.
AI Signals needs to be enabled for your organization and your role needs AI Signals access.
Read more in the docs or read more at CloudZero.com.