Why this matters
Everything you see in Explorer starts with a billing connection, and a connection that stops sending data leaves a gap in your spend. A gap is easy to miss on a chart, because a drop from missing data looks just like a drop from real savings.
Connection health now tells you directly whether data is arriving. Each connection on the connections page has a small bar indicator with one bar per day, so you can see which days brought in billing data and which didn’t. When a connection that’s been steady goes quiet, you can see the day it happened without opening Explorer to go looking for it.
Say your Anthropic spend drops by half partway through the month, and someone in finance asks whether the team cut usage or something broke. You can open the connection, check that data arrived every day, and answer on the spot. If data did stop, you have the exact date to send to support. Our field and support teams see the same day-by-day view, so they start from the same facts you have.
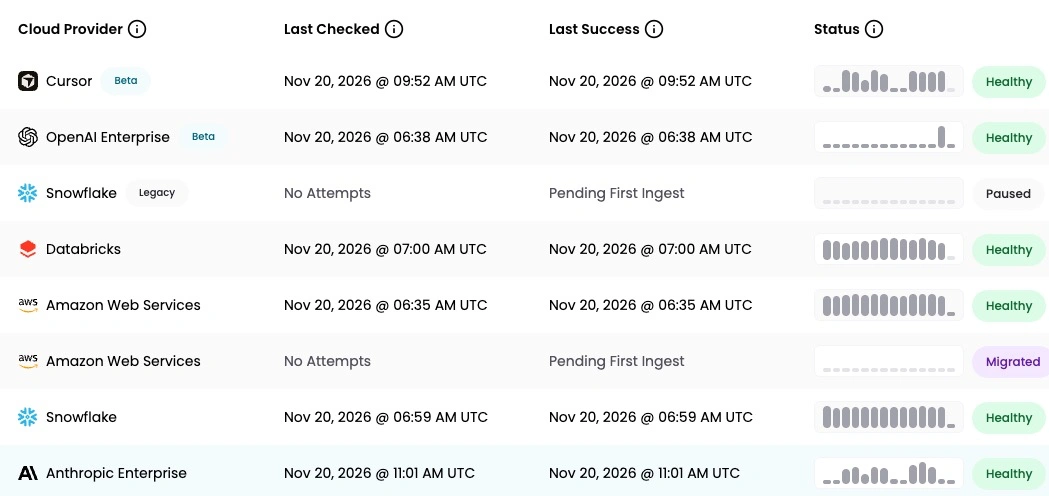
A list of connections in CloudZero’s tenant showing our operational health status.
What we built
Connection health now reports on whether billing data is flowing, which is the job a connection has in the first place. Each provider has an expected window for sending data, and a connection shows Error when data doesn’t arrive in that window, even when its credentials are still valid.
The bar indicator sits next to each connection’s status. Each bar is one day, and taller bars mean more billing records came in that day (CloudZero calls them line items). A day with no bar means nothing arrived.
Open a connection and the detail view shows what happened behind the status. For Snowflake connections, it shows which tables were shared with CloudZero and which weren’t, so you can tell when cost data is missing because a table was left out of the share. For Azure connections, each run reports a checklist covering sign-in, download, tags, billing period, balance, and reconciliation.
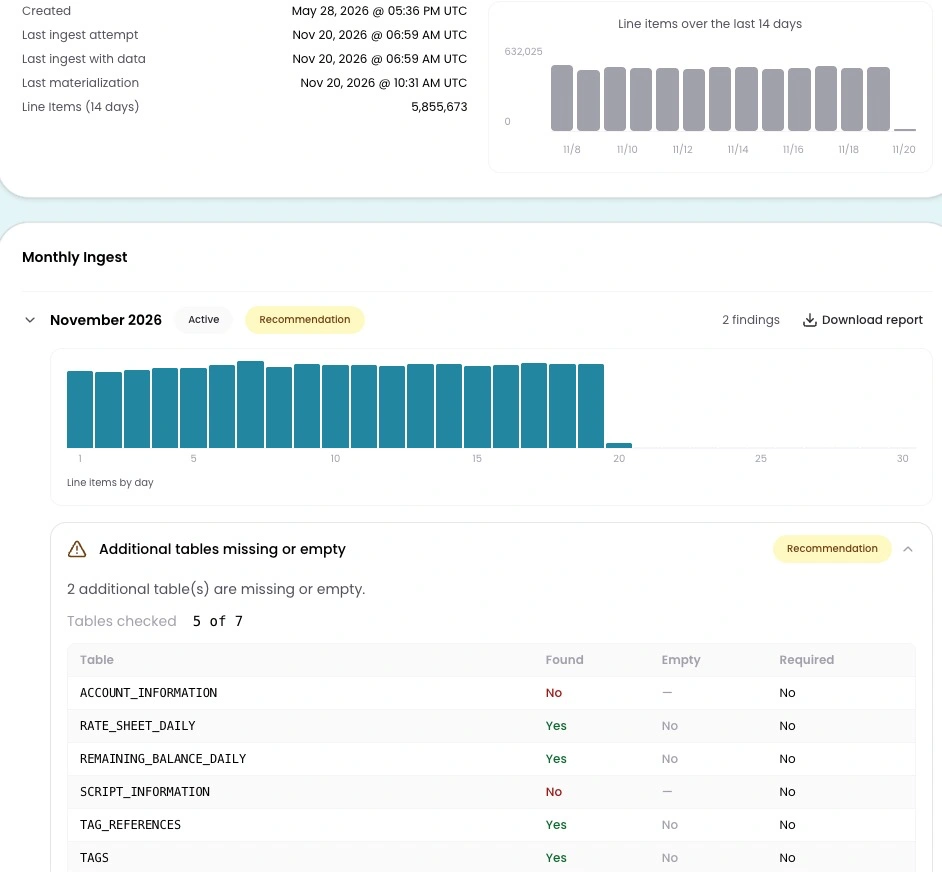
A connection details page for a Snowflake connection showing the daily line items and deeper connection health detailing specifics about Snowflake.
How it works
Open the connections page and look at the indicator next to each connection’s status. A bar on a given day means billing data arrived that day, and a gap means it didn’t. When a status has a dot next to it, click the dot to see the reason behind it.
Click into a connection for the detail view. Snowflake and Azure connections show full detail today, and more providers are on the way. Connections for other providers have the indicator and the data-based status.
Managing connections is limited to admins with elevated permissions (a small group in each organization, on purpose, because setting up a connection involves sensitive credentials). If you don’t see the page, ask your CloudZero admin to check your access.
The indicator covers every connection on the page, so one look shows which ones are sending data today.
Learn about it in the CloudZero Academy → learn.cloudzero.com/courses/connection-health