Why this matters
The question comes up on the 10th, the 15th, and again on the 25th. Where is AI spend going to end up this month? The invoice won’t tell you until it’s closes, and by then there’s nothing left to forecast.
“If I’m looking at this on the 15th, I want to know where we’re going to land.” That’s how a finance lead put it during a persona session in September, and it’sthe whole job. You have half a month of real usage behind you. You want the other half projected in a way you can explain to a CFO. And you want to know whether the month is running ahead of or behind the last one.
The downstream conversation is the budget review. The panel was built to match how finance already tracks AI spend, so when someone asks what AI will cost this month, you have a number you can explain. If the forecast is high, you find out on the 10th with three weeks to act. If it’s low because a team paused work, you can say that too, with the booked total to back it up.
What we built
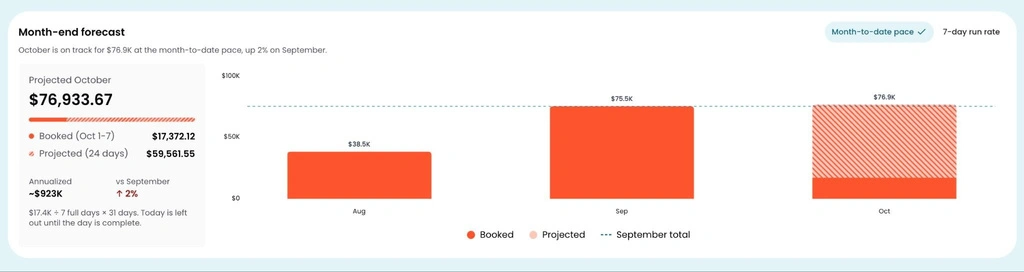
October’s projected total built from seven days of booked spend, with September’s total as a dashed reference line.
The AI Signals Overview now has a Month-end forecast panel. It projects this month’s AI spend from the days already booked, shows the change vs. last month, and offers two forecasting methods so you can pick the one that fits your data.
The panel shows the last three months as monthly bars. The current month is a single stacked bar: solid for what’s booked so far, hatched for what’s projected, with a dashed line at last month’s total so you can see the comparison without reading a table. Underneath, a summary gives the projected total, the booked vs. projected split, the annualized run rate, the change vs. last month, and which method produced the number.
There’s also an insight line that states the finding in plain words, for example: “October is on track for $162.6K at the month-to-date pace, up 12% on September.” That’s the sentence you paste into the Slack thread or budget review.
How it works
Open AI Signals and scroll to the Month-end forecast panel. Pick between month-to-date pace (the default) and a 7-day run rate. Month-to-date pace takes what you’ve spent so far and extrapolates across the full month. The 7-day run rate uses your most recent week instead, so if spending patterns shifted recently, it picks that up earlier. Having both lets you triangulate where you’ll actually land instead of relying on a single number.
Page filters carry into the forecast, so you can project one department’s spend or the whole company’s. The method you pick is saved in the URL, so a shared link opens on the same calculation.
See it in the docs → https://docs.cloudzero.com/docs/ai-signals