Why this matters
Most cost questions have more than one layer. Which team spent the most, which services drove it, and which accounts were behind those services? Previously, following that path meant changing dimensions, adjusting filters, and re-running the query at every step.
Multi-dimensional drill-down has been one of the most-requested features in Explorer. The team shipped two-level group-by earlier this year, collected feedback, and kept going. Now the path goes eight levels deep.
What we built
Add up to eight Group Bys in Explorer and a Treemap appears as a chart option. Each square is sized by its cost, so the biggest drivers stand out at a glance. Previously, the chart only reflected your first group-by. Now the Treemap visualizes every level, and you click any square to break it down by the next dimension. The results table follows the same path: expand a row to see the level below it.
Each slice shows its share of the level above, so you can see how much of a team’s spend one service accounts for. Drill-downs stay fast even at depth, because CloudZero loads each level when you click rather than expanding everything at once. The same multi-dimensional Group Bys and Treemap work in AI Explorer too.
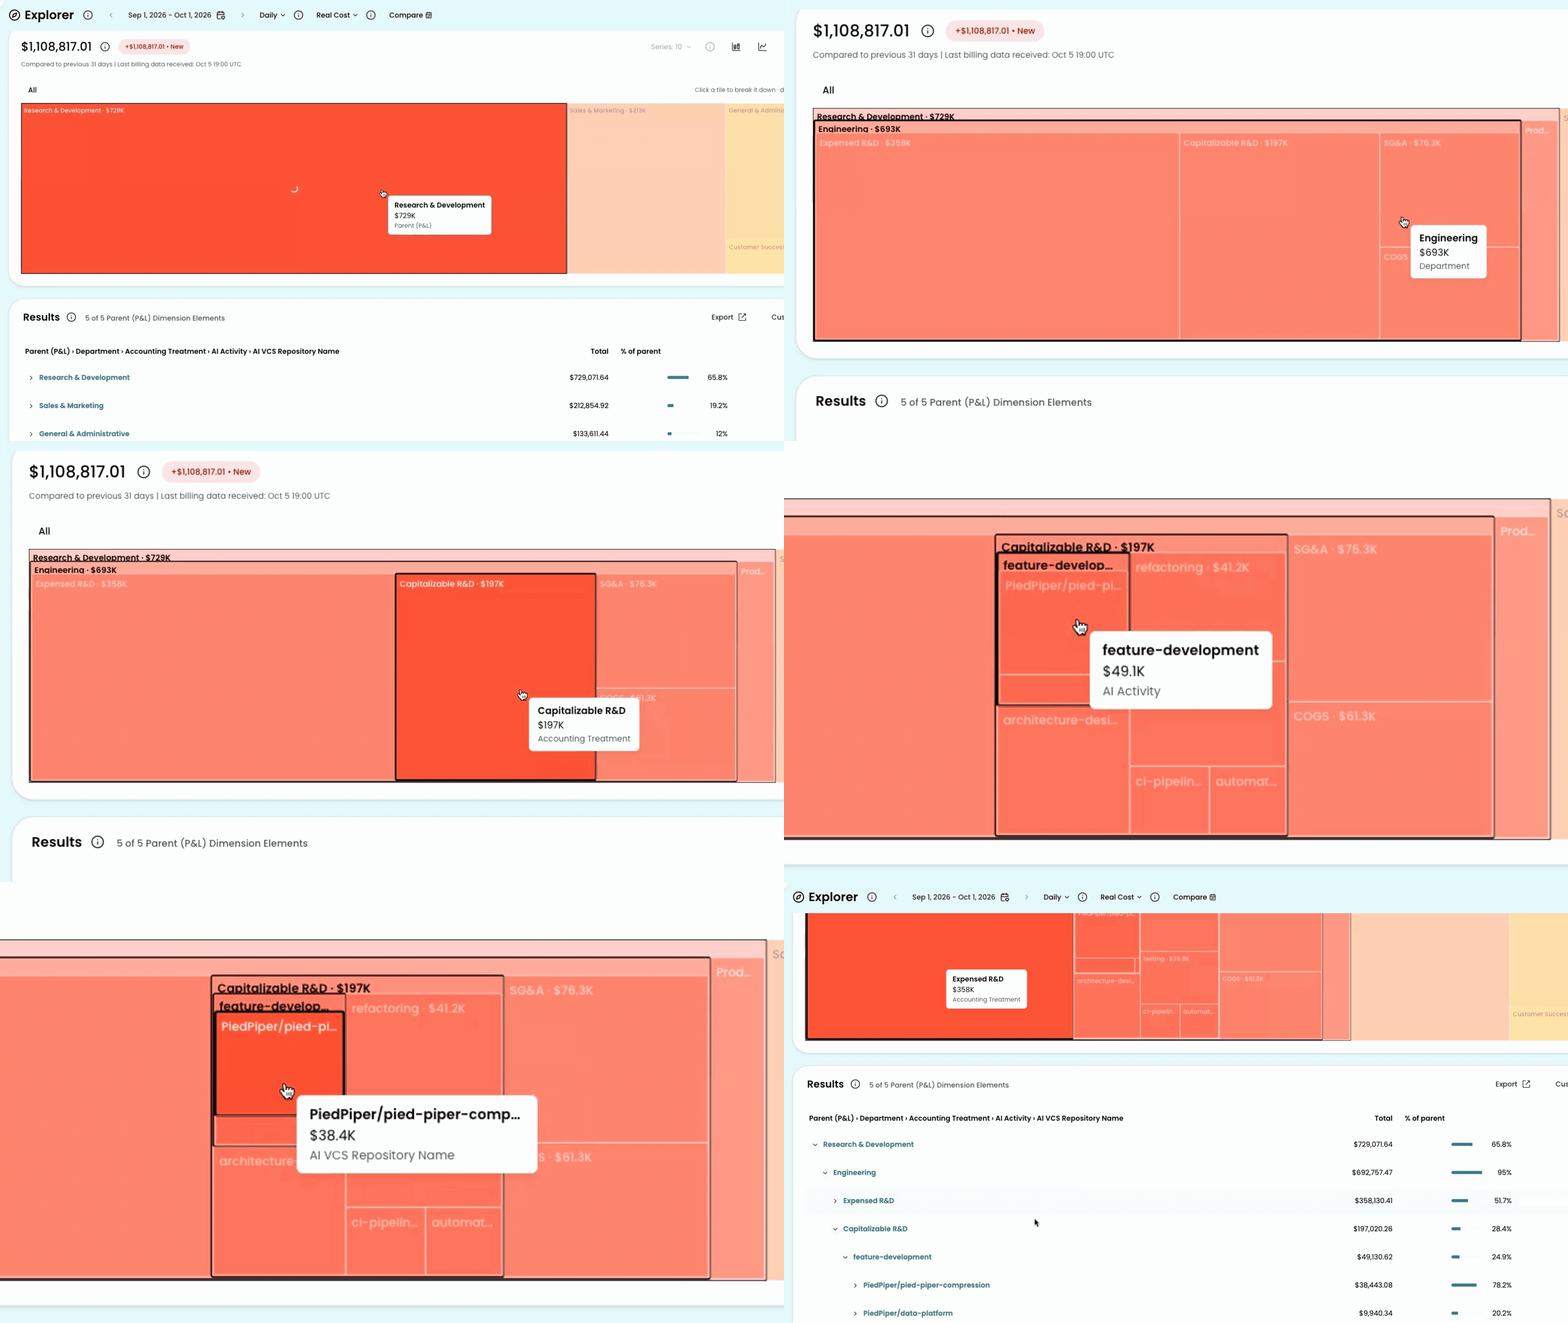
Image: Explorer’s Treemap with four Group Bys.
How it works
Add your Group Bys in the order you want to drill. The Treemap and table both follow that path, one click at a time.
See it in the docs → https://docs.cloudzero.com/docs/grouping-filtering-and-time-range