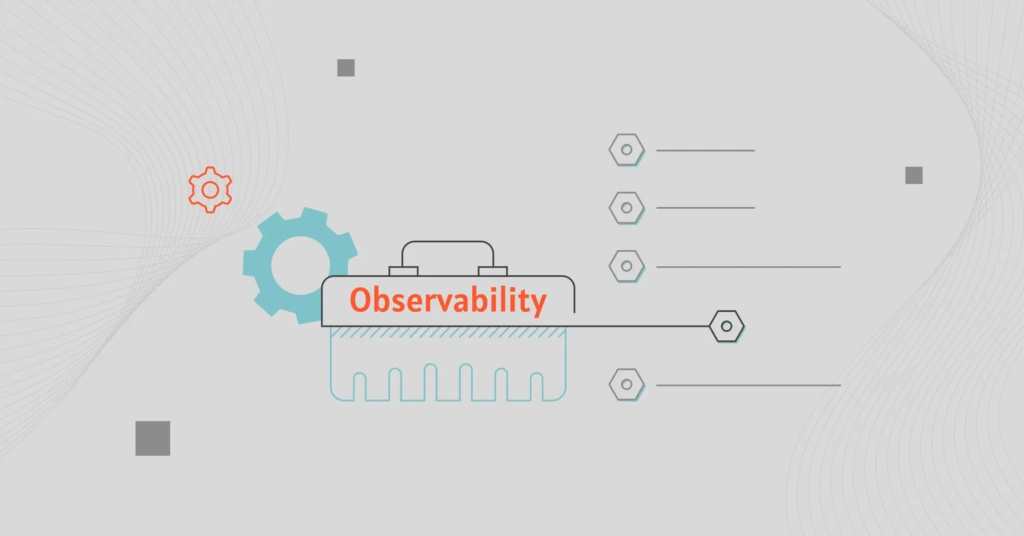
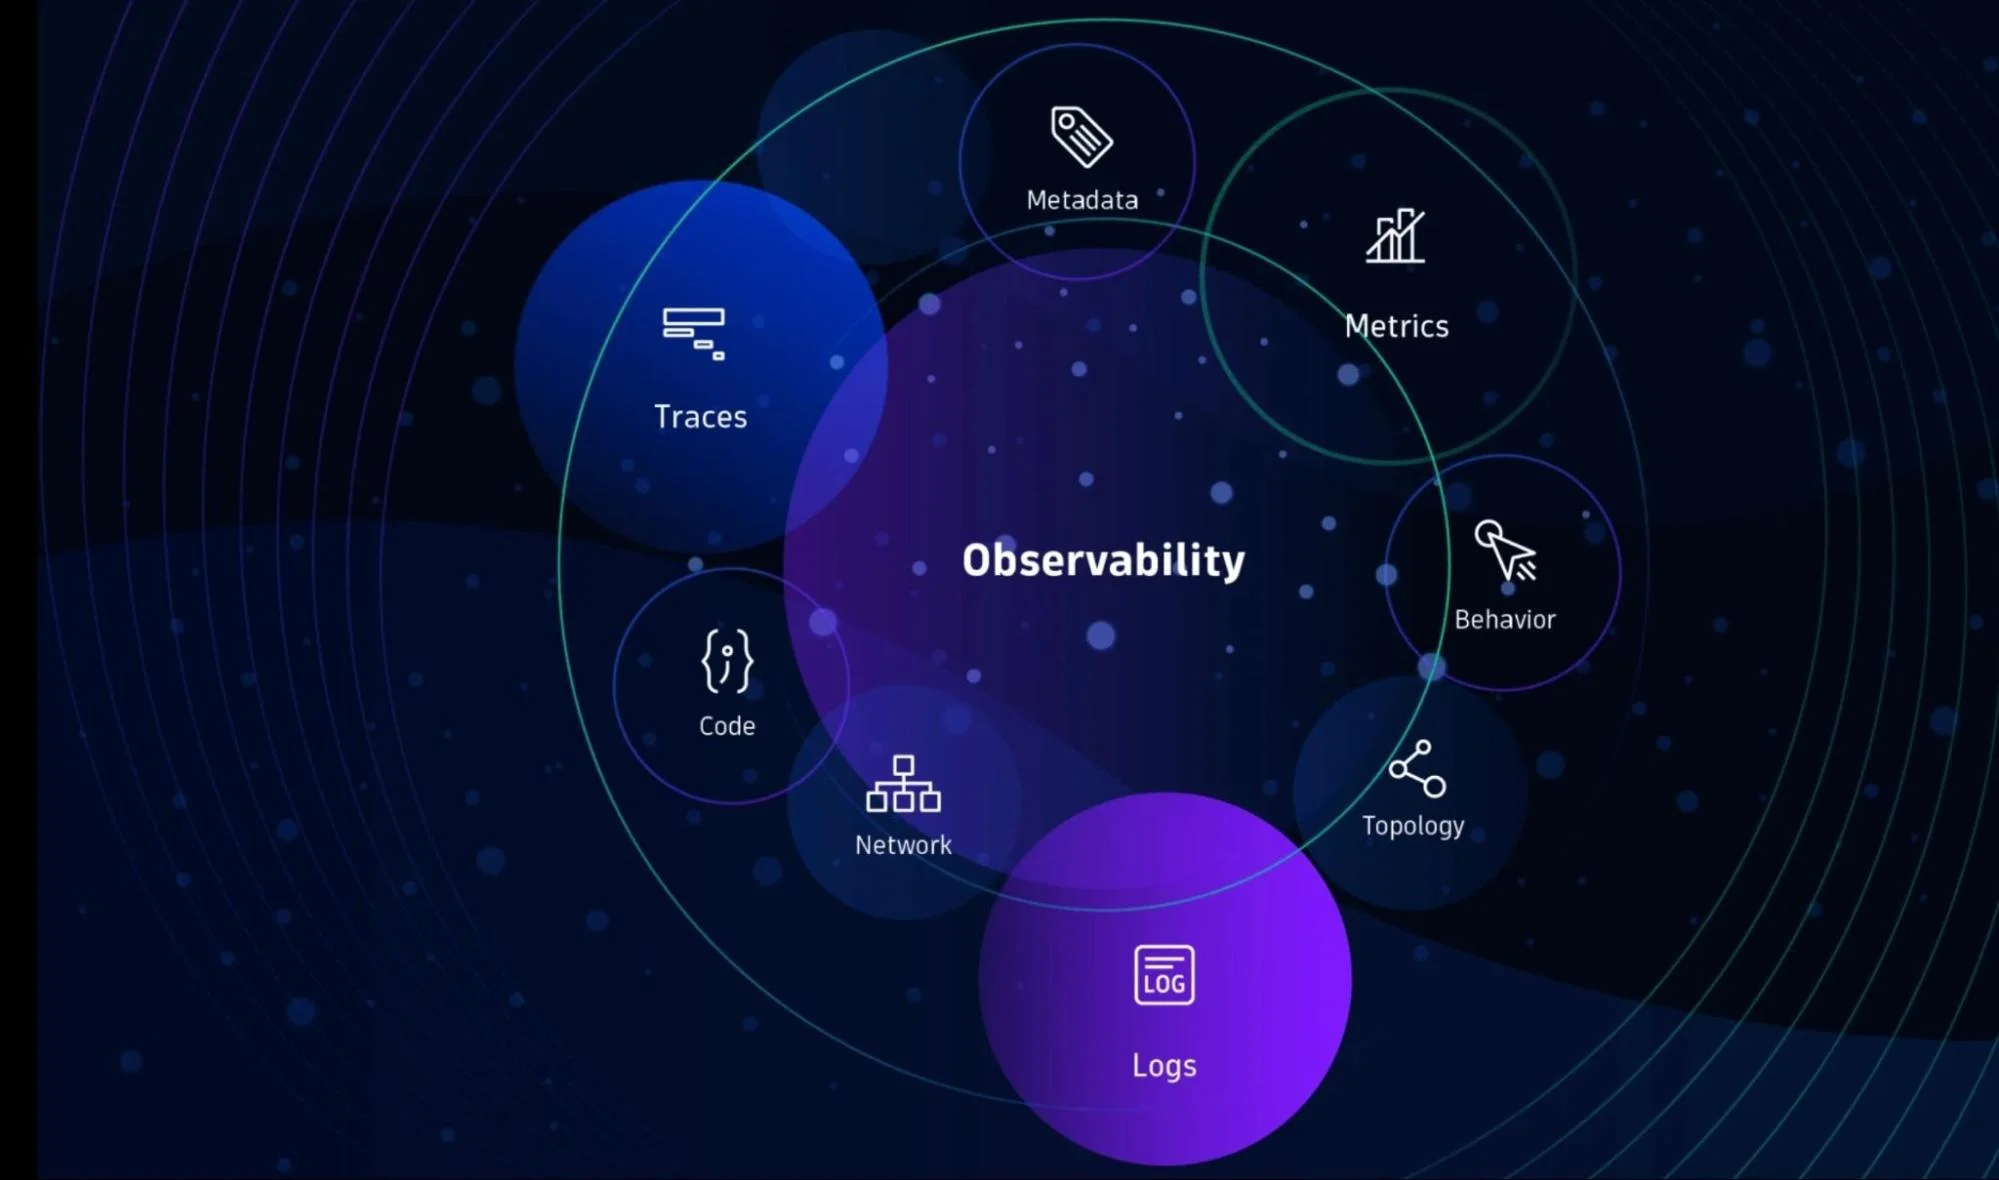
Cloud observability tools offer visibility into your cloud infrastructure. They collect and correlate logs, metrics, and traces from various sources to help you understand your applications’ performance. The tools enable you to monitor, optimize, and troubleshoot your cloud environment.
Cloud observability goes beyond traditional monitoring. Where monitoring tells you something broke, observability helps you understand why — by connecting telemetry signals across your entire stack. For teams running distributed microservices, containers, and serverless workloads, that level of insight is table stakes.
In this guide, we’ll share why cloud observability is important and the best tools to consider.
Here’s Why You Need A Cloud Observability Tool
If your organization already uses a cloud cost management tool, you might wonder why you also need a cloud observability tool. While those tools optimize and manage your costs, visibility and observability tools offer more.
- Performance tracking. These tools aid in monitoring the real-time performance of your applications and services.
- Rapid issue detection. The tools allow for prompt identification of issues in your cloud environment. This helps reduce application downtime.
- Improved troubleshooting. You can troubleshoot issues and identify the underlying cause by gaining in-depth insights.
- Increased resource efficiency. Observability tools offer information to help maximize cloud resource use. They help avoid inefficiencies and optimize cloud costs.
- Robust security. By observing logs and metrics, these tools help in identifying unusual activities that may signal security risks.
- Better user experience. Observability tools contribute to a positive user experience by ensuring smooth-running applications.
- Compliance and reporting. They help ensure adherence to industry regulations by providing the necessary data for audits and reports.
- Scalability insights. Cloud observability tools help you understand how your applications scale under various loads. They offer valuable insights for capacity planning.
- Team collaboration. Observability tools facilitate a shared view of the cloud environment. This fosters collaboration between IT, DevOps, FinOps, and engineering teams.
- Proactive management. By using predictive analytics, you can predict issues in advance and take precautions.
Here are some observability tools you’ll want to consider.
1. CloudZero
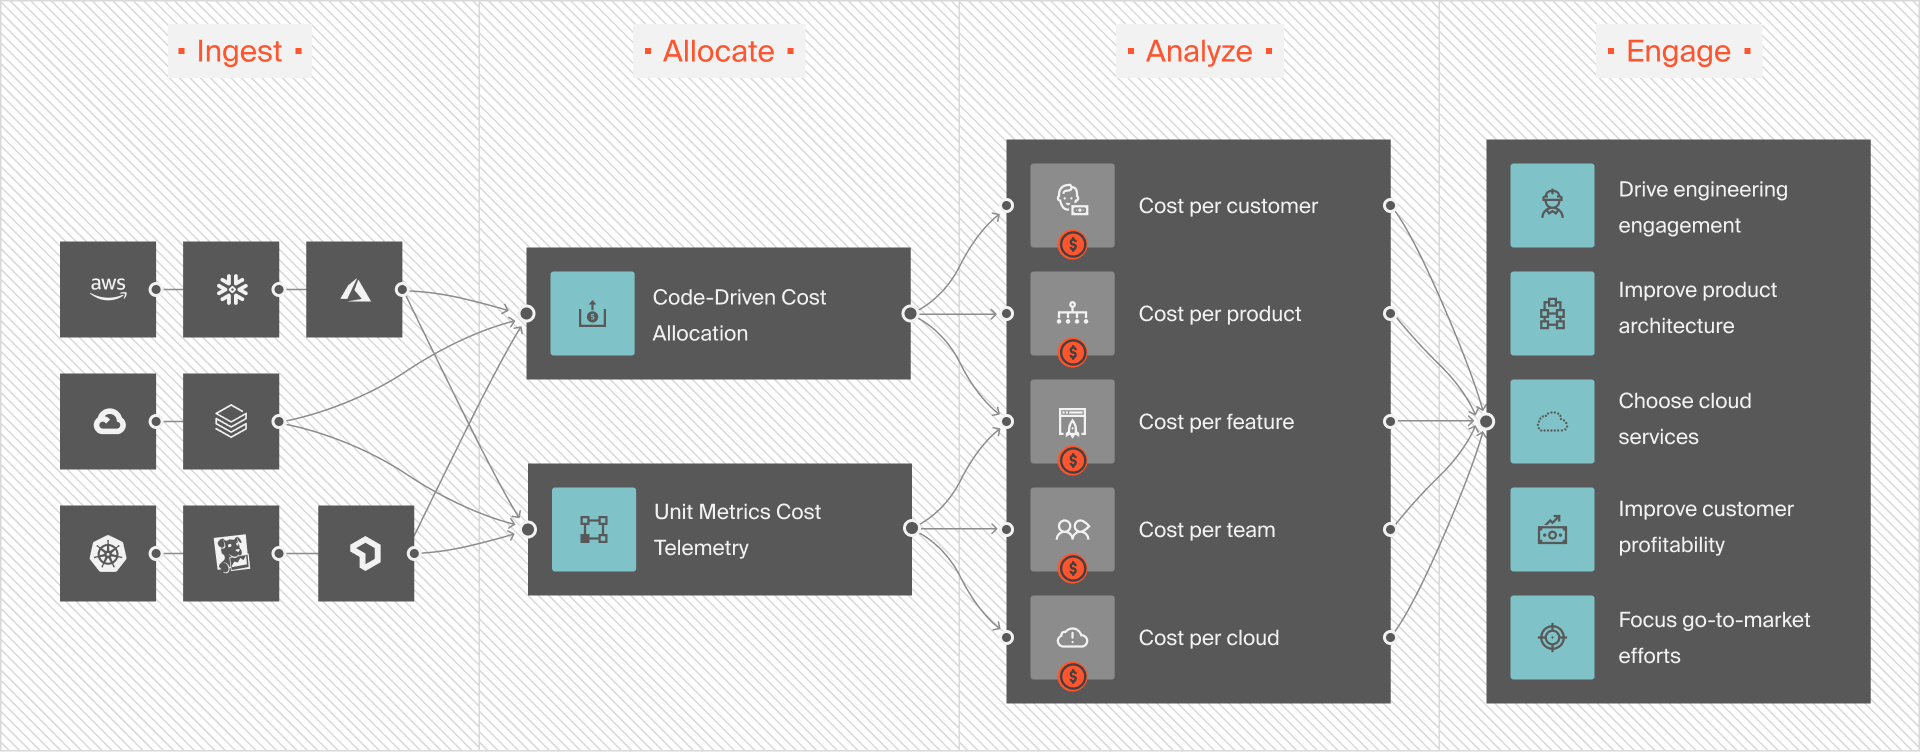
CloudZero offers comprehensive cloud observability that goes beyond basic monitoring. The platform provides granular cost visibility, allowing users to delve deeper into their cloud costs. With CloudZero, you can track where your funds are allocated in detail. This visibility helps identify cost drivers and areas for spending optimization. By breaking down your cloud costs, you can make informed decisions and reduce cloud waste.
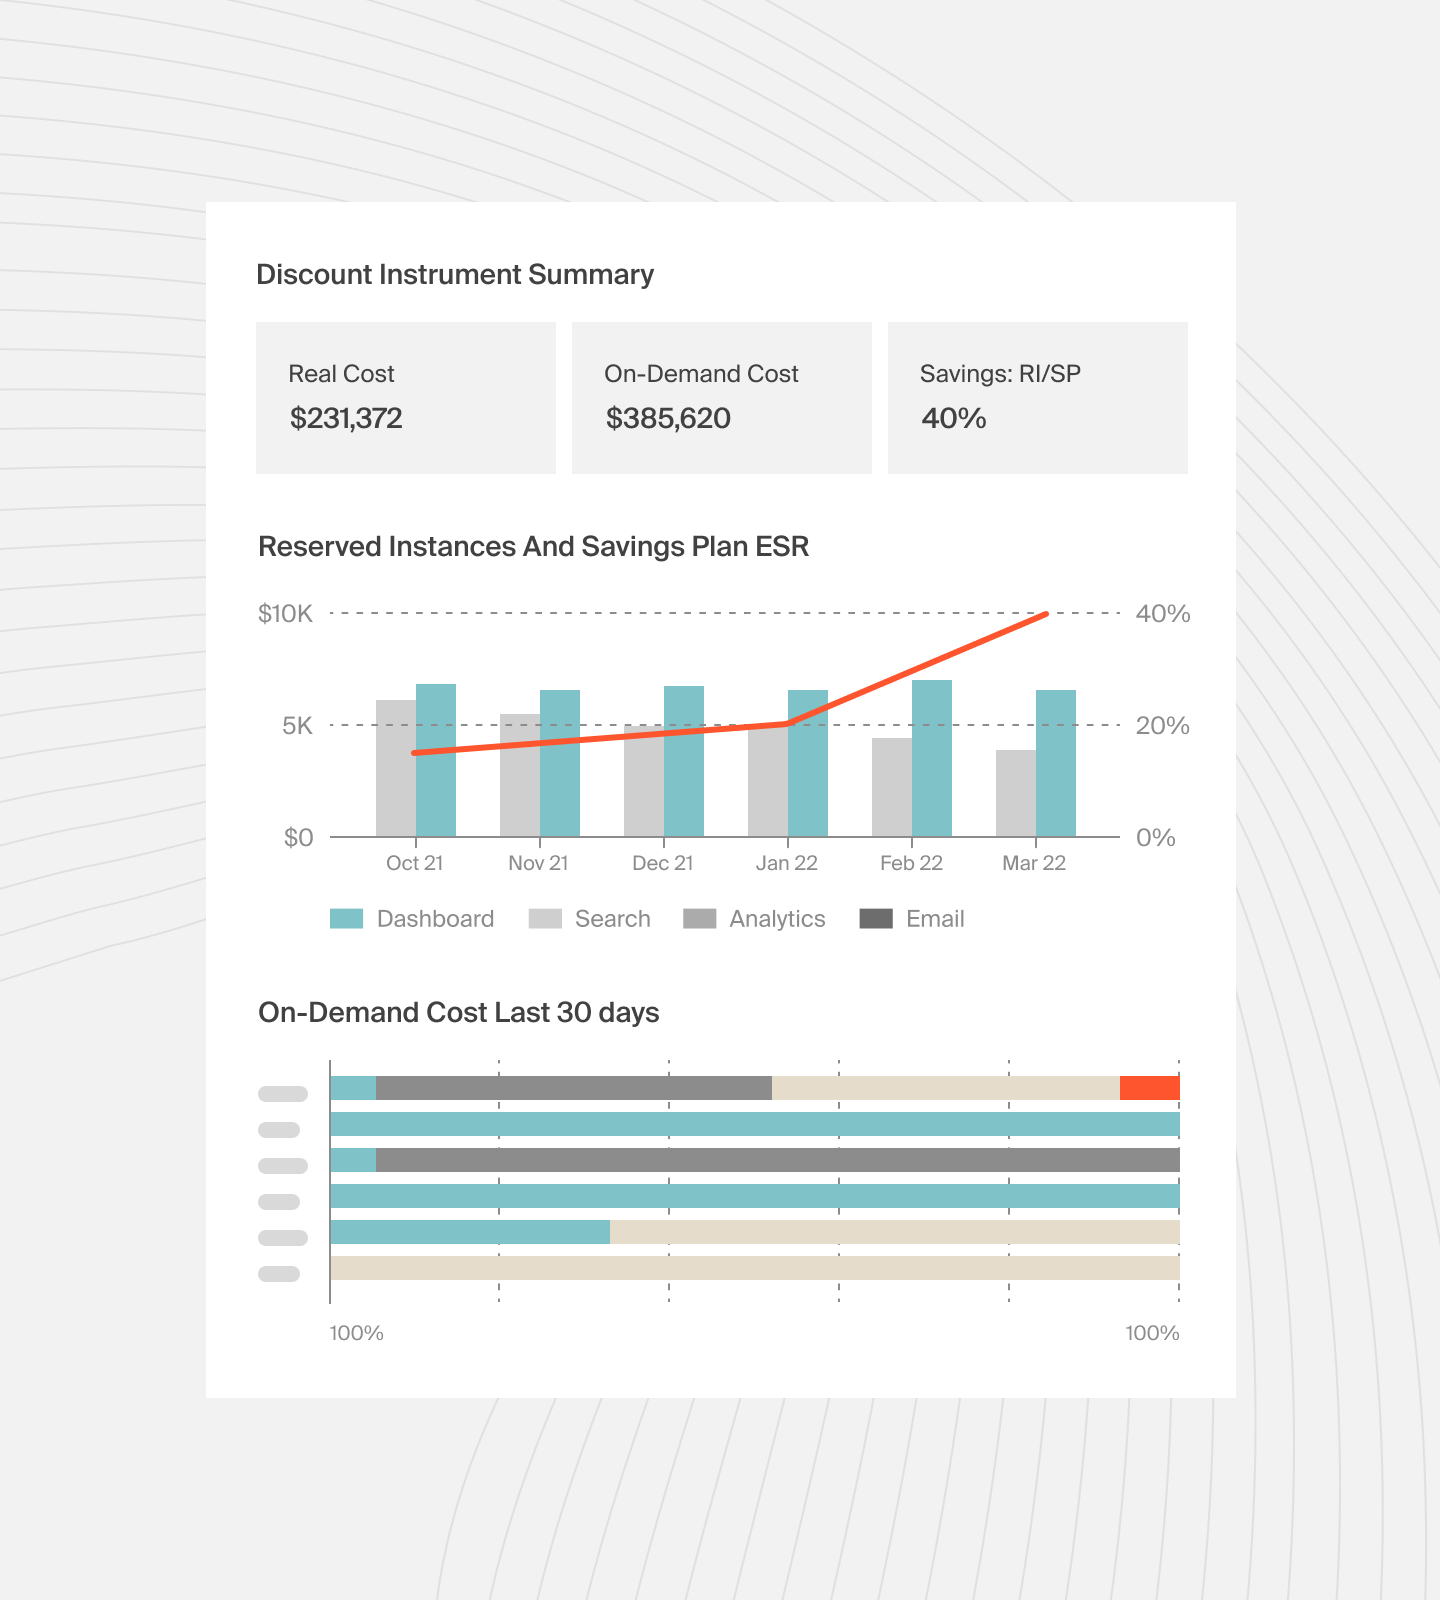
Controlling cloud costs through discounts is a smart strategy. CloudZero’s discount analytics simplify this process. The platform analyzes your usage patterns. It identifies opportunities to save with reserved instances, savings plans, and other discount programs.
You can visualize your savings and learn how to optimize your discounts further. CloudZero’s discount insights help you get the best value from your cloud investments.
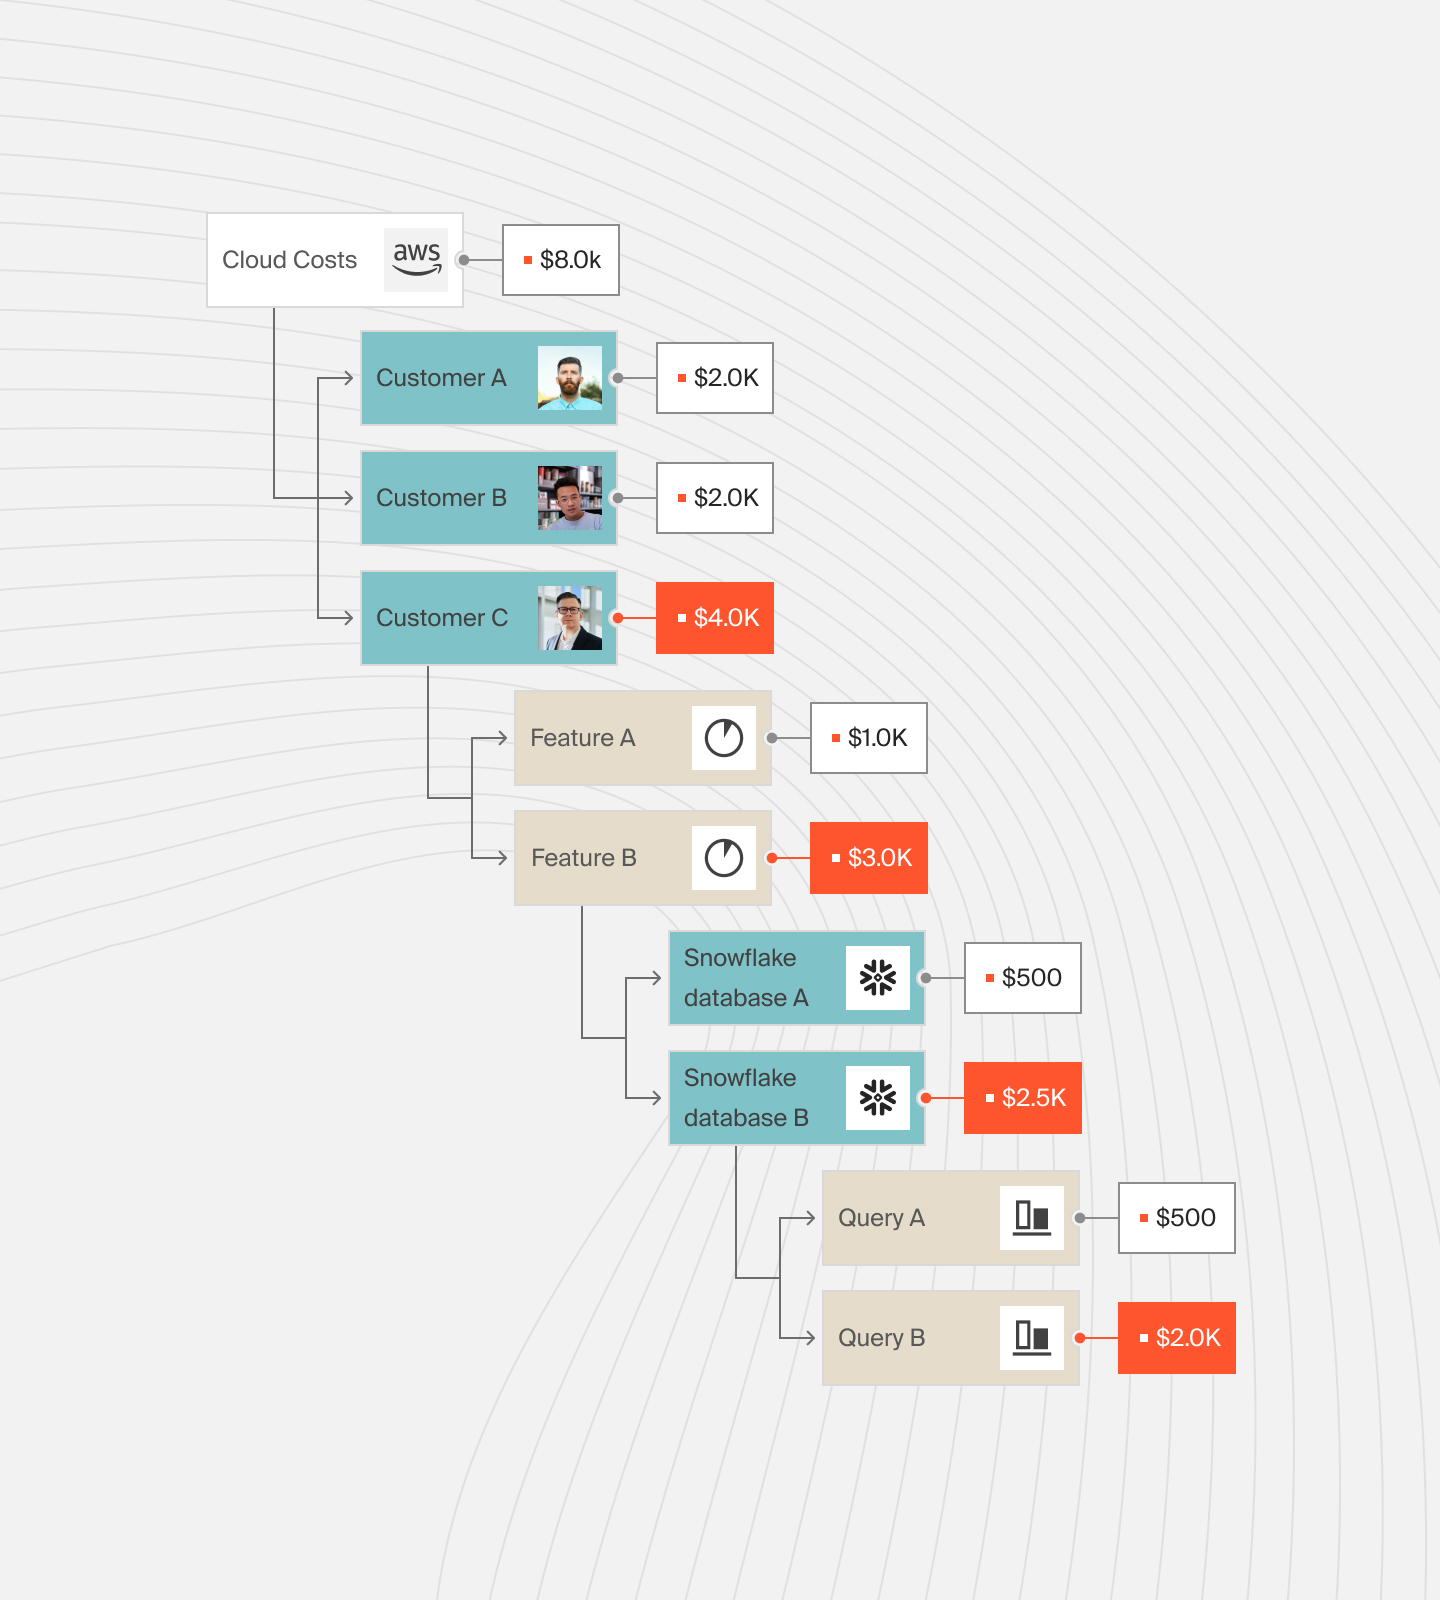
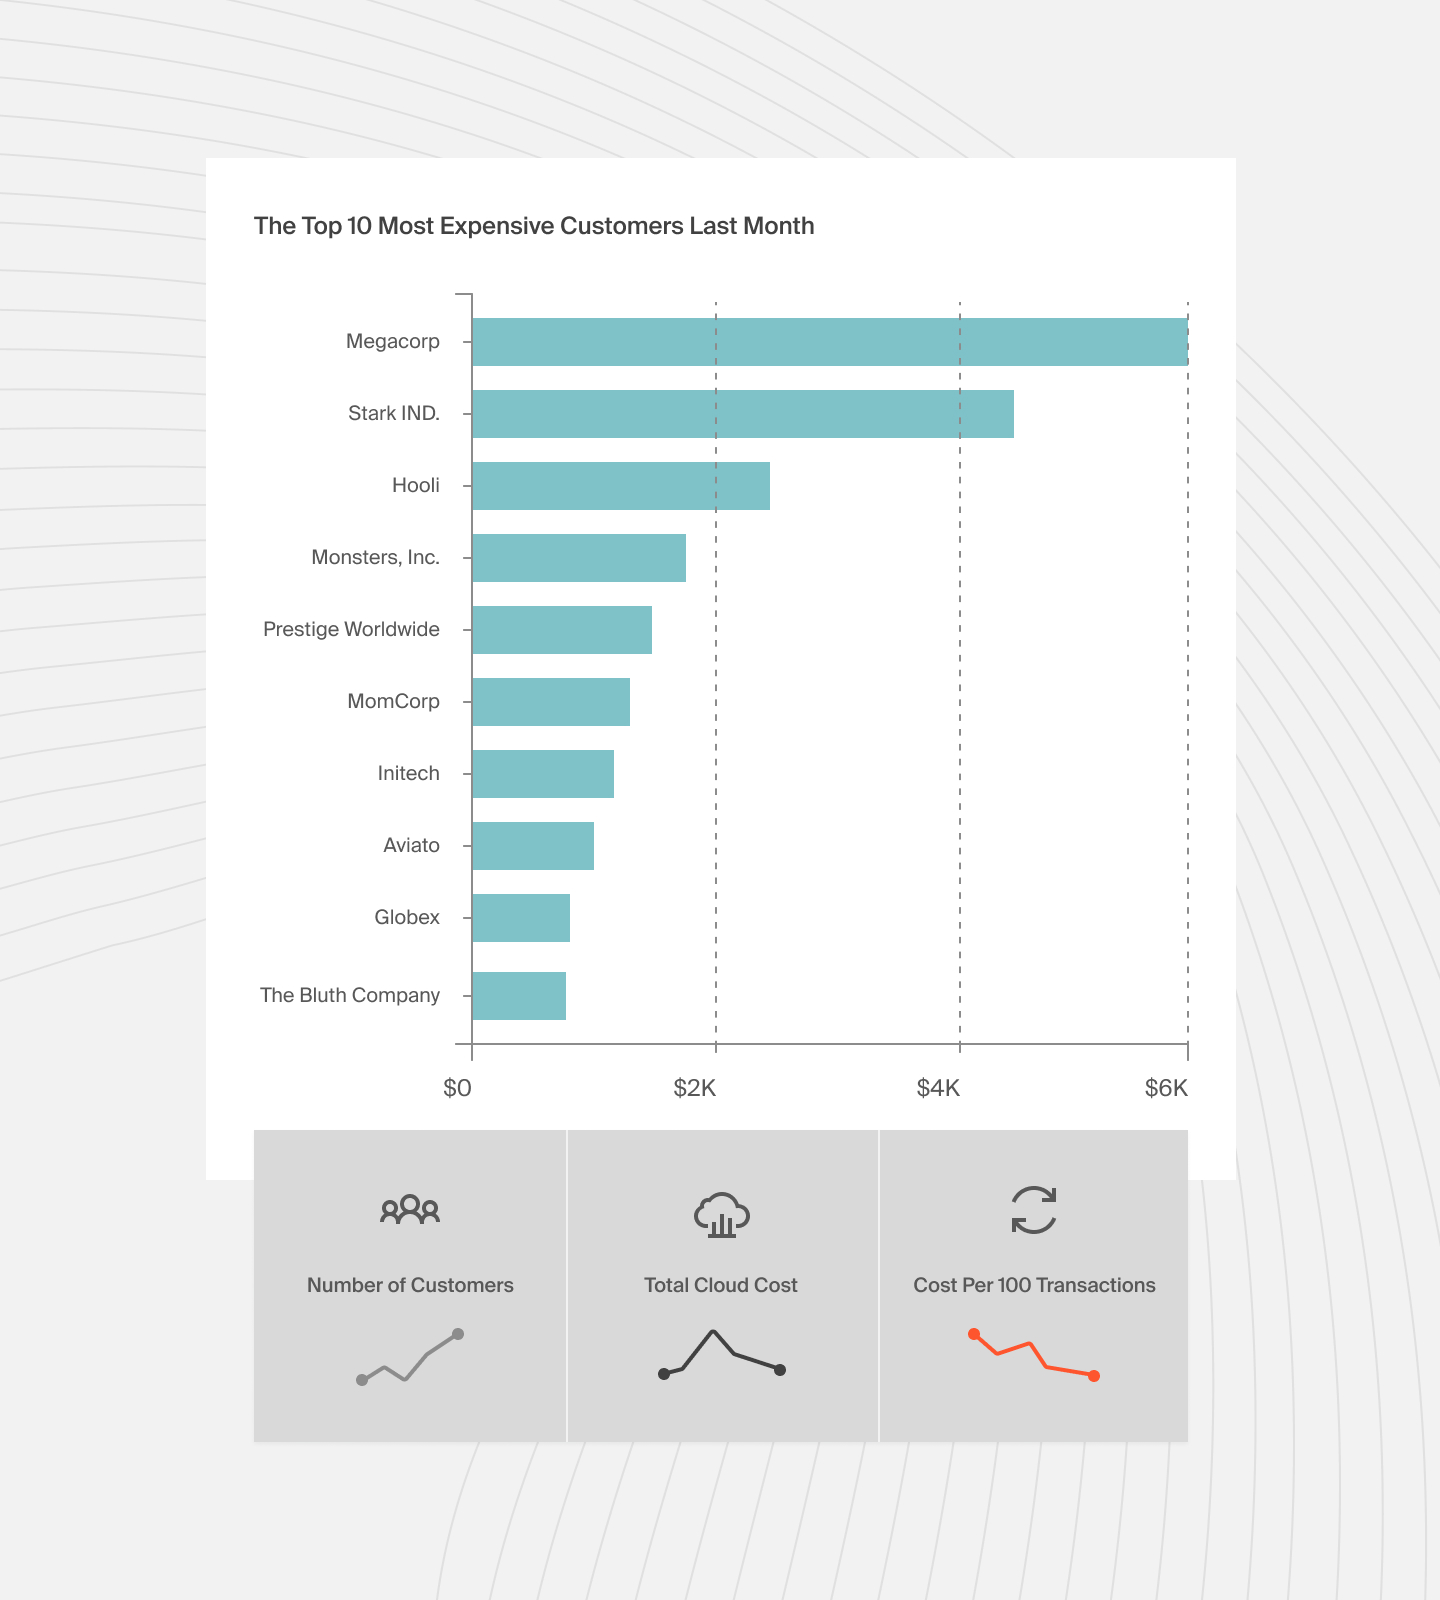
Understanding the cost per customer is crucial for any business using cloud services. CloudZero makes it easy to calculate and analyze this critical metric. The platform links your cloud costs with customer usage. This gives you a clear picture of each customer’s costs.
The data is invaluable for pricing strategies, customer segmentation, and identifying high-cost customers. Calculating your cost per customer helps you make strategic decisions to increase profitability and customer satisfaction.
2. Datadog
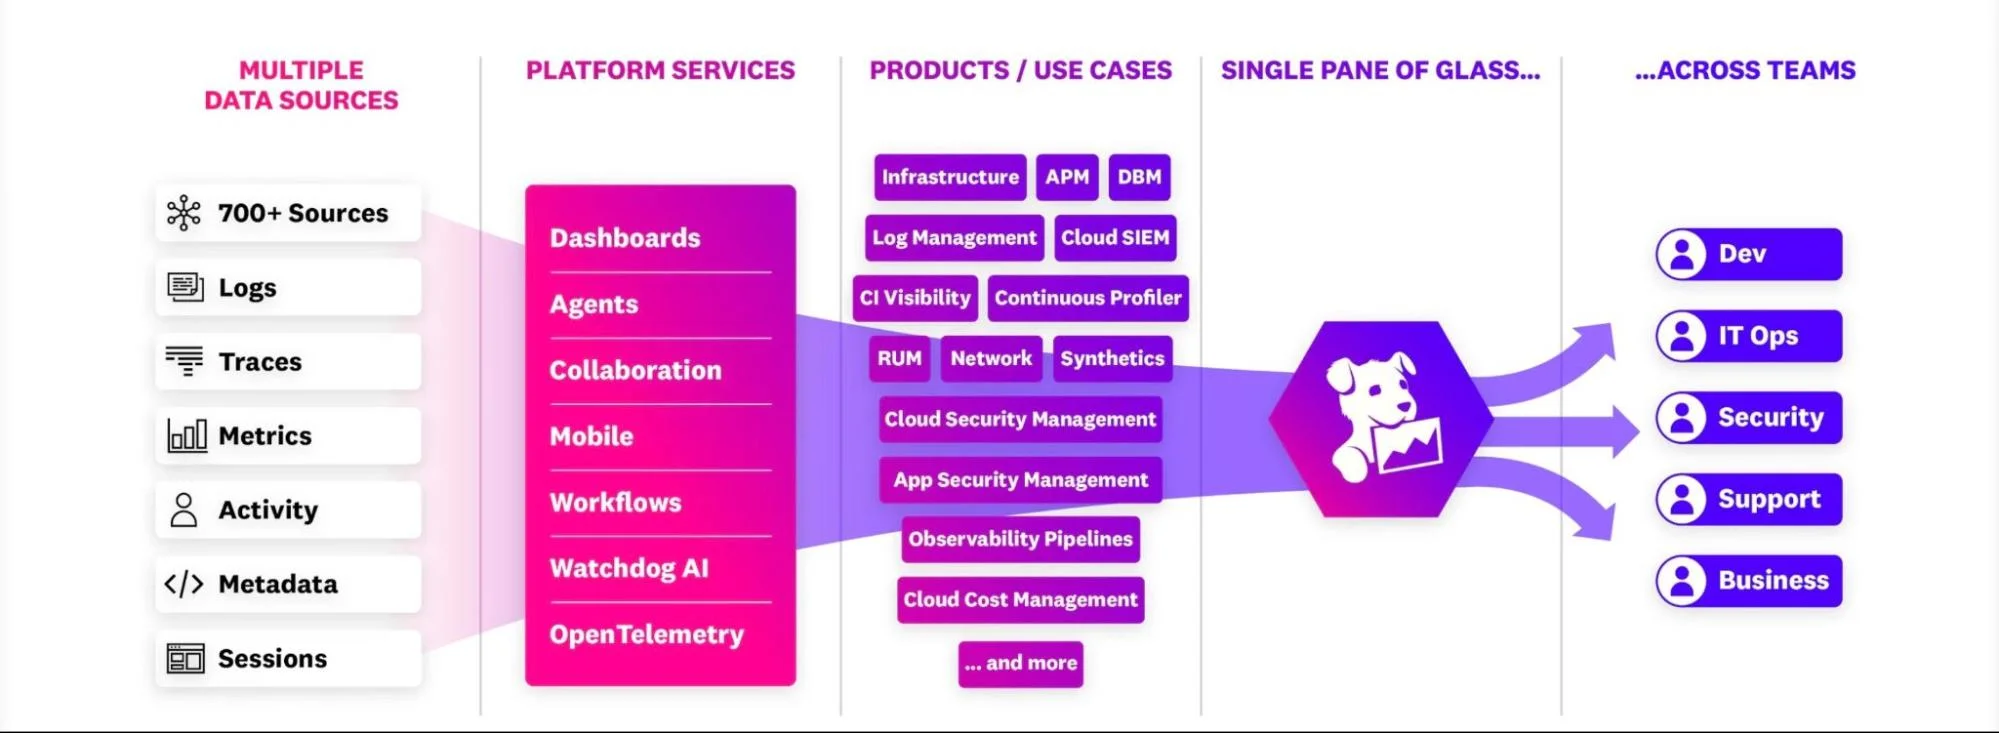
Datadog is an observability tool with robust monitoring, security, and analytics features. With a market share of over 70% in the data center management industry, Datadog leads the cloud observability space by a wide margin.
Datadog offers full-stack visibility by collecting and matching data from over 800 integrations. This allows you to monitor the performance and health of your entire environment in one unified platform.
Its major features are real-time monitoring, advanced logging, and log data analysis. Its AI-powered anomaly detection helps identify and resolve issues before they escalate. The tool also supports customizable dashboards and visualizations that simplify data analysis.
Datadog’s Quality Gates improves code quality monitoring. This feature intervenes during the code merging process to stop the integration of code that does not meet set quality standards. This ensures that only top-quality code is integrated into your project.
Teams can create customized regulations that are in line with their objectives. This ensures the code adheres to high standards, operates without flaws, and upholds security.
Datadog is like the heavyweight champion of the cloud observability world. If you decide it is overkill for your observability needs, see the following Datadog alternatives. We also compiled a guide to Datadog cost management that’ll help you understand and manage your costs better.
3. Amazon CloudWatch
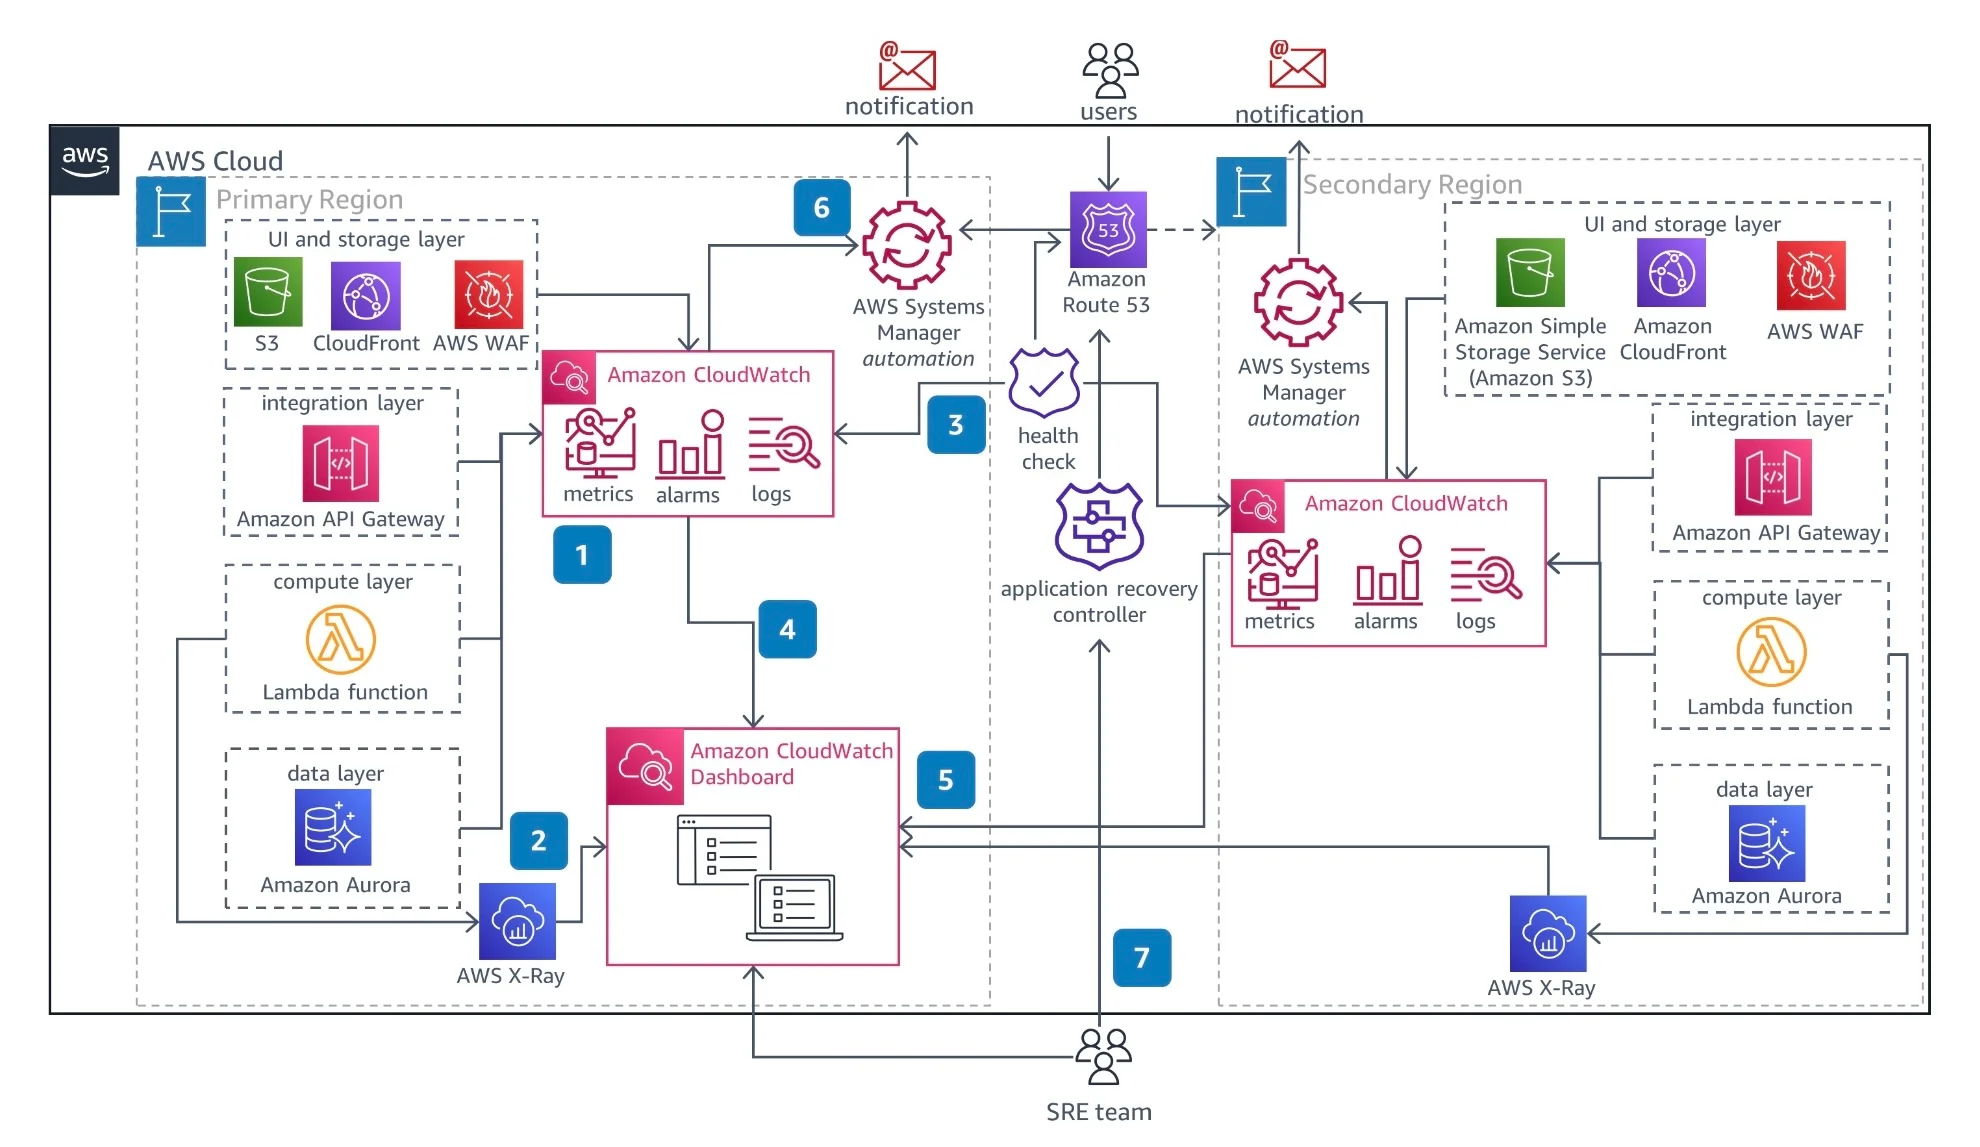
Amazon CloudWatch is an AWS observability tool. It collects logs, metrics, and events from AWS resources, applications, and on-premises servers. Its unified view of your infrastructure helps identify and resolve issues quickly. Users can set alerts, create dashboards, and gain knowledge to maintain and improve performance.
CloudWatch integrates with various AWS services, enabling users to monitor everything from individual instances to clusters. It works with Amazon EKS to offer visibility into Kubernetes cluster performance. Along with Amazon DynamoDB, CloudWatch monitors database activity and performance metrics.
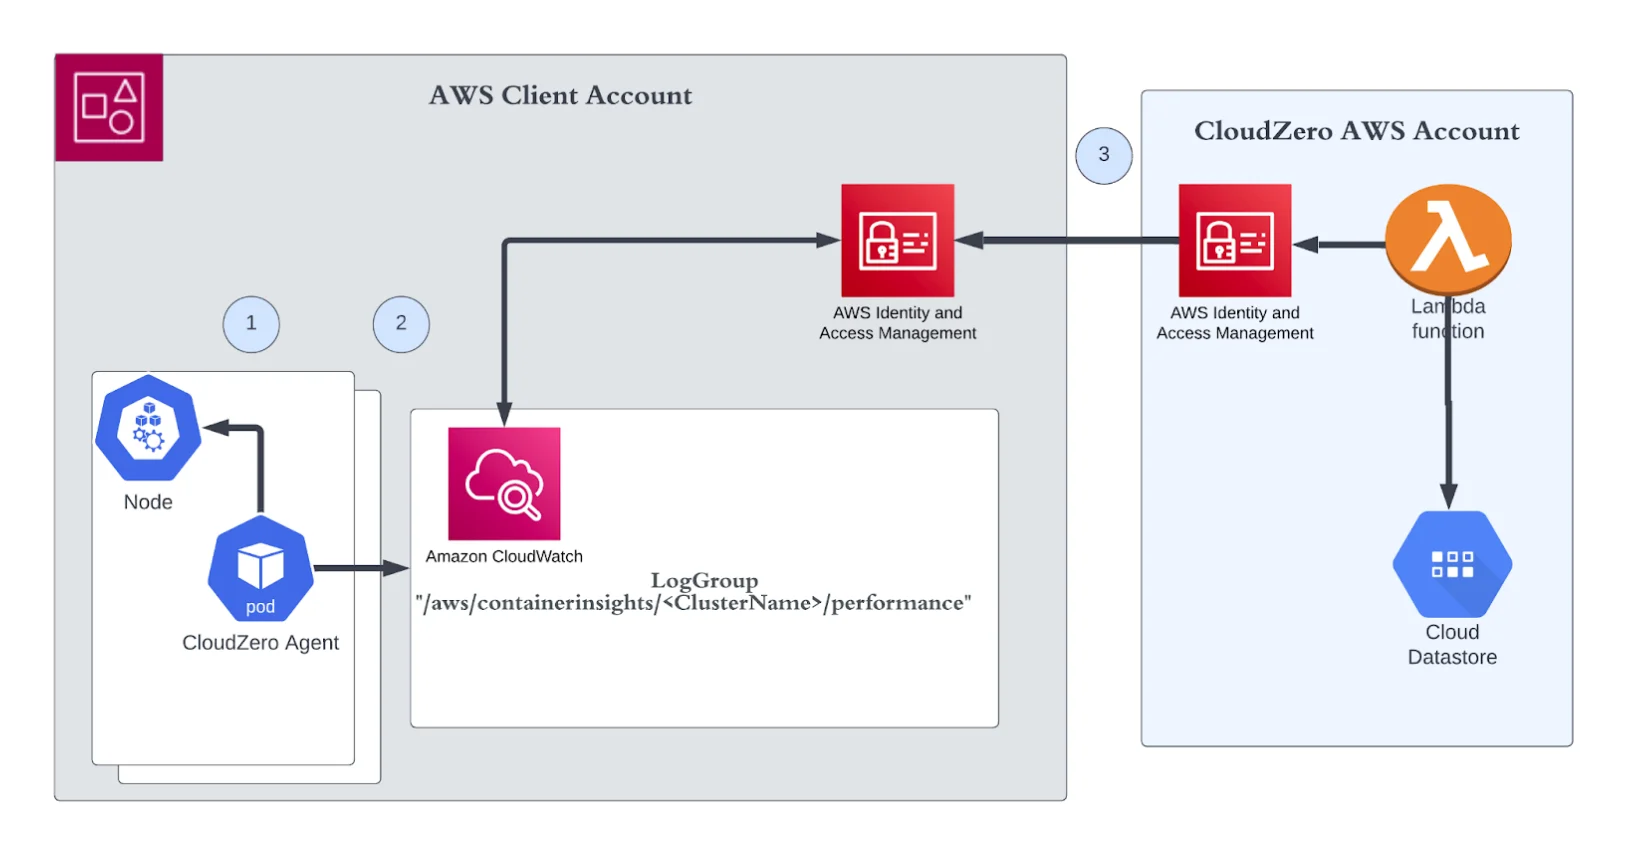
Amazon CloudWatch also integrates with CloudZero to manage container costs in AWS. The CloudZero Kubernetes agent collects performance metrics from applications running in AWS EKS or native Kubernetes on EC2.
These metrics are sent to CloudWatch Logs. CloudZero then aggregates this data and pulls it into its platform. Access is managed via a cross-account role, connecting the account to CloudZero as a Resource Account. This integration helps allocate container costs.
4. KubeSphere
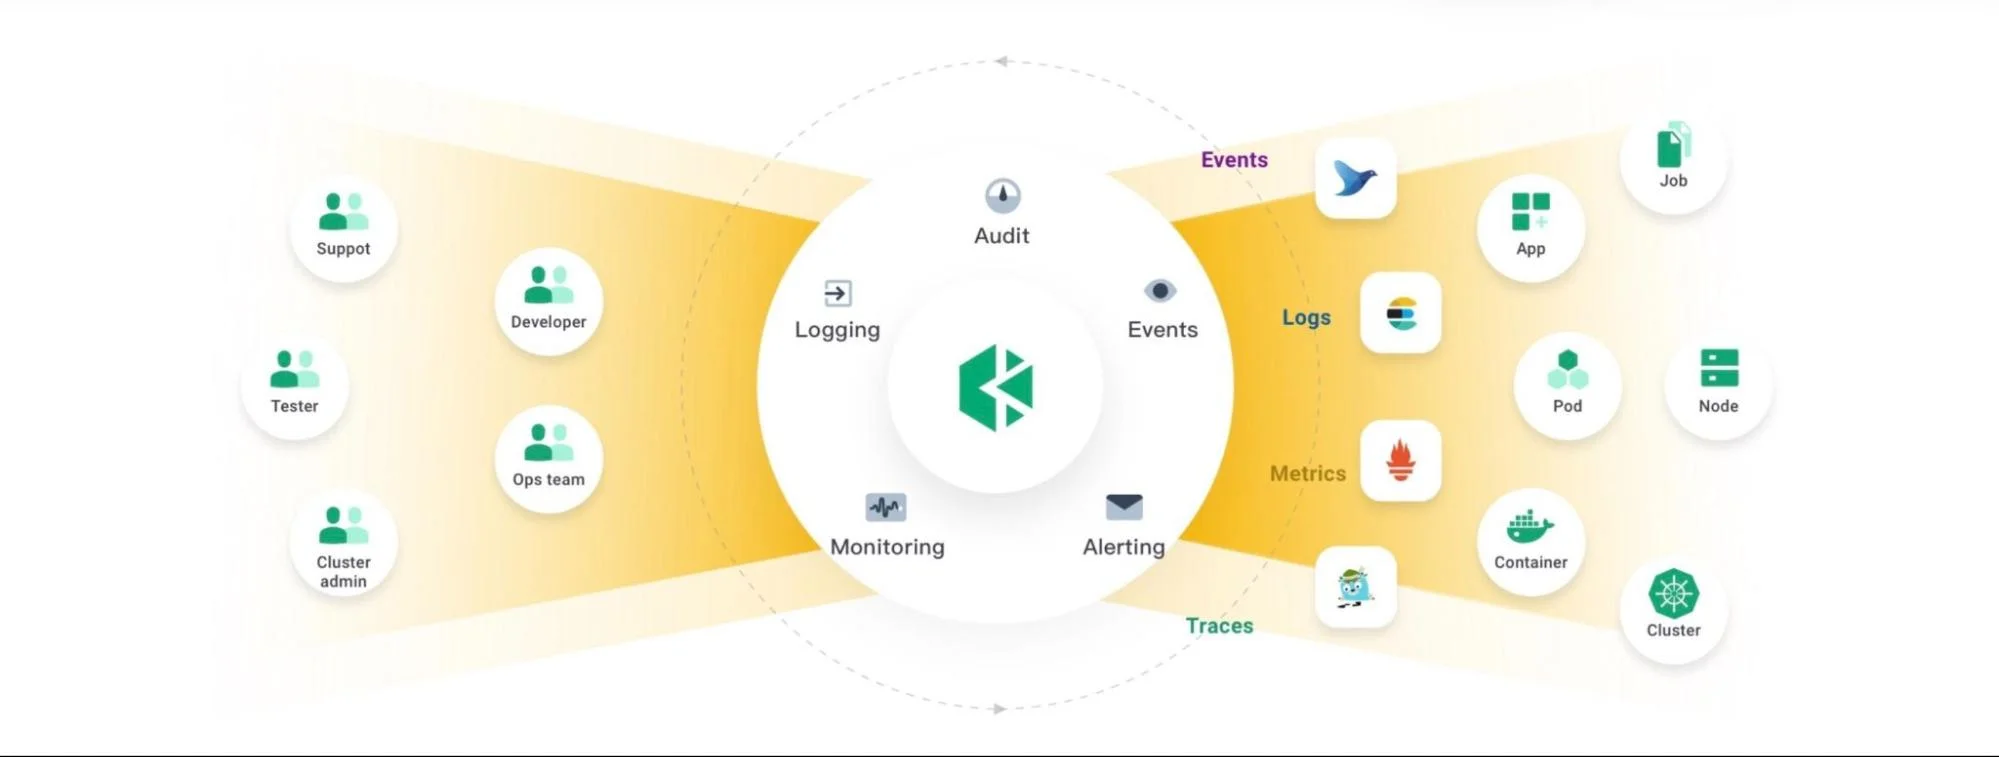
KubeSphere is an open-source, enterprise-level container management platform that streamlines Kubernetes operations. It integrates with Kubernetes, DevOps, and microservices to offer a unified environment.
KubeSphere enhances Kubernetes environments with a centralized observability platform. It monitors the Kubernetes control plane and cluster nodes, as well as CPU, memory, network, and storage for applications.
Users can rank resource consumption on a node, workspace, or project basis. The platform’s service component monitoring detects and resolves component issues. What’s more, users can create custom dashboards for their specific needs with custom metrics support.
KubeSphere’s log management boosts security in multi-tenant environments. It allows tenants to access only their log data and supports multi-level log queries. This enables users to drill down from projects to containers and keywords.
5. New Relic
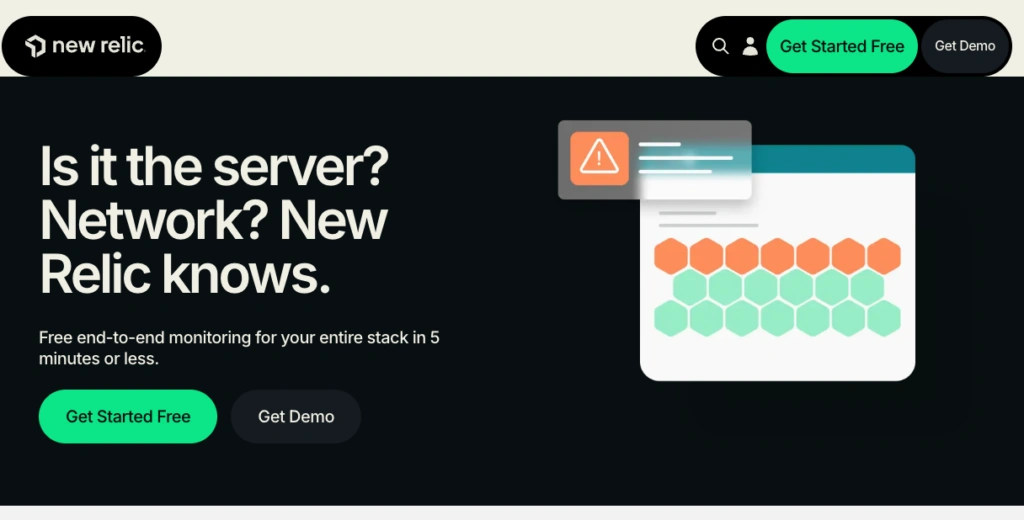
New Relic is a unified observability platform built with developers in mind. It brings together application performance monitoring (APM), infrastructure monitoring, log management, and real user monitoring into a single interface, making it especially attractive for dev-first teams.
A standout capability is APM 360, which provides a panoramic view of application performance that connects easily with deployment changes and anomalies. New Relic’s consumption-based pricing model (you pay for what you ingest) keeps costs predictable for teams scaling their observability practice.
New Relic supports OpenTelemetry natively, so teams already instrumenting with OTel can send data directly without additional agents. Its AI-powered anomaly detection surfaces patterns proactively, and the platform’s clean interface makes it accessible to engineers who want fast answers without a steep learning curve.
6. Grafana
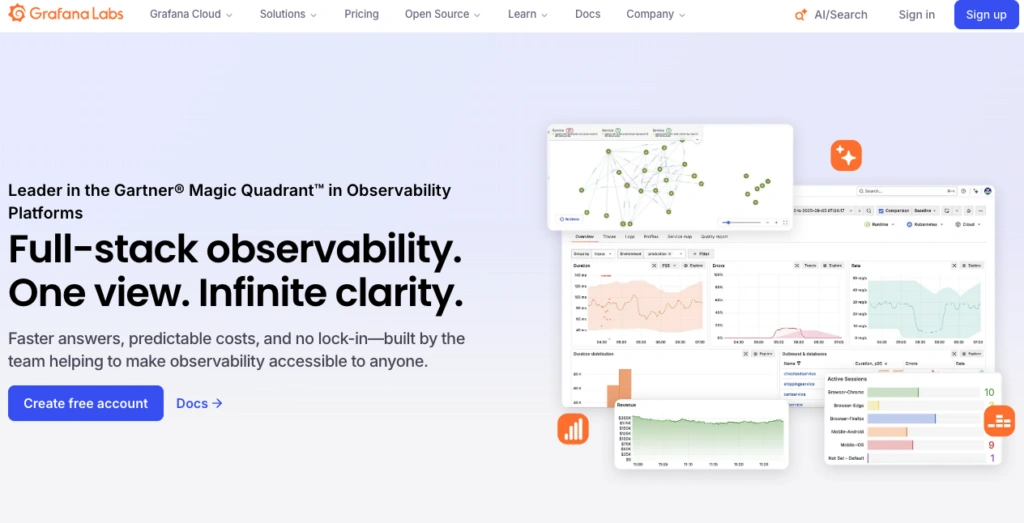
Grafana has evolved from an open-source visualization tool into a full observability stack. The Grafana ecosystem includes Loki for logs, Tempo for traces, Mimir for metrics, and OnCall for incident response, giving teams modular control over their observability pipeline.
The open-source version remains a developer favorite for its flexibility, plugin ecosystem, and compatibility with data sources like Prometheus, InfluxDB, and Elasticsearch. Grafana Cloud adds managed services, AI/ML features, synthetic monitoring, and load testing via Grafana k6.
For teams that value open standards and want to avoid vendor lock-in, Grafana offers a compelling path. Its OpenTelemetry support and data-source-agnostic design mean you can build an observability stack that fits your architecture rather than the other way around.
7. Dynatrace
Dynatrace enhances observability by incorporating contextual details. It goes beyond traditional metrics, logs, and traces to include user experience, security, and topology data. This provides a full context of the observed data, from user impact to entity interdependencies.
Dynatrace’s AI solution, Davis®, automatically detects anomalies and analyzes root causes. This reduces the mean time to resolution (MTTR) and facilitates rapid problem-solving. Its automation ensures scalability and coverage without manual configuration.
OneAgent by Dynatrace automatically detects and instruments various activities, including applications, containers, services, processes, and infrastructure components. This offers immediate high-quality data observability.
Dynatrace also collaborates with Google and Microsoft on the OpenTelemetry project to expand cloud observability coverage. This partnership improves Dynatrace’s capacity for extensive analysis in various cloud environments.
Real-time topology mapping consolidates dependencies between all observability data. It merges metrics, logs, user experience, and security data into a unified, real-time topology map, eliminating limited visibility.
8. AppDynamics (Cisco / Splunk)
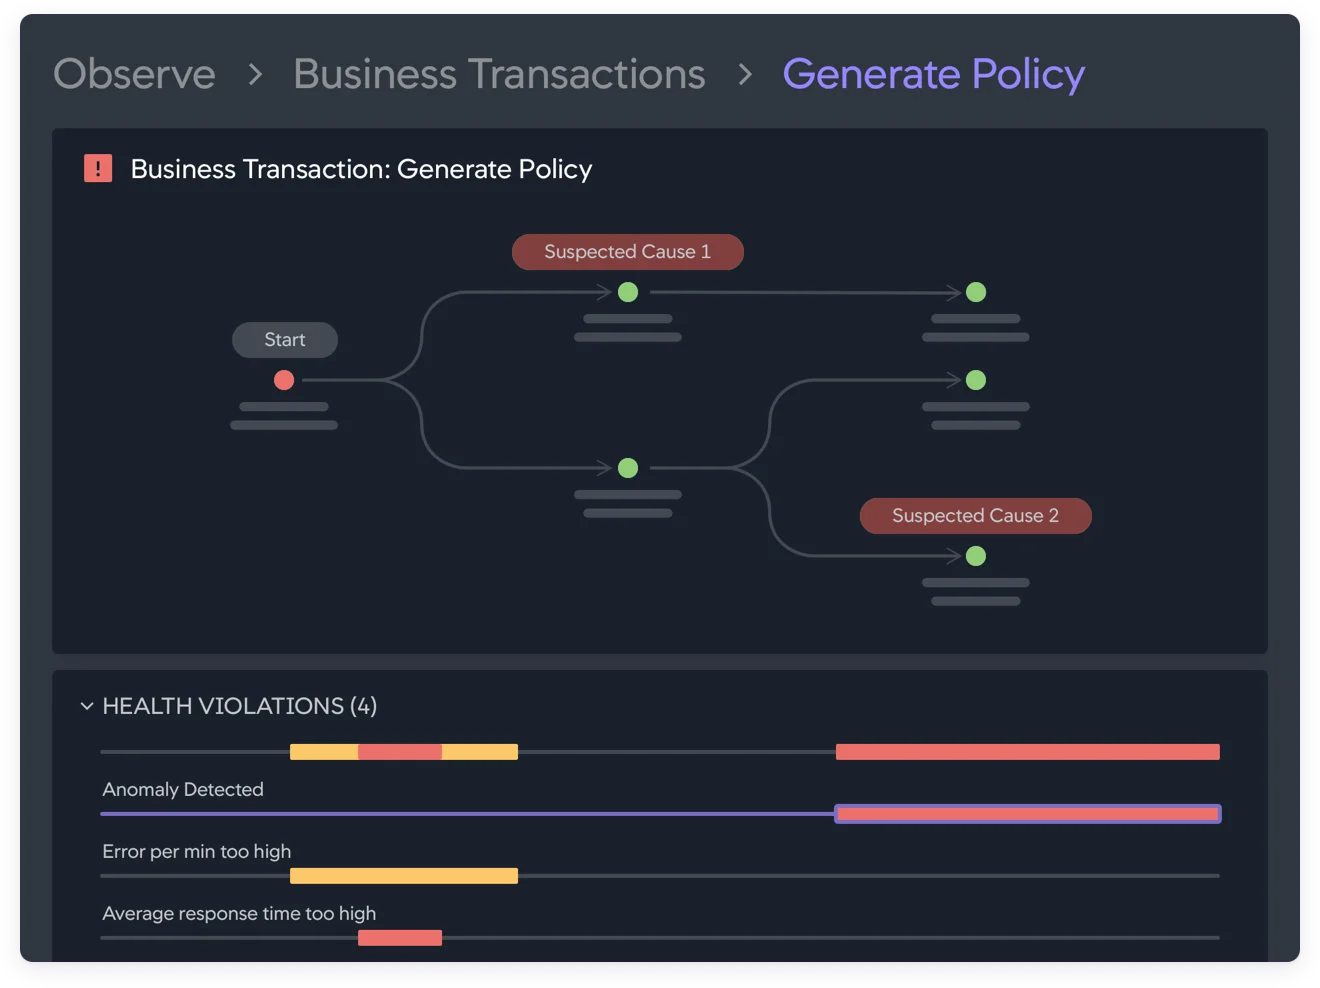
AppDynamics is a full-stack observability tool that offers end-to-end visibility. Following Cisco’s acquisition of Splunk, AppDynamics has been integrated into Splunk’s broader observability portfolio, combining application performance monitoring with Splunk’s data analytics strengths.
Its observability features include infrastructure monitoring, application performance monitoring (APM), database monitoring, and end-user monitoring.
It gives visibility into all infrastructure elements, including networks, servers, and containers. Its APM features detect performance issues and analyze the leading cause.
Database monitoring identifies performance issues in production environments. End-user monitoring tracks user experiences to pinpoint where users connect or fail to connect with your product.
AppDynamics also connects application performance with business results. This perspective helps teams make informed decisions that boost earnings and digital evolution. It addresses issues before they impact digital experiences, protecting crucial business metrics. Its AIOps capabilities enable rapid prioritization, isolation, and remediation of issues.
9. Sumo Logic
Sumo Logic is tailored for Kubernetes environments. It simplifies the collection and visualization of logs, metrics, and traces from Kubernetes clusters. This is essential for handling the complex nature of Kubernetes deployments.
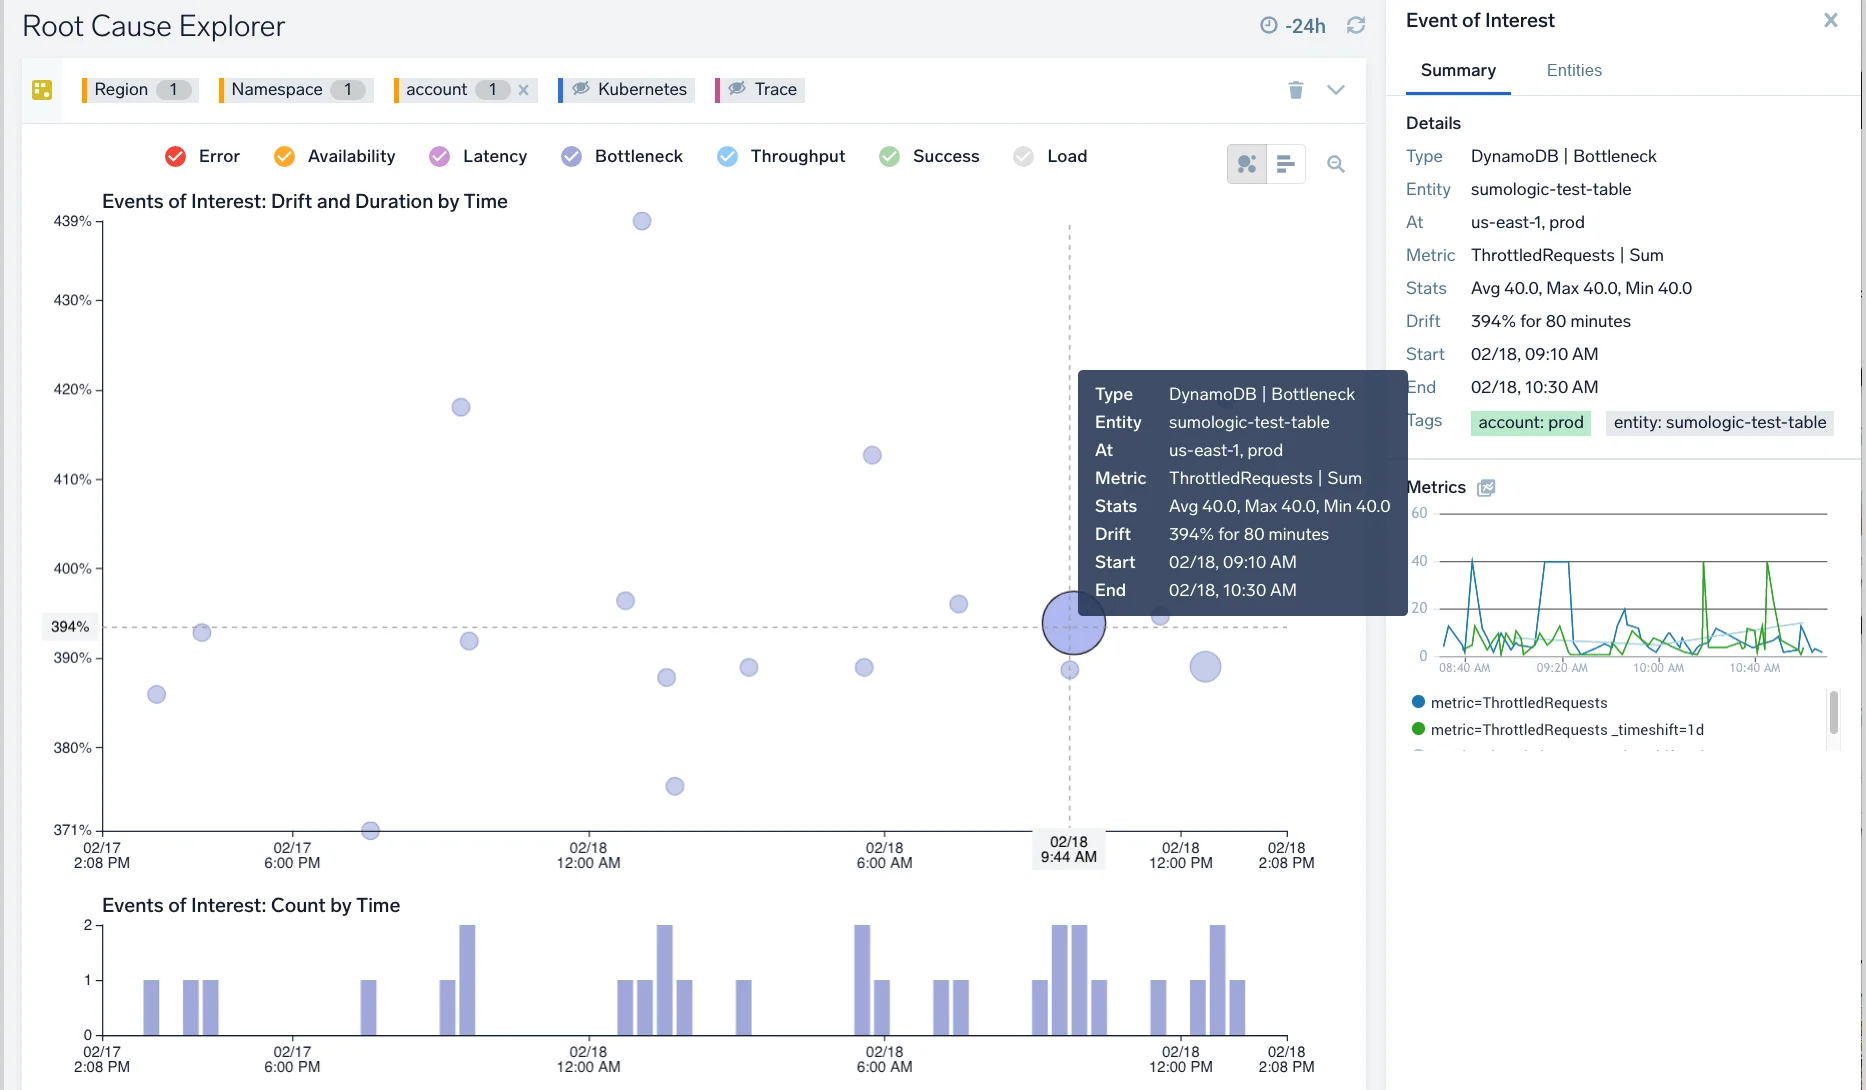
The tool’s machine learning algorithms identify anomalies and uncover the root causes of issues. Its observability feature, Root Cause Explorer, tracks down the exact origin of issues. This leads to faster resolutions and less user disruption, which is crucial in environments with complex interdependencies and large amounts of data.
Sumo Logic also delivers real-time insights into application performance. This allows teams to quickly track performance metrics and resolve issues.
10. Splunk
Splunk is one of the few observability platforms that bridges the gap between IT operations and security. Its Observability Cloud combines APM, real user monitoring, infrastructure monitoring, and log analytics, while its core SIEM capabilities keep security teams working from the same data.
With over 1,000 integrations and a powerful search language (SPL), Splunk handles high-cardinality data at scale. Teams already invested in Splunk for security often extend it to observability for the operational efficiency of a single telemetry pipeline. AI-driven anomaly detection and SOAR (Security Orchestration, Automation, and Response) capabilities help reduce mean time to resolution across both performance and security incidents.
The trade-off is complexity and cost — Splunk’s learning curve is steeper than most alternatives, and ingestion-based pricing can escalate quickly. But for enterprises where observability and security need to share context, it remains a strong contender.
11. Prometheus
Prometheus is the open-source monitoring and alerting toolkit that has become the de facto standard for cloud-native environments. Originally built at SoundCloud and now a graduated project of the Cloud Native Computing Foundation (CNCF), Prometheus excels at collecting and querying time-series metrics from containerized workloads.
Its pull-based architecture scrapes metrics from instrumented endpoints on a configurable schedule, storing them in a local time-series database optimized for high-dimensional data. PromQL, its native query language, gives engineers precise control over alerting thresholds and dashboard expressions.
Prometheus pairs naturally with Grafana for visualization and with Alertmanager for routing notifications. For teams running Kubernetes, it integrates seamlessly via kube-state-metrics and node-exporter. While Prometheus focuses on metrics rather than full-stack observability (it doesn’t handle logs or traces natively), it is a foundational building block that many organizations combine with tools like Loki and Tempo for a complete open-source observability stack.
playbook
The AI Cost Optimization Playbook
Traditional cloud cost management is broken. Here’s why — and how to make the switch to cloud cost intelligence.
Discover The Power Of Unified Cloud Management With CloudZero
The complexity of modern cloud environments demands a solution that can handle multiple aspects of cloud management. CloudZero integrates with your existing tools and workflows to offer a unified view of your cloud operations. This integration ensures you can manage costs and optimize performance on a single platform.
Want to see how CloudZero correlates cost data with usage to help you make better cloud decisions?  and improve your cloud management today with CloudZero.
Software and pricing information last verified May 2026. Features, pricing, and availability may have changed. Please verify current details with vendors before making decisions.


