
As an engineer or CTO, you already know that monitoring your tech stack is essential for maintaining optimal performance, security, and health. The thing is, building and hosting an observability platform for your full stack’s logs, metrics, and more is quite time-consuming and can be costly.
One of the top contenders if you are seeking a SaaS-based monitoring and observability tool is Datadog. Perhaps you already use Datadog but would like to switch to another observability platform.
In this post, we’ll look at some of the best Datadog alternatives and competitors to consider today. We promise to keep it short and sweet for each Datadog comparison to help you make quick decisions.
What Is Datadog?
Datadog is a full-stack observability platform that organizations use to monitor their real-time application, network, server, synthetic, end-user, and infrastructure health in one place. The platform helps monitor both on-premises and cloud-based IT infrastructure, too.
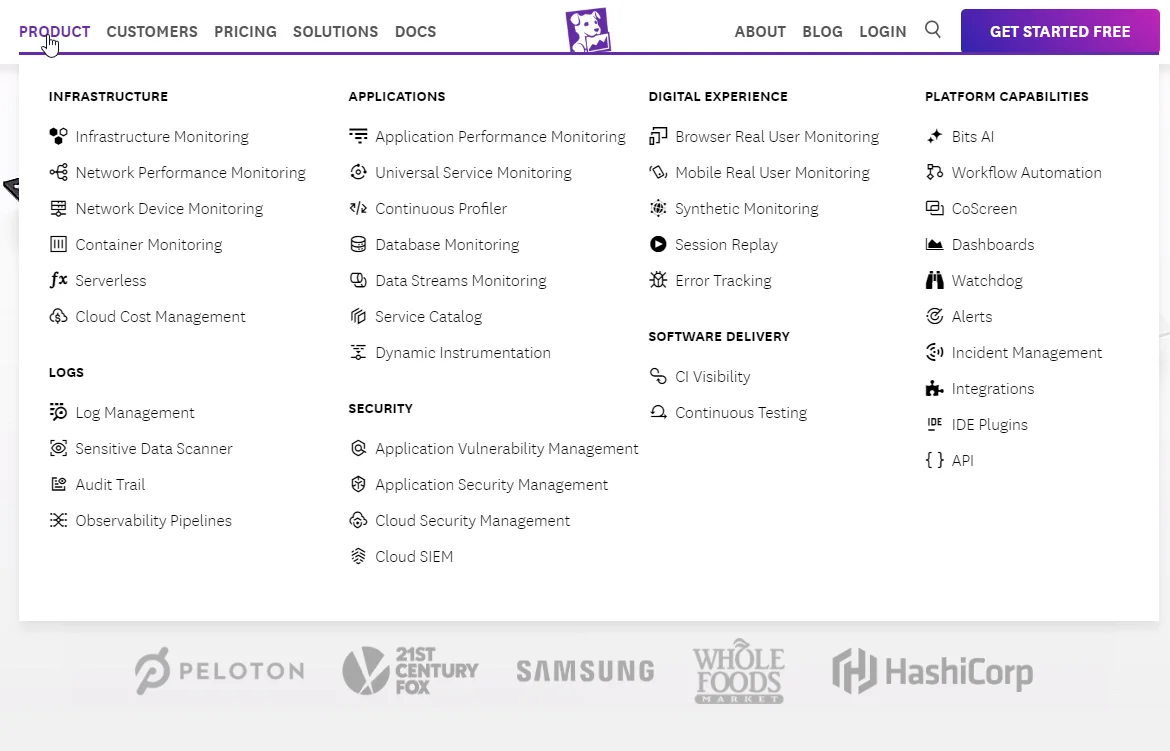
Importantly, Datadog provides a unified view of data generated across all aspects of IT infrastructure, making it ideal for enterprise use cases.
More importantly, Datadog is used for interpreting this IT infrastructure data into actionable insights that help improve overall system efficiency and security.
Datadog features
- Use across platforms, including web-based apps, Linux, Windows, Mac, and Self-hosted applications
- Performs both data collection and analysis across on-premises and cloud environments (AWS, Azure, GCP, Oracle Cloud, etc)
- Collect and analyze logs, metrics, events, and request traces from all your applications, services, and platforms
- Has a Go-based agent architecture
- Infrastructure monitoring
- Application performance monitoring
- Log management
- Security monitoring
- Network monitoring
- Synthetics monitoring
- End-to-end Real user monitoring (RUM)
- Serverless application monitoring
- Real-time, interactive, and customizable dashboards
- Automated alerts for a single host or entire cluster via Slack, email, PagerDuty, ServiceNow, etc.
Datadog enables DevOps teams and system admins to monitor any stack and application from anywhere and at any scale.
The case for Datadog alternatives: Why switch to Datadog competitors?
There are several reasons why you might choose to opt for a top alternative to Datadog.
- Datadog’s unpredictable and complex billing can lead to surprisingly high monitoring costs (which is by far the most common complaint about Datadog pricing we see)
- High SKU-based pricing makes predicting costs a challenge
- High custom metrics pricing (starts at $0.05 per custom metric per month)
- Complex log ingestion, indexing, retention, and pricing process
- Datadog documentation could be improved
- Others feel customer support is lacking
- Complains of vendor lock-in
- Datadog’s high-pressure sales tactics may not be the best way to sign up or keep customers
- Log analyses can be slow and Datadog also lacks a query language, limiting exploratory analysis
- Scaling usage can be challenging and costly
If these and other Datadog limitations are a big concern for you, here are top monitoring tools similar to Datadog you can consider switching to.
Research Report
FinOps In The AI Era: A Critical Recalibration
What 475 executives told us about AI and cloud efficiency.
AppDynamics
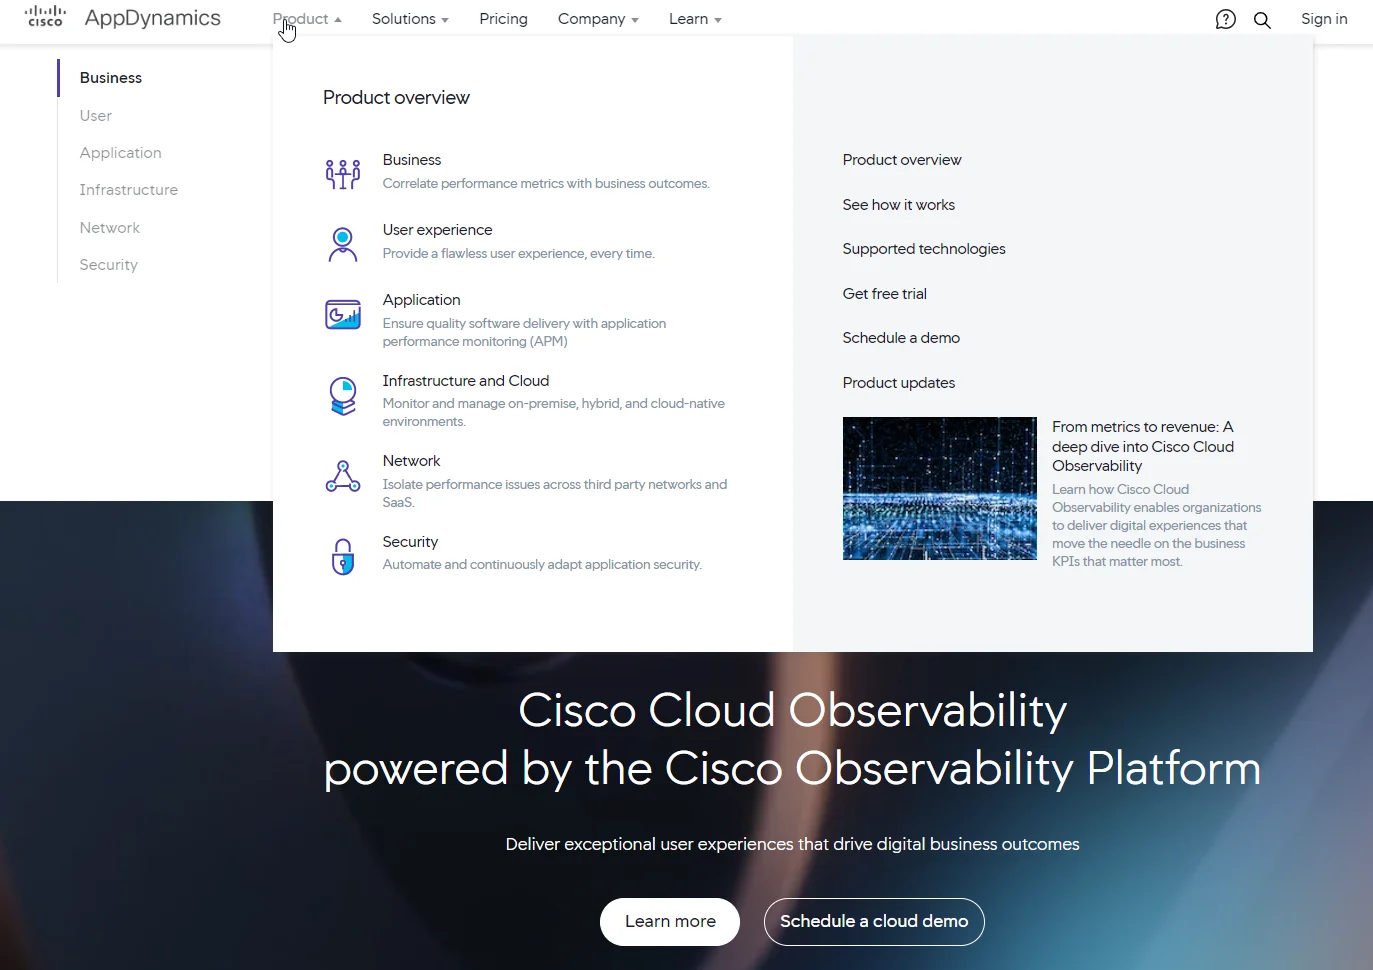
Like Datadog, Cisco’s AppDynamics is a full-stack observability platform. Yet, AppDynamics is best known for its application performance monitoring (APM) functionality. It is also a robust Datadog alternative for End-User Monitoring (EUM), enabling you to view a lot from page-loading details to end-user errors.
AppDynamics features
- Uses agent and controller for data collection
- Automated code diagnostics
- Flow map visualizations for end-user analytics
- Application mapping with root cause analysis support
- AI-driven anomaly detection engine
- Automatic discovery
- Synthetic monitoring
- Automated alerting system
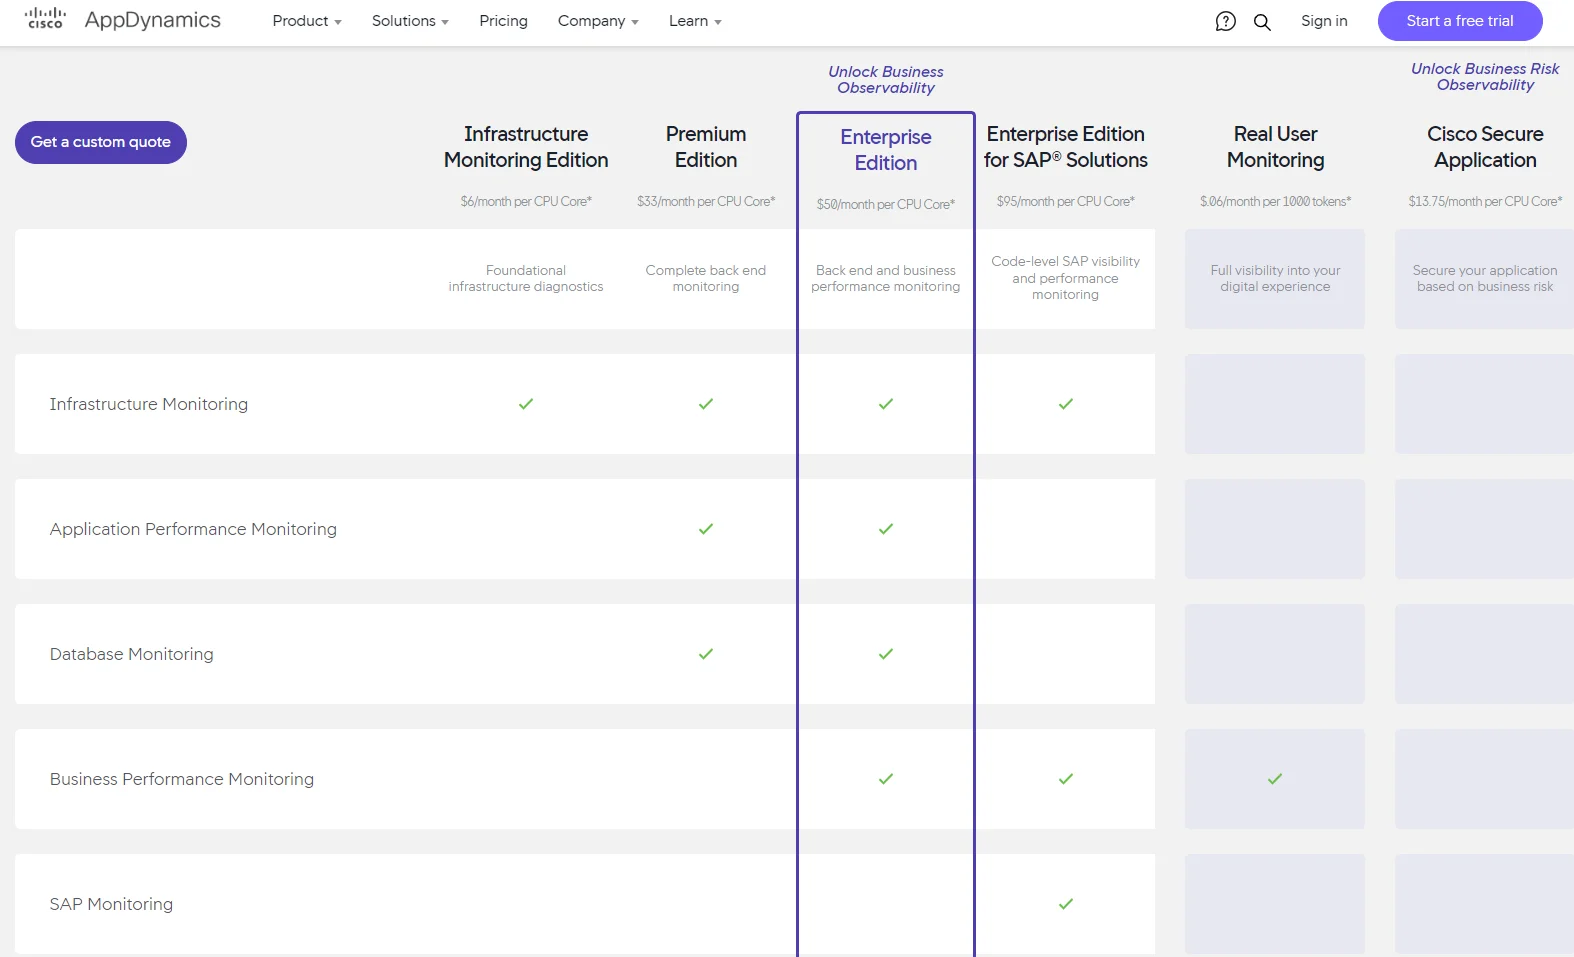
AppDynamics pricing
AppDynamics pricing is based on what service you use. You’ll have six options to choose from, starting with Infrastructure Monitoring Edition for $6 per month per CPU core to the Cisco Secure Application edition at $13.75 per month per CPU core. Here’s a sneak peek:
AppDynamics pros
- All-in-one observability platform similar to Datadog (supports metrics, events, logs, and traces, too)
- Excellent End User monitoring promotes better user experiences
- Supports a variety of languages, operating systems, and cloud providers
- Real-time APM function provides code-level observability
- Easier to integrate and deploy compared to Datadog
- Offers solid global infrastructure via Cisco
- Supports runtime architectural evaluation
- Provides deep monitoring across infrastructure, EUM, server, APM, and networks in hybrid cloud environments
AppDynamics cons
- Can be complex and challenging to learn and manage
- Can be expensive (although less so than Datadog)
- Basic querying for logs and metrics
- Custom log parsing is limited
Azure Monitor
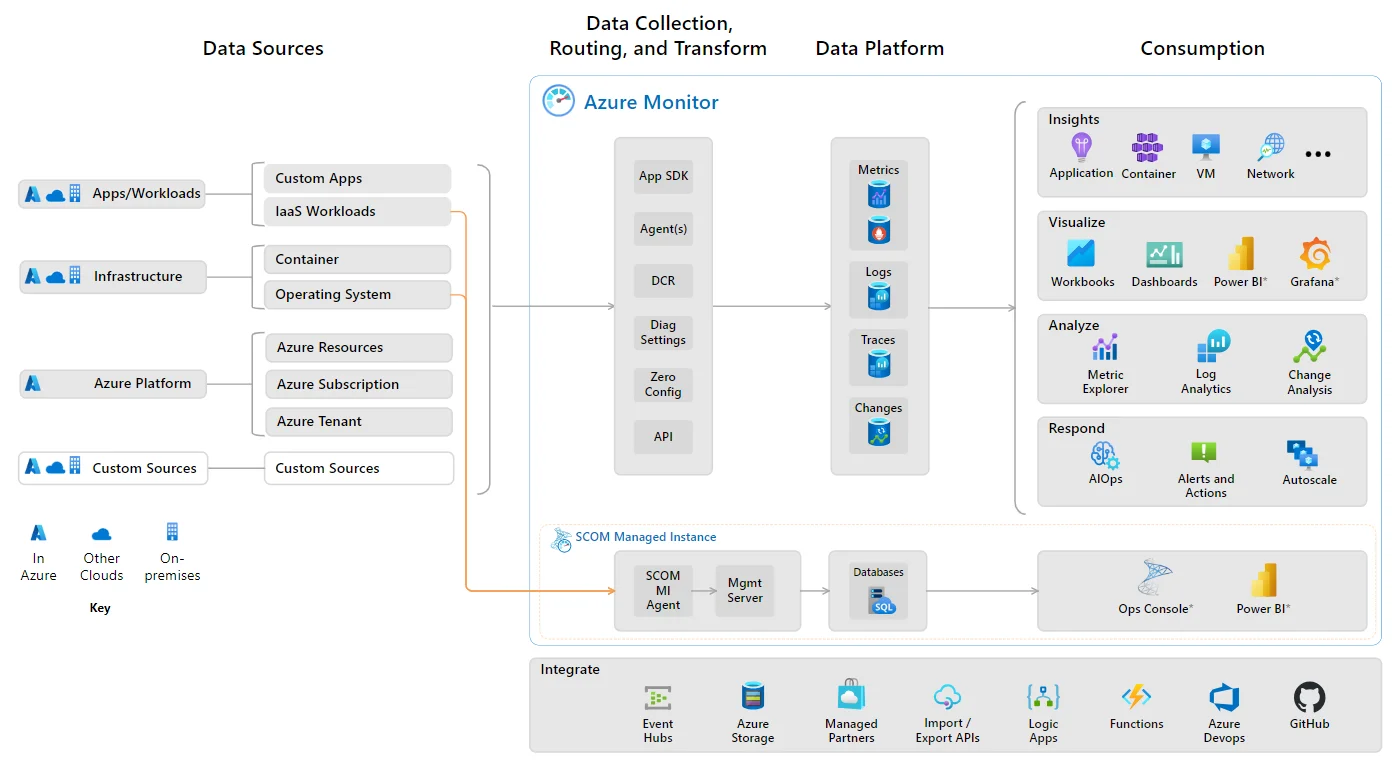
This is where you may want to start if you use the Microsoft Azure cloud platform. Azure Monitor is the native observability platform for Azure infrastructure components. The tool is especially useful if you are still figuring out cloud monitoring best practices.
Azure Monitor features
- Monitor IT resources in the Azure cloud, other clouds, and on-premises
- Infrastructure, network, and applications monitoring
- Virtual machine and database monitoring
- Container monitoring
- Security monitoring with Azure Sentinel
- Open-source architecture to integrate other monitoring tools
Azure Monitor pricing
Pricing for Azure Monitor is pay-as-you-go, meaning you pay based on usage. Ingestion, retention, and alerting are all part of that usage. Be sure to check the most up-to-date cost details on the official Azure Monitor pricing page.
Azure Monitor pros
- Integrates seamlessly with other observability tools (both Microsoft and non-Microsoft tools)
- Scales Azure monitoring more seamlessly vs Datadog
- Supports both cloud and on-premises monitoring
- Provides multi-cloud or hybrid cloud monitoring (Azure and non-Azure tenants and subscriptions)
- Works with metrics, distributed traces, logs, and changes (series of events in resources and apps)
- Provides alerting automation
- Offers a web-based portal as an alternative to command-line tools
Azure Monitor cons
- Application-level monitoring can be challenging
- Alerts are limited to just two conditions
- Doesn’t support monitoring serverless apps
- Limited notifications channels out-of-the-box (SMS, email, webhooks)
Chronosphere
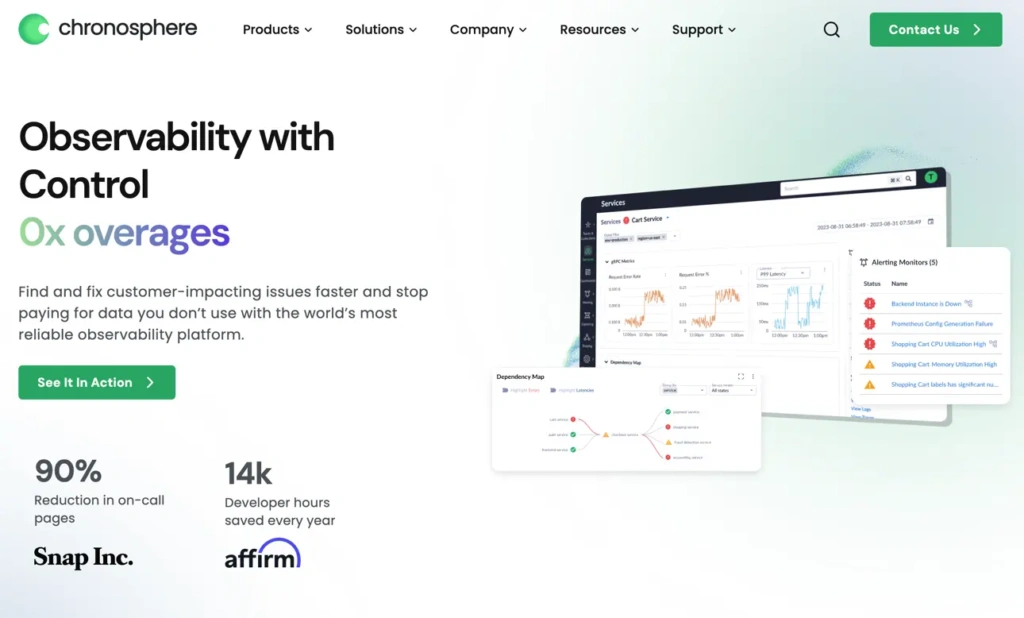
Chronosphere offers an observability platform that ingests metrics, events, logs, and traces in a variety of formats from open source (OpenTelemetry, Prometheus) to proprietary (DogStatsD). The product is optimized for companies running containerized and microservices architectures and provides visibility across infrastructure, applications, and business.
A highlight in the Chronosphere observability platform is the control plane that enables observability data optimization — a requirement to align observability data value with its cost. It allows observability teams to maintain centralized control and the ability to delegate responsibility to service teams to control their own data growth, when appropriate.
Chronosphere features
- Infrastructure monitoring
- Container/Serverless monitoring
- Log management
- Distributed traces
- Telemetry Pipeline
- Open source integration
- Integration with AWS, GCP, and Azure
- Control plane
Chronosphere pricing
Chronosphere has a unique pricing model – instead of pricing based on host or VM, they only charge for the useful data that customers choose to retain. With their Control Plane, customers can analyze and shape observability data to fulfill existing dashboard and alerting needs without having to store all the data in the raw form.
Unlike other observability solutions that require customers to store, query, and pay for all data, whether or not it is useful, Chronosphere pre-computes the data to get rid of the waste and efficiently delivers it to the glass.
Chronosphere pros
- Ability to transform and reduce observability data and therefore costs
- Observability cost governance and charge-back capabilities
- Scalable and reliable single-tenant architecture
- Open-source based for metric, log, trace, and event ingestion
- Native container monitoring
- Service-centric views for faster troubleshooting
- No overages and fair pricing model based on valuable data
Chronosphere cons
- Limited security monitoring
- Limited end user and digital experience monitoring
- No agent or self-instrumentation
CloudZero
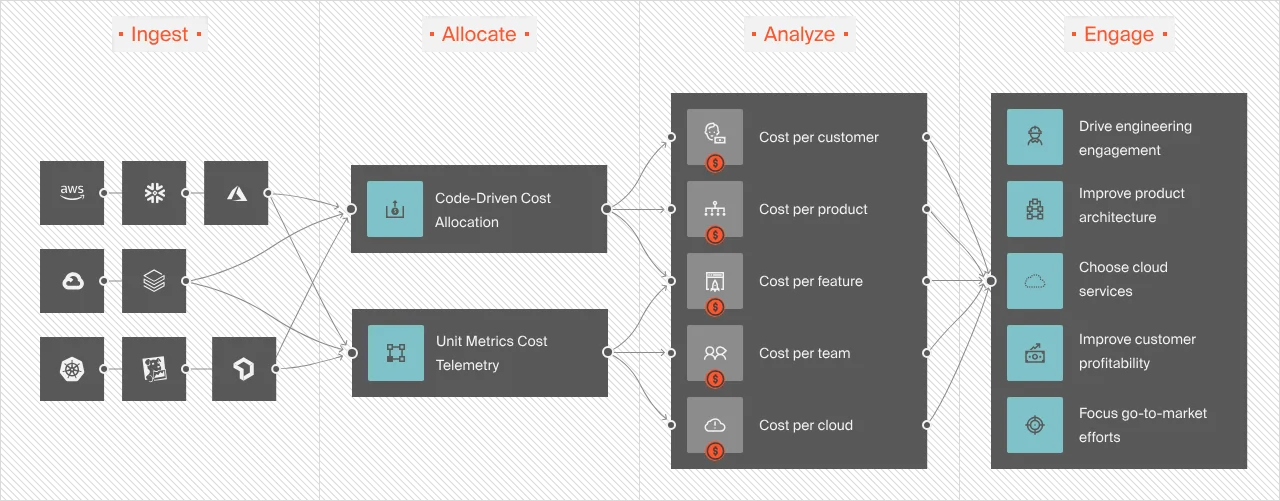
CloudZero is a cloud cost optimization platform that works more like an observability solution than a traditional cloud cost management tool. This enables CloudZero to deliver cloud cost intelligence at a level Datadog has yet to achieve.
CloudZero features
- Data normalization enables cost data ingestion, normalization, and analysis from multiple sources with or without perfect tags
- Engineering-Led Optimization (ELO)
- Real-time cost allocation provides immediate access to actionable cost information
- Unit cost analysis enables cost-per-unit reporting
- Industry-leading Kubernetes cost analysis
- Single-source of truth for cloud costs; CloudZero AnyCost supports cost analysis for AWS, Azure, GCP, and Oracle Cloud
- View platform costs in a single, interactive dashboard; supports Datadog, New Relic, MongoDB, Snowflake, Databricks, and more
- Real-time cost anomaly detection
- Committed discount optimization portal
- CloudZero Advisor for rightsizing cloud resources
CloudZero pricing
CloudZero’s tiered pricing model is stable, predictable, and doesn’t fluctuate monthly. There are no monthly overages (yes, you pay the same price even if your cloud spend spikes one month).
CloudZero pros
- Delivers real-time cloud cost allocation to prevent overspending before it happens
- Offers a cloud-native cloud cost optimization solution
- Enables allocating 100% of your spend regardless of how complex your environment is
- Connects in minutes and starts delivering value almost right away
- Offers immediately actionable insights in the form of per-unit cost insights, such as cost per customer, per feature, per environment, and more
- Shares both high-level cost data (such as total and average costs) as well as more detailed insights (such as cost per team, per service, per deployment, and more)
- Provides timely, noise-free, and context-rich cost anomaly alerts to reveal root causes and fix them to prevent budget overruns
- Captures accurate cost data without perfect tags (including tagged, untagged, and untaggable resources)
- Provides a human, certified FinOps professionals to help you maximize cloud savings and returns on an ongoing basis
CloudZero has already enabled companies like Drift (saved $4 million on AWS) and Symphony Talent (reduced its AWS costs by 48%), and MalwareBytes (now save up to 10 hours weekly managing cloud costs) to better understand, control, and optimize their cloud costs. You can too.  to experience CloudZero for yourself.
CloudZero cons
- Not designed to track committed use discounts such as Reserved Instances and Savings Plans
- It is a dedicated cloud cost monitoring and optimization platform, not an-all-in-one tool for infrastructure monitoring or APM
Dynatrace
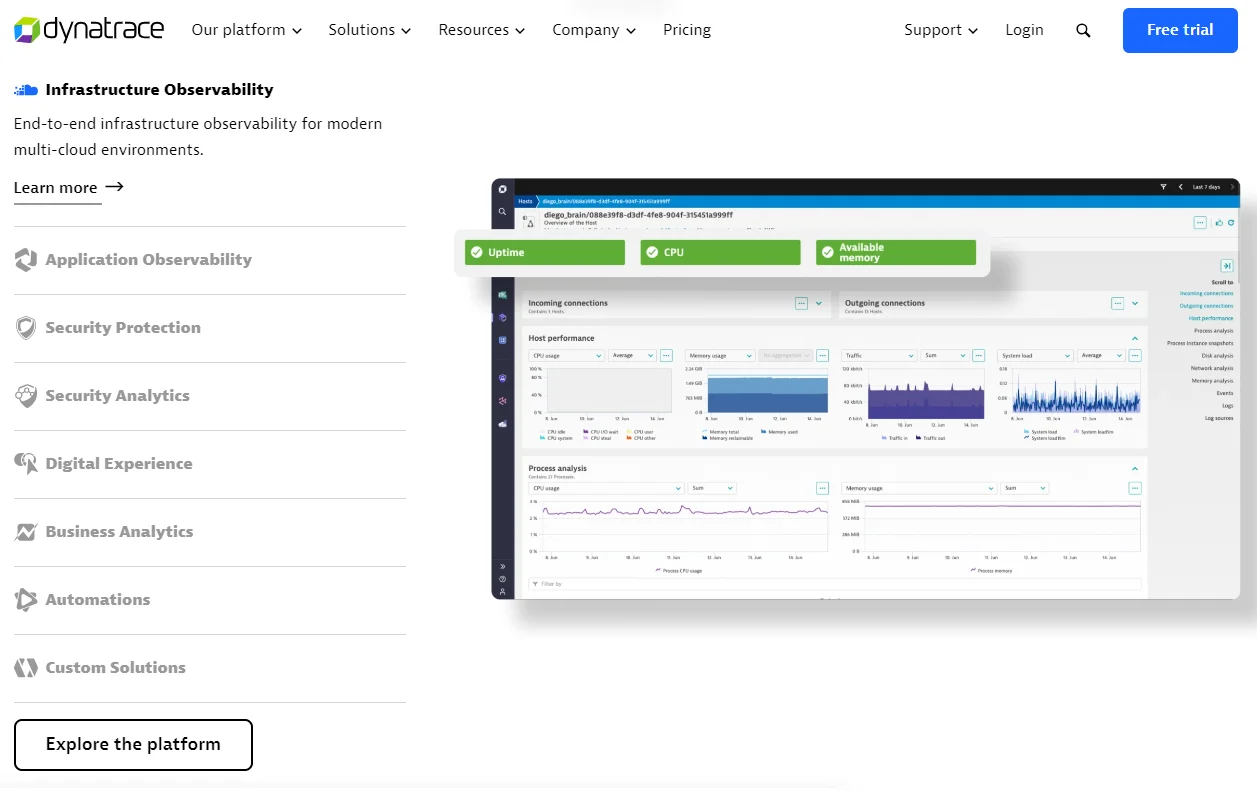
A highlight feature of the Dynatrace observability and security platform is that it uses causal AI to power its automation and analytics capabilities. Like Datadog, Dynatrace is an end-to-end observability platform with a unified, interactive dashboard.
Dynatrace features
- Agent-based observability platform
- Infrastructure monitoring
- Security vulnerability monitoring across hosts, containers, and applications
- Digital experience monitoring (real user monitoring)
- Hybrid cloud and multi-cloud monitoring
- Application performance monitoring (APM)
- Business analytics
- End-to-end data encryption and access control
Dynatrace pricing
Aside from host unit pricing, Dynatrace also uses Davis data units (DDU) to bill ingestion, which is its custom currency.
Dynatrace pros
- Delivers robust AI-powered analyses and reporting
- Supports real-time observability across enterprise-scale and multi-cloud environments
- Offers top-notch APM monitoring
- Supports root cause analysis to surface issues at the source
- Ensures robust continuous monitoring with its self-discovery feature
- Offers diverse integrations portfolio to expand its functionality
- Facilitates full-stack monitoring similarly to Datadog
Dynatrace cons
- Pricing can be complex and tough to predict
- Dynatrace can be resource-intensive to run, just like Datadog
- Requires advanced technical experience to figure out and optimize
Elasticsearch
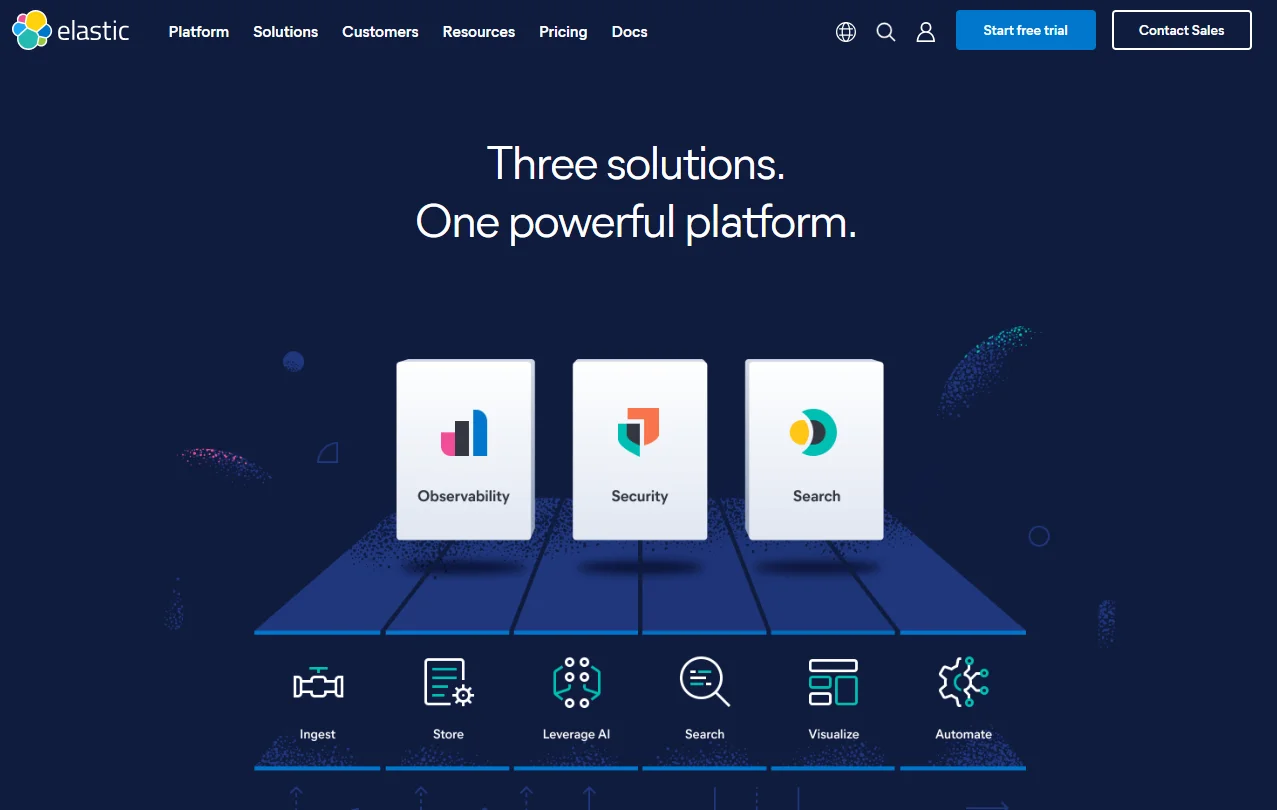
The Elasticsearch analytics and search engine are distributed, JSON-based, and RESTFUL. Also, Elasticsearch is one part of the Elastic Stack (ELK) that also comprises Logstash, and Kibana, should you choose to use the entire offering.
ElasticSearch features
- Elasticsearch Query Language simplifies data investigation
- Powerful search function (structured, unstructured, metric, geo, etc)
- SIEM, Endpoint security, and cloud security
- Is a central part of the ELK Stack, one of the most popular logs analytics platforms today
- Unified visibility using metrics, traces, logs, and more
- Service mapping
- Universal profiling
ElasticSearch pricing
Elastic pricing is based on the features you use. After the free trial expires, you can choose from one of four Elasticsearch plans that start at $95 per month.
ElasticSearch pros
- Helps collect and analyze massive amounts of data
- Open-source alternative to Datadog, minimizing vendor lock-in
- Offers real-time search and analytics capabilities
- Supports great data indexing and storage along with Logstash and Kibana
- Offers great scalability compared to some other alternatives to Datadog
- Uses powerful AI and machine learning to drive its robust search function
ElasticSearch Cons
- Requires more work to manage as you send more data to it
- NoSQL database so can’t use SQL to query it
- Not the best data (persistence) store compared to options such as MongoDB
- Not ACID-compliant by default
IBM Instana Observability
If you are looking for a powerful Datadog alternative for APM, Instana can be it. IBM’s Instana Observability offers comprehensive monitoring across mobile, web, apps, and (cloud and on-premises) infrastructure. There’s more.
IBM Instana Observability features
- Infrastructure monitoring
- Hybrid cloud monitoring (IBM Cloud, AWS, Azure, and Google Cloud)
- Real-time application performance monitoring
- Distributed tracing
- Log management
- Website monitoring with AIOps
IBM Instana Observability pricing
Instana pricing is based on a per-host pricing model. Pricing factors include the type of Instana edition you choose (SaaS or Self-hosted), the number of APM hosts, and the number of infrastructure quality management hosts you choose.
IBM Instana Observability pros
- Offers an enterprise-scale APM tool
- Powerful APM and log management
- Works well as a hybrid cloud observability solution, including on-premises deployments
- Automatic discovery enables continuous monitoring
- Supports automatic root cause analyses
- Offers a user-friendly interface
- Provides continuous high-fidelity data at per-second granularity
IBM Instana Observability cons
- Limited infrastructure and database monitoring compared to Datadog
- Can be more expensive than Datadog
- Real-user monitoring is missing
- No custom metric dashboards
LogicMonitor
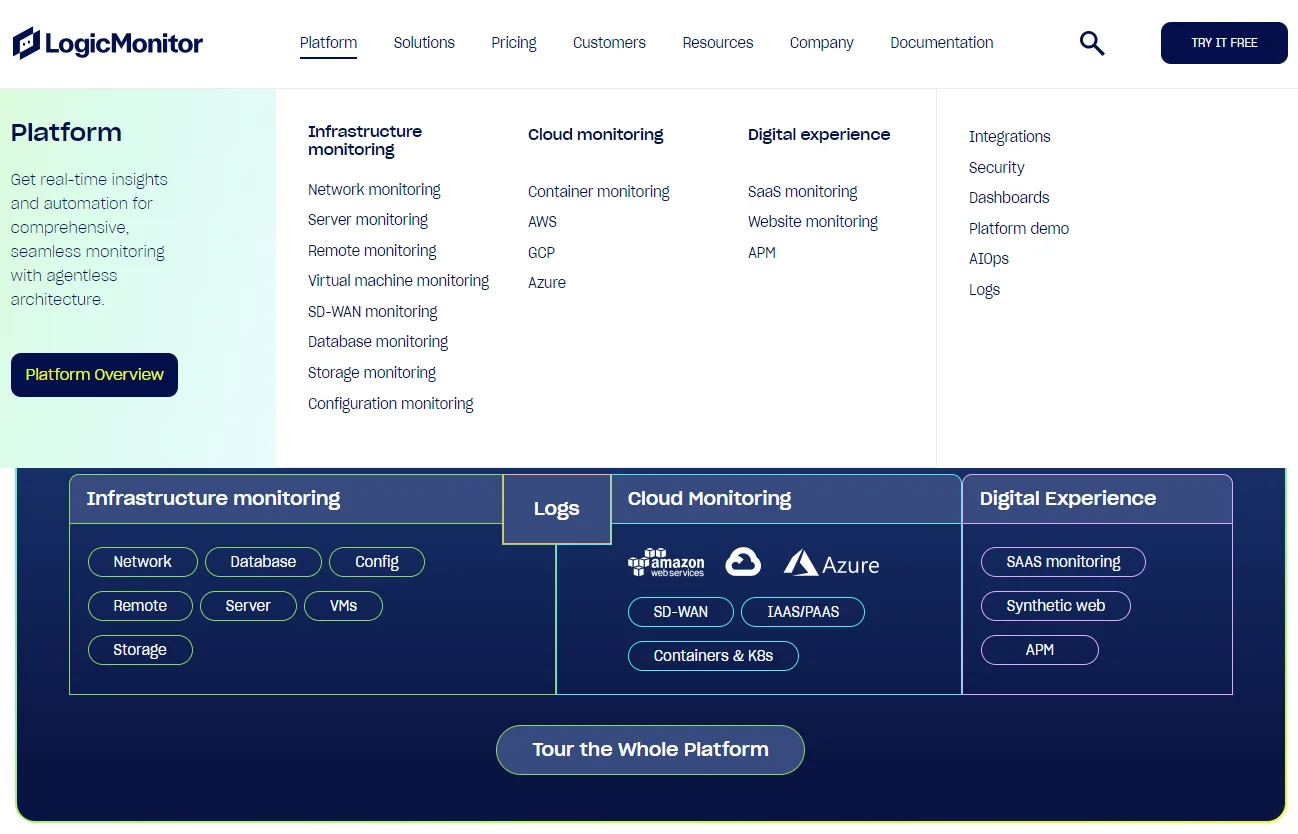
Unlike Datadog, LogicMonitor is an agentless monitoring platform. Yet, like Datadog, it offers comprehensive observability solutions to improve visibility into your applications, infrastructure, networks, website users, and containerized workloads.
LogicMonitor features
- Cloud-based observability platform
- Remote monitoring
- Virtual machine monitoring
- Configuration monitoring
- Storage monitoring
- SD-WAN monitoring
LogicMonitor pricing
You have to contact sales to get a price quote.
LogicMonitor pros
- Supports hybrid cloud observability (AWS, Azure, GCP, and container monitoring in one platform)
- Offers real-time insights into your environments
- Provides pre-configured dashboards you can customize
- Offers great root cause analysis
- Delivers accurate anomaly detection and alerts for fast resolution times
- Superior device monitoring (up to 199 devices)
- SaaS-based tool deploys quickly and hassle-free
- Responsive customer support
LogicMonitor cons
- Reports can be limited, such as the ability to add new columns
- Deleting items can be surprisingly a hassle
- Pricing could be more transparent
- Limited network configuration capabilities
ManageEngine
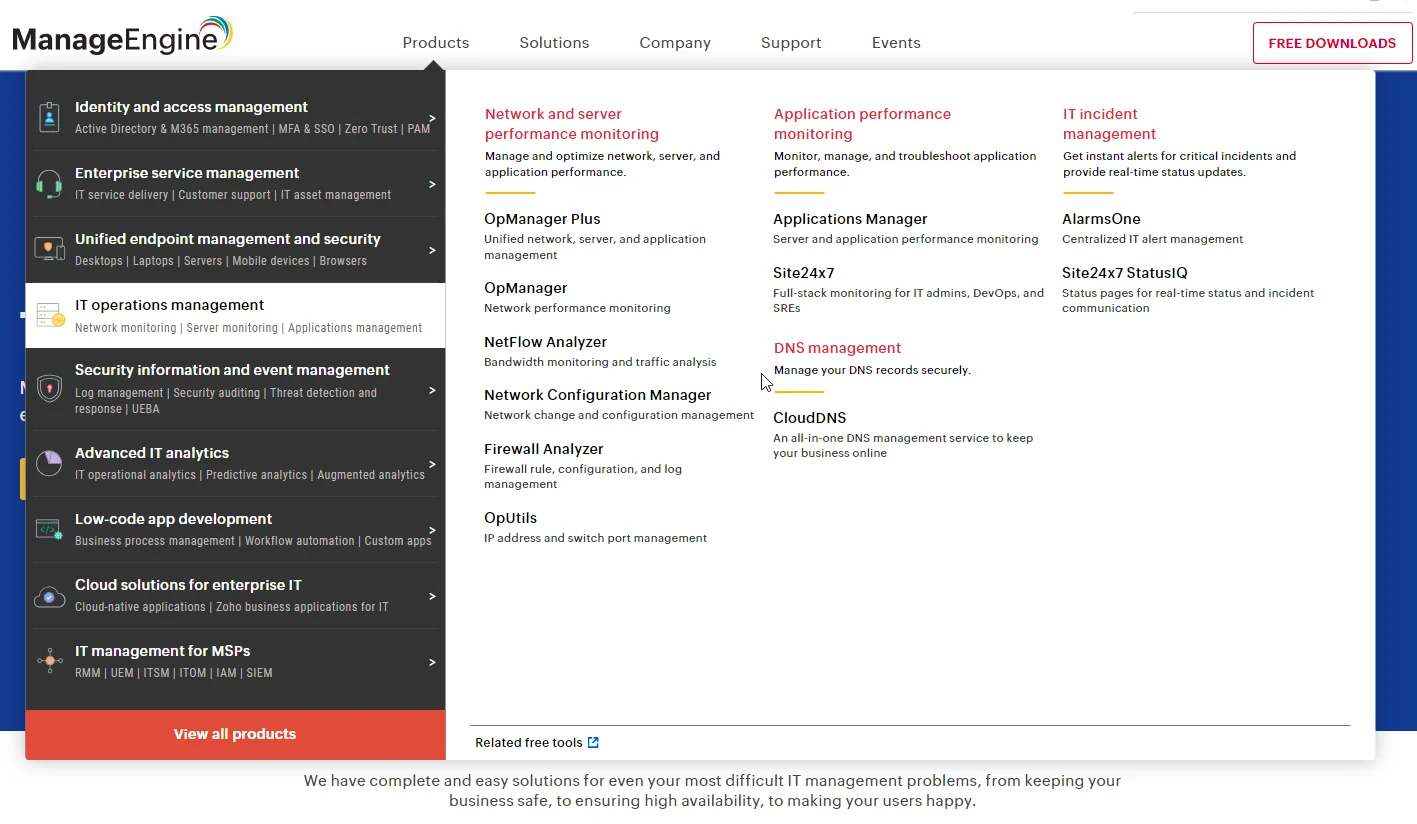
ManageEngine Applications Manager is a top Datadog alternative because it packs most or all of the observability tools you’ll need within a single platform. It goes further by emphasizing security, too, including enterprise-level IAM and service management.
ManageEngine features
- Network and server performance monitoring
- Application performance monitoring (APM)
- Real-time incident monitoring and management
- Application dependency mapping
- SIEM support
- Logs and compliance management
- Distributed tracing
- No collectors or agents architecture
ManageEngine pricing
ManageEngine pricing is based on the number of monitors and users you want using the web client. Then you can pick an Enterprise (from 250 monitors with 1 user) or Professional edition (starts at 10 monitors with 1 user for $395). You can also monitor up to five servers or apps for free with the Forever edition.
ManageEngine pros
- Offers robust security monitoring and management vs many alternatives to Datadog
- Scales smoothly for enterprise use cases (for Windows and Linux systems)
- Deployable on-premises and in the cloud (AWS and Azure)
- Supports automatic root cause analyses
- Offers automatic detection for databases, devices, apps, etc
- Delivers alerts via SMS, email, Slack, or service desk ticketing
ManageEngine cons
- The overabundance of features can be overwhelming
- Not as robust as Datadog for infrastructure and end-user monitoring
- The dashboard can feel a little cluttered
New Relic
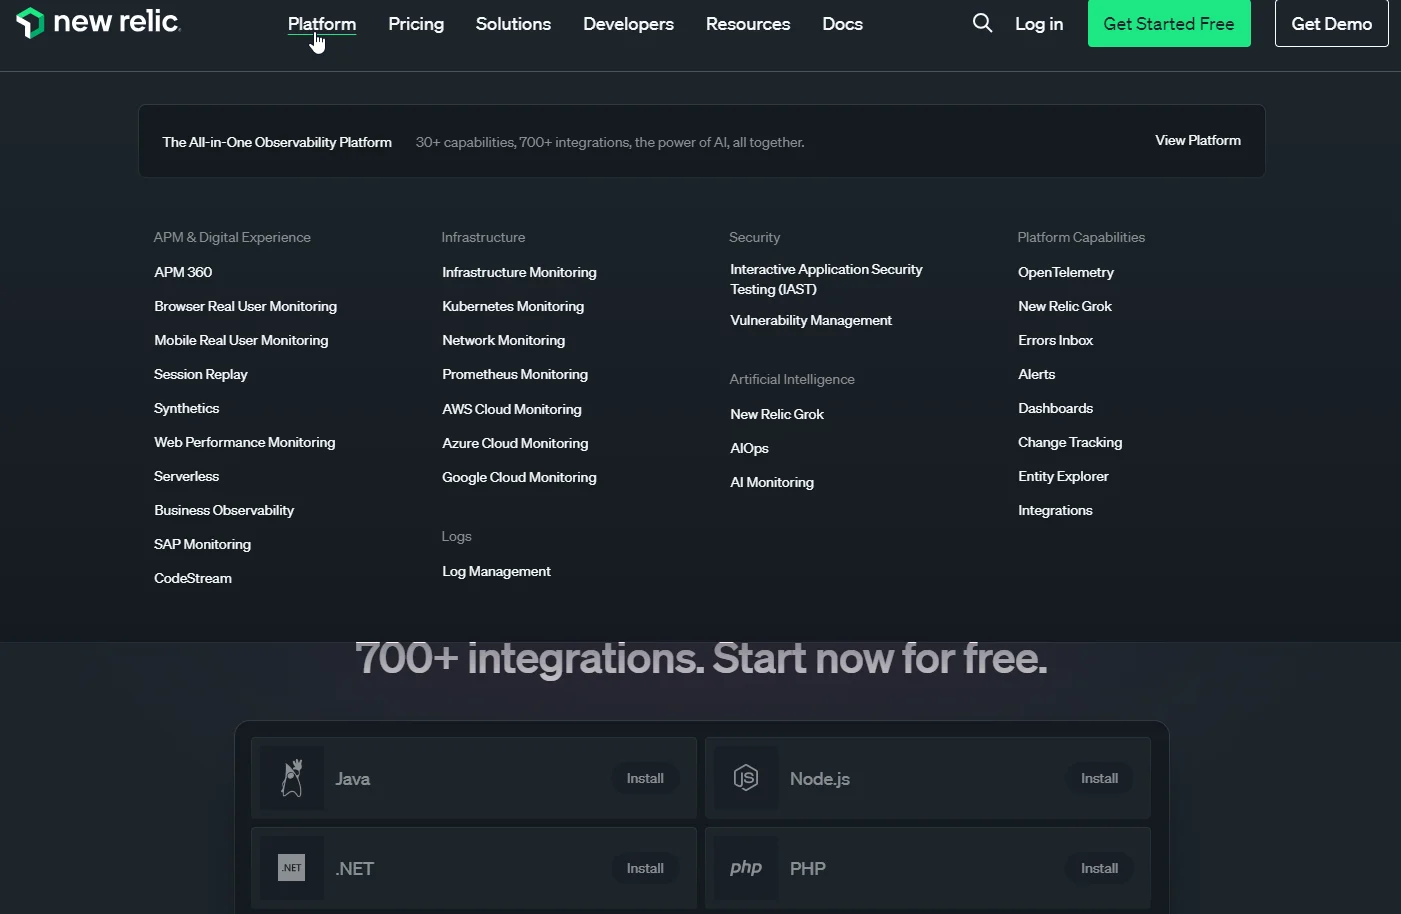
New Relic is an all-in-one observability platform that shares many similarities with Datadog. The cloud-based platform is ideal for monitoring enterprise-scale infrastructure, applications, and services. Here’s more about New Relic.
New Relic features
- Infrastructure monitoring
- Digital experience monitoring
- New Security monitoring function
- Distributed tracing
- Mobile and web monitoring
- Serverless monitoring
- Native-level integration with AWS, Azure, and GCP
New Relic pricing
The pricing for New Relic’s observability services is based on usage. Billing is also influenced by the number of users and data transferred. In addition, you can select the plan that suits your needs (basic vs core vs full platform).
New Relic pros
- Powerful full-stack monitoring platform
- Supports AIOps for faster analyses and reporting
- Accurate error tracking
- Supports multi-device logging and monitoring
- Leverages metrics, events, logs, and distributed traces
- Accurate anomaly detection and alerting
- Robust container (Kubernetes) monitoring
- Debugs your code in real-time without sampling
- Good built-in collaboration tools for developers and NOCs teams
New Relic cons
- Both platform management and pricing can be as complex as Datadog
- Limited security monitoring for now
- You’ll need to install agents in all devices you wish to monitor
- Can take some time to learn
Prometheus
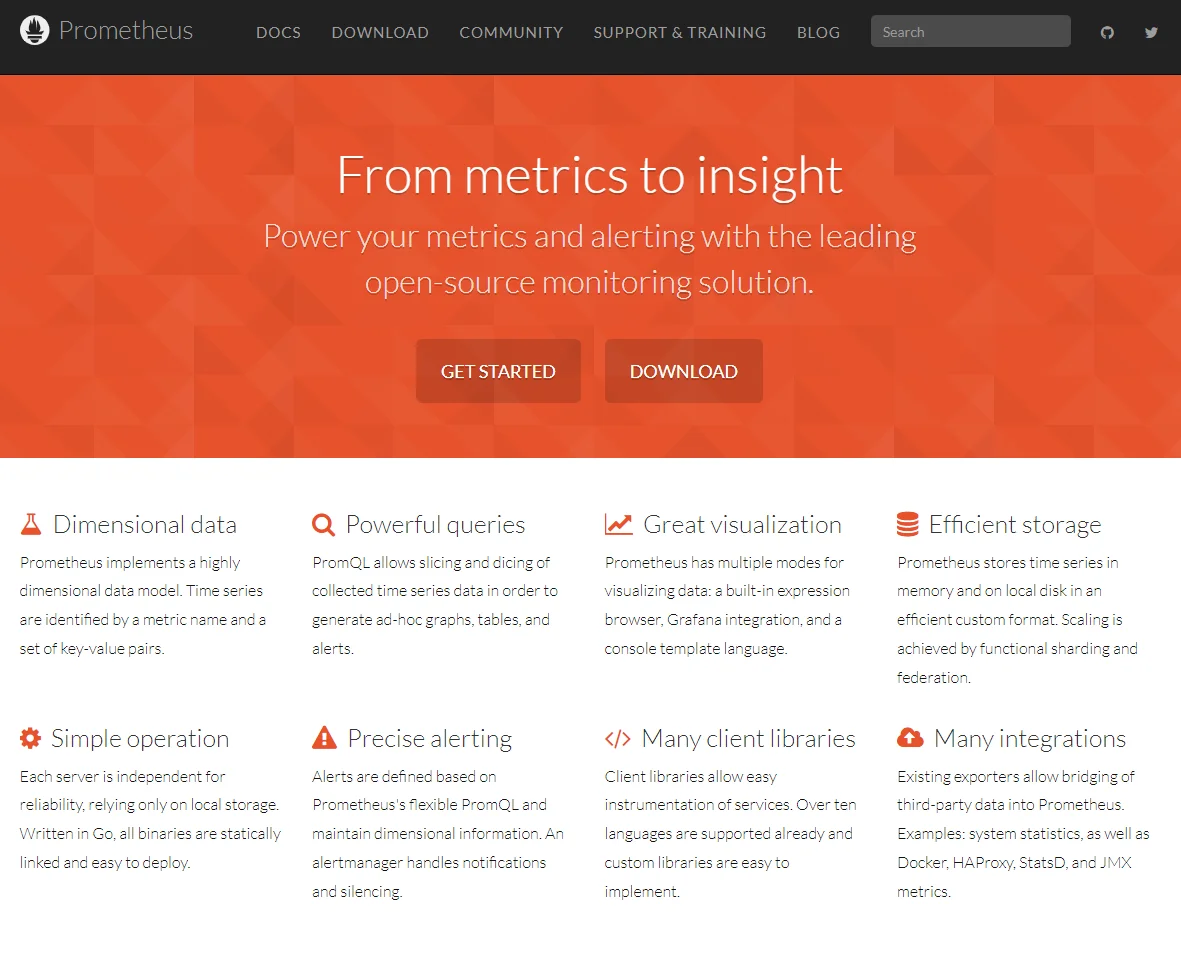
Prometheus provides an open-source monitoring system that you can use across any environment; public, private, and hybrid cloud. Right off the bat, Prometheus is a cloud-native monitoring platform compared to Datadog’s on-premises/cloud deployment model.
Prometheus features
- A free, open-source alternative to Datadog’s proprietary code
- Stores time series on local disk and in memory in an efficient custom format
- Multi-dimensional data model
- Flexible query language (PromQL)
- Aggregate time series data in real-time
- Support for both Docker and Kubernetes
Prometheus pricing
It is free (open-source, community-supported). Using a managed service for it, however, will have a cost determined by the provider. For example, pricing for Managed Service for Prometheus on GCP starts at $0.06 per million samples.
Prometheus pros
- Offers a powerful metrics and alerting system
- Minimizes vendor lock-in because it’s open-source
- Seamlessly integrates with open-source data visualization tools such as Grafana
- Integrates with lots of tools in your stack
- Offers a powerful free tier
- Supports robust Kubernetes monitoring
Prometheus cons
- Alerting may not always be accurate
- Requires manual setup, deployment, and management as it is open-source
- Not detailed enough for some use cases, such as per request billing data
Sematext
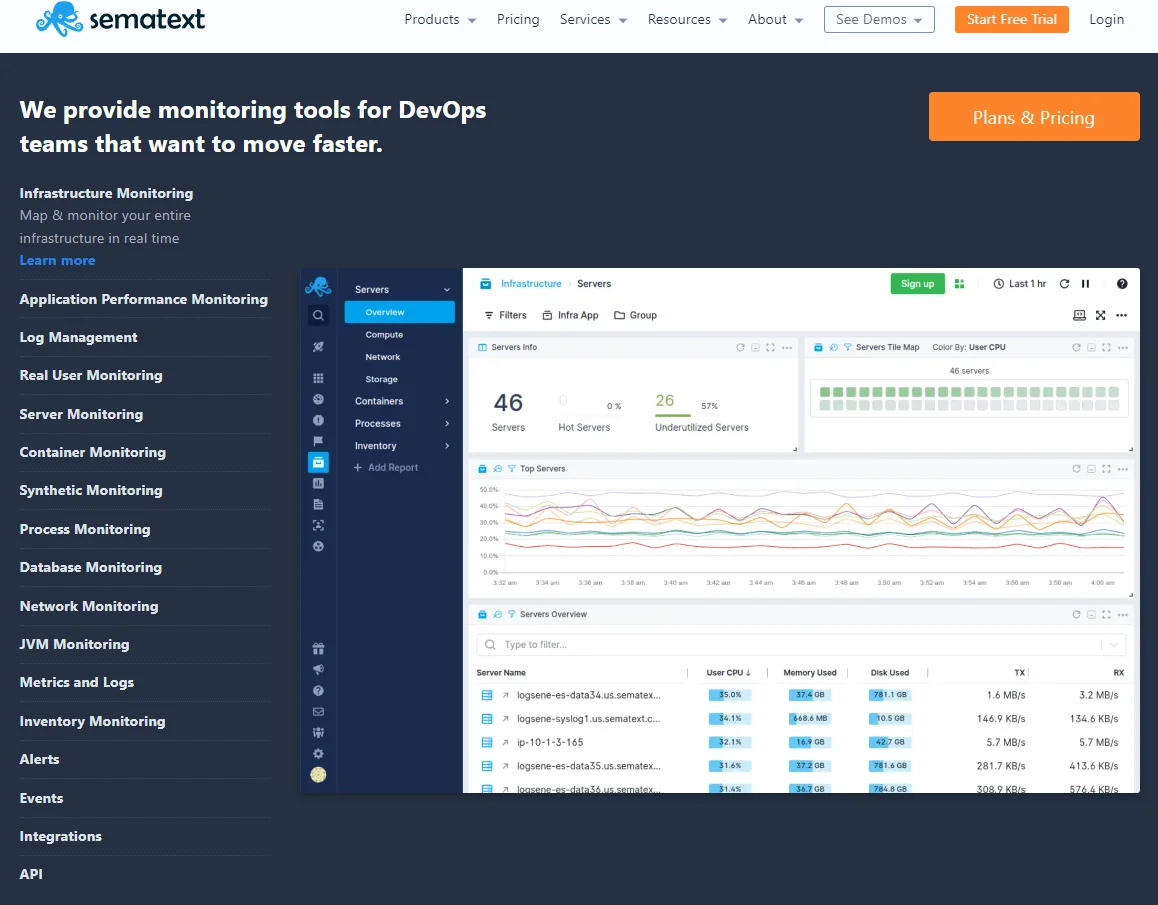
Sematext comes through as an affordable Datadog alternative. Yet, it offers one of the most comprehensive observability portfolios today. Here’s what we mean.
Sematext features
- Real-time infrastructure monitoring
- Fully managed Elasticsearch and Kibana
- Real user monitoring
- Log management
- Synthetics monitoring
- Website monitoring (with Core Web Vitals tracking)
- Application performance monitoring
- Server and virtual machine monitoring
Sematext pricing
Pricing for Sematext monitoring starts at $3.6 per host, which is much lower than Datadog prices. It also offers a variety of pricing packages to meet various use cases, such as log management, which starts at $50 per month, and synthetics monitoring, which starts at $2 per HTTP monitor and $7 per browser monitor.
Sematext pros
- Truly full-stack observability in a single platform
- Installs in a 10-minute setup process
- Delivers a flexible and highly extensible monitoring solution
- Provides a unified view of Docker and Kubernetes logs, metrics, and events
- Robust log management
- Works both on-premises and in the cloud similar to Datadog
- Offers detailed browser monitoring and alerts
- Includes a 30-day free trial, which is longer than most alternatives to Datadog
Sematext cons
- Limited support for distributed tracing
- Limited support for security monitoring
- Limited filtering capabilities for logs
SigNoz
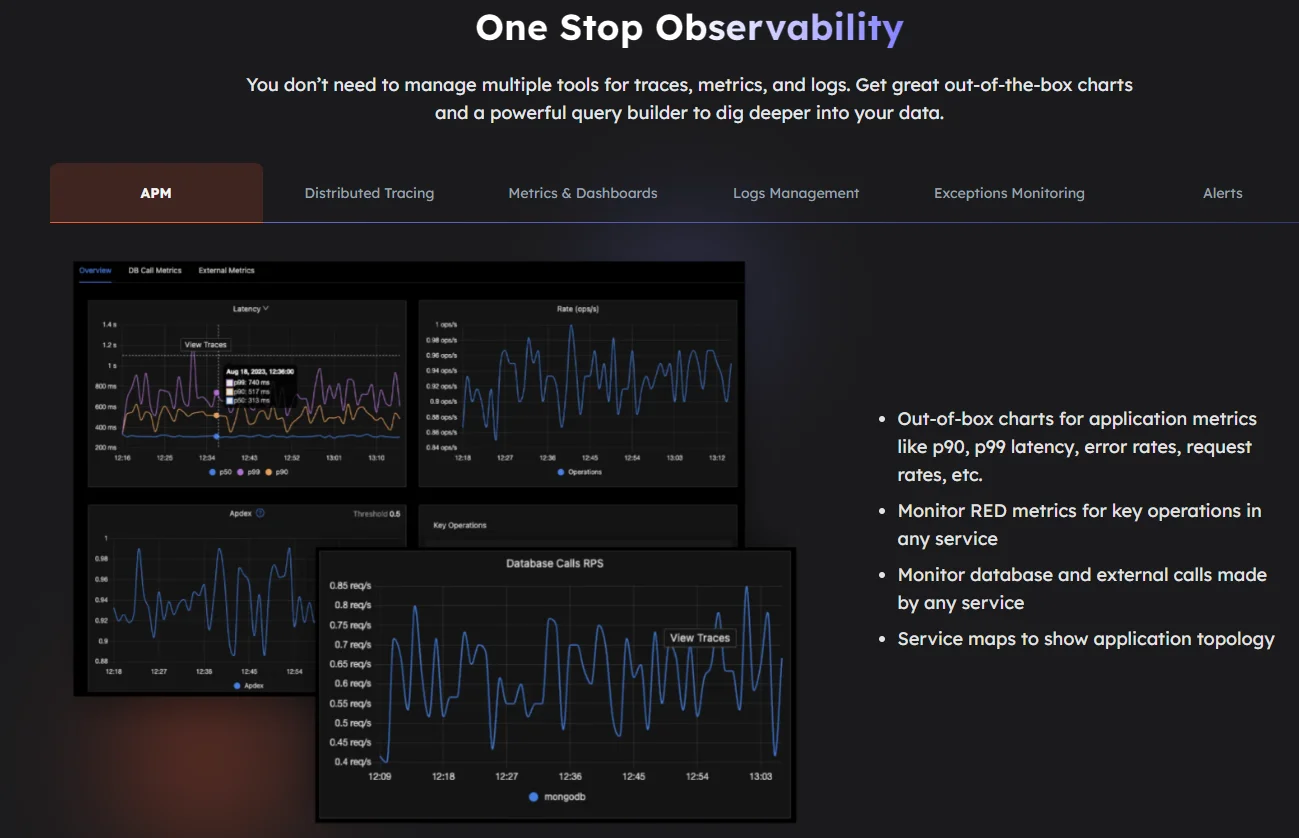
Signoz provides an open-source observability system with an emphasis on APM. Yet, it is a full-featured observability platform that helps observe, diagnose, and optimize infrastructure, apps, and microservices architectures.
SigNoz features
- Open-source monitoring service built on OpenTelemetry
- End-to-end application performance monitoring
- Native traces and logs
- Logs management
- Automatically record exceptions in Python, Ruby, Java, and JavaScript
- DIY query builder
- Application topology thanks to service maps
- Uses Clickhouse database, a fast, distributed, and open-source columnar database
SigNoz pricing
Pricing for SigNoz depends on whether you deploy the service in the cloud or host it in your infrastructure. Self-hosting offers the free, Community Edition and the Enterprise Edition (need to contact sales). Pricing for SigNoz Cloud Teams starts at $199 per month and the Enterprise Edition is quote-based.
SigNoz pros
- Improves visibility into how requests flow across various services and infrastructure components
- Offers interoperability and flexibility thanks to its open architecture
- Captures and reports on metrics, traces, and logs within a single pane of glass
- Minimizes vendor lock-in with its open-source base
- But also available as a cloud offering with email, Slack, and community support
- Delivers comprehensive views in the dashboard
- Supports multiple notifications channels, including PagerDuty and Slack
SigNoz cons
- Designed for APM monitoring, so not a comprehensive observability platform like Datadog yet
- Documentation could be missing in some places at times
SolarWinds
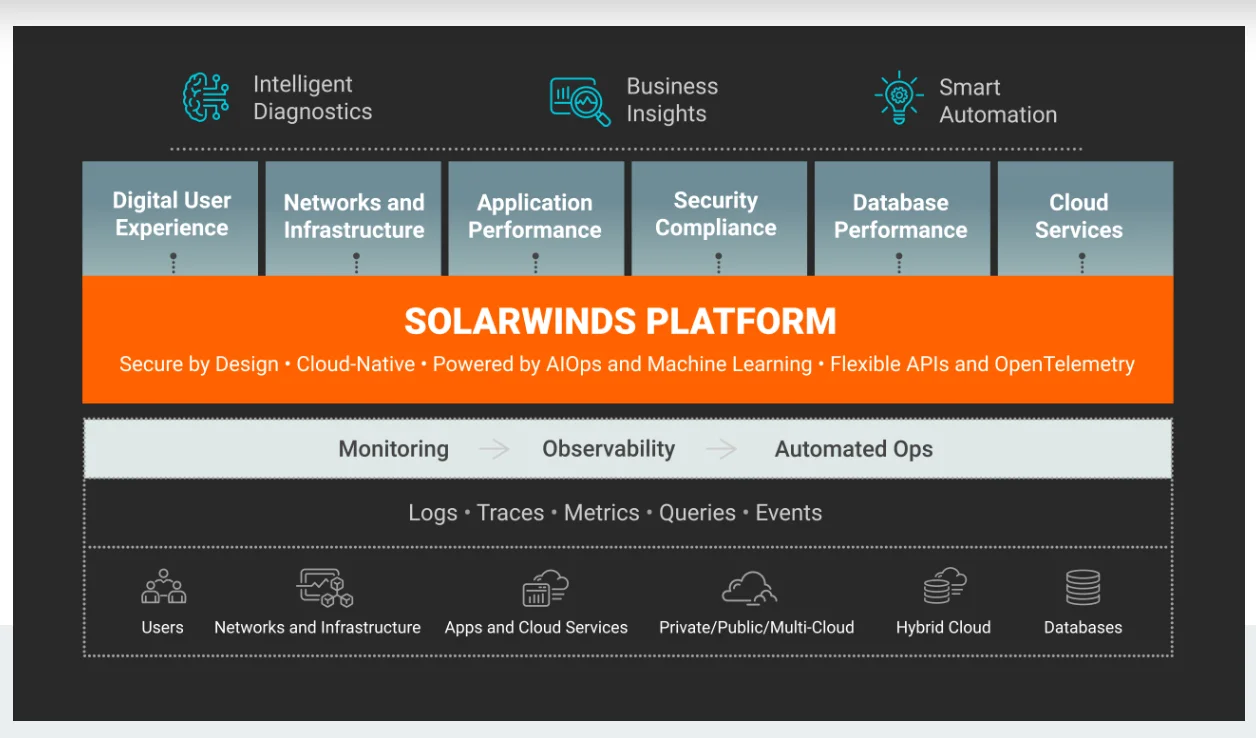
SolarWinds markets itself as the go-to alternative to Datadog for hybrid cloud monitoring needs. Additionally, it offers a diverse range of observability tools to back that up.
SolarWinds features
- Real-time application performance monitoring
- Infrastructure monitoring
- Network monitoring
- Database monitoring
- Digital experience monitoring
- Security and compliance monitoring
- Cloud-native service monitoring
SolarWinds pricing
SolarWinds Observability pricing is based on the specific monitoring service you use, such as APM ($27.50 per app instance), Network and Infrastructure monitoring ($15 per active network device or host month), log observability ($5 per GB per month), and database observability ($70 per database instance).
SolarWinds pros
- Delivers a full-stack observability platform
- Emphasizes security compliance monitoring
- Supports metrics, logs, events, queries, and traces
- Deploys anywhere; private, public, hybrid cloud, and multi-cloud environments
- Offers a user-friendly interface
- Has a monitoring template library
- Includes over 1,200 pre-built templates for apps, infrastructure, systems, etc
SolarWinds cons
- There are no cross-channel integrations
- Recent breach attacks may still concern some potential customers
Splunk
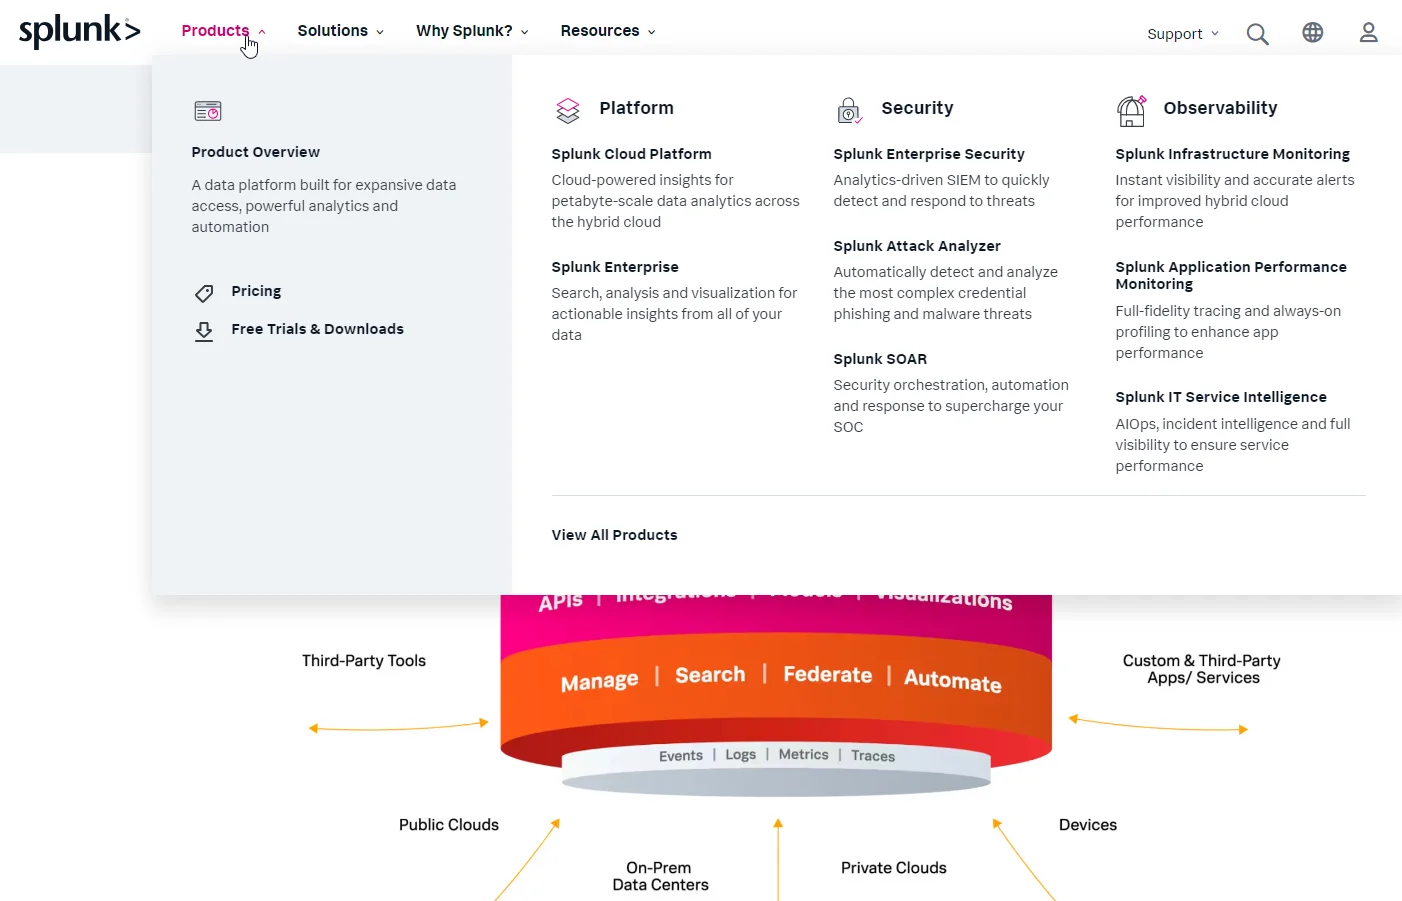
Splunk, now a part of the Cisco family of IT management products, is a solid Datadog alternative thanks to its infrastructure, security, and enterprise IT service monitoring tools. But it offers more.
Splunk features
- Log management
- Synthetic monitoring
- Real user monitoring
- Infrastructure monitoring
- Analytics-driven enterprise SIEM
- AIOps-driven incident intelligence
Splunk pricing
Observability pricing for Splunk starts at $15 per host per month for infrastructure and is billed annually. Application and infrastructure monitoring cost $60 per host per month billed annually, while the end-to-end option is $75 per host per month, billed annually.
Splunk pros
- Offers a respectable log management service
- Provides robust IT security monitoring at scale
- Avails an on-premises option
- Supports SAP and OpenTelemetry deployments on top of the AWS, Azure, GCP, and Kubernetes options available
- Suitable for hybrid cloud monitoring
- Backed by a family of powerful Cisco products such as AppDynamics now
Splunk cons
- AIOps capabilities are still developing
- May have a steep learning curve, especially for smaller companies
- Can also be costly for mid-sized companies
Sumo Logic
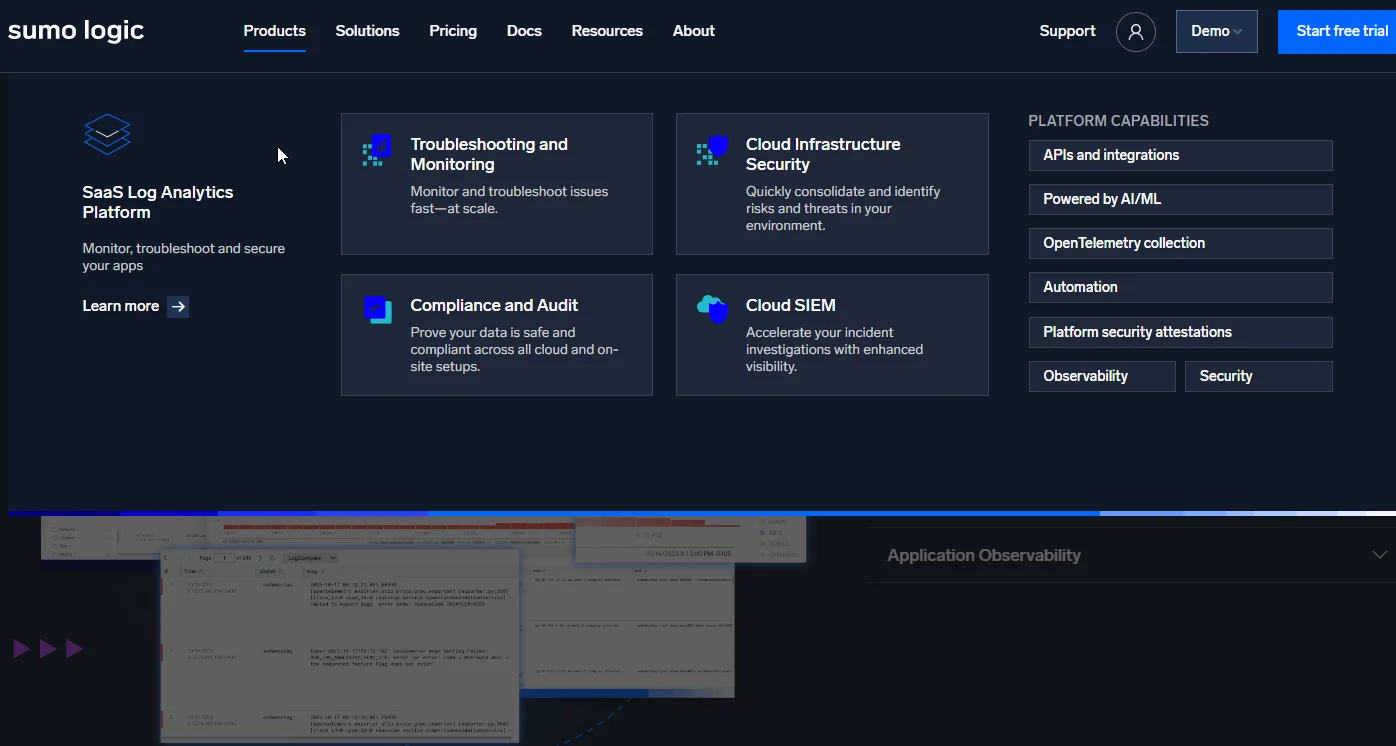
Sumo Logic makes this list of top Datadog alternatives particularly for its log management, AI, and Machine Learning enabled observability tools – from security to infrastructure to application monitoring.
Sumo Logic features
- IT assest observability and management
- Infrastructure monitoring
- Cloud SIEM and SOAR
- AI-ML-powered Log analytics and management
- Application performance monitoring
Sumo Logic pricing
Like other Datadog alternatives, Sumo Logic pricing is based on the observability service you use. As an example, pricing for Logs monitoring and troubleshooting starts at $3 per GB per month. However, you’ll still need to talk to sales to get the specifics.
Sumo Logic pros
- Delivers a full-stack observability platform like Datadog, New Relic, Sematext, etc
- Provides clean, customizable dashboards
- Offers a longer 30-day free trial vs the 14-day trial by Datadog
- Supports event management and alerting
- Enables capacity planning and forecasting
- Works as a cloud-native SaaS offering that scales
Sumo Logic cons
- Best suited for cloud-based monitoring, not on-premises environments
- Synthetic monitoring is via partnership
Wrapping Up
These are some of the best alternatives to Datadog today. Before choosing a monitoring platform, we recommend you discuss your complete observability requirements with your team, compare these options, and visit each platform for further information.
You may feel Datadog delivers but are concerned about costs. By identifying who, what, and why your Datadog costs are changing, you can stop the overspending at the source. If that is the case, CloudZero can help.
The CloudZero platform provides a single source of truth for cloud costs, including Datadog, New Relic, Databricks, Kubernetes, and Snowflake costs. Additionally, you can view these platform costs alongside your AWS, Azure, GCP, and Oracle Cloud costs.
In addition, you can identify the specific people, products, and processes that generated your costs – and actually fix them. The cost insights include cost per customer, cost per team, cost per service, cost per deployment, cost per project, and custom metrics.
CloudZero customers, such as MalwareBytes, Remitly, and NinjaCat, use these and more cost dimensions to save 6-10 hours weekly on managing cloud costs. Drift has saved over $4 million with CloudZero. You can, too.
to experience CloudZero yourself.


FinOps In The AI Era: A Critical Recalibration
What 475 executives told us about AI and cloud efficiency.


