Many often wonder, “Is there a difference between observability and monitoring?”
The thing is as IT environments have become more complex, monitoring alone has become increasingly less effective. That’s because while monitoring is crucial, it isn’t particularly suited to tracking unforeseen or unexpected turns of events. That’s what observability is meant for.
This guide will clarify what observability and monitoring are – and how they differ. Additionally, we’ll share some of the best monitoring and observability tools in the market to help you get started.
What Is Observability In Cloud Computing?
Observability refers to the ability to measure a system’s current state based on the data it generates. The three pillars of observability — logs, metrics, and traces — each play a distinct role in this process.
- Logs record discrete events
- Metrics provide quantitative information about processes
- Distributed tracing tracks the journey of requests through distributed systems, helping you pinpoint latency and failure points across services.
Observability focuses on collecting deep intelligence about various aspects of a system to understand its behavior and the components influencing that behavior. Context. Interdependencies. More.
By combining these views, you can diagnose problems, understand system performance, and make informed decisions about optimization and maintenance.
Why is observability important?
Observability is crucial today because it helps track and maintain the optimal health and performance of distributed systems in complex computing environments, such as Kubernetes clusters and multi-cloud setups.
Another thing. Observability is proactive rather than reactive when tracking system health and performance indicators. How?
That’s because while monitoring collects data (pre-defined metrics) to determine what has happened and pinpoint root causes, observability helps you make connections that predict possible issues before they arise, allowing your team to prevent costly disruptions.
playbook
The AI Cost Optimization Playbook
Traditional cloud cost management is broken. Here’s why — and how to make the switch to cloud cost intelligence.
What Is Monitoring In Cloud Computing?
Monitoring focuses on collecting predefined metrics to understand a system’s current state. This typically involves using dashboards to visualize and identify performance issues and abnormalities that are expected or predetermined. Tools like application performance monitoring (APM) solutions fall into this category, tracking response times, error rates, and throughput across your services.
Monitoring tools generally gather data to identify deviations from expected performance. They also analyze long-term trends.
The problem with monitoring on its own is that it relies on predefined metrics and is prone to missing unexpected production failures or issues not anticipated by set parameters, especially in today’s complex IT environment.
Why is monitoring crucial?
Monitoring is particularly crucial for tracking when a system is deviating from expected performance. That’s one way to determine if something isn’t working as it should.
This is particularly useful for measuring performance, security, and cost anomalies. This can also help to reduce downtime, system outages, surprise costs, and data loss. For example, an increase in cloud costs is often an indicator something is amiss and could cause overspending.
This way, you can use the monitoring data to jump in, identify what’s not working as expected, and identify opportunities to optimize system performance hence costs.
Observability Use Cases: Real-World Examples
Observability describes the extent to which a system’s internal states can be defined based on its external outputs. The process itself entails reviewing the health of your system without interfering or interacting with it — you, instead, draw conclusions after analyzing its output data.
An observable system, therefore, enables you to draw quick inferences from patterns and properties that are not necessarily pre-defined.
Examples of instances where observability comes in handy include:
- Determining the performance levels of your system over time based on the count of successful function invocations per day, per week, and maybe per month.
- Identifying and troubleshooting cloud server loads based on the traffic flow patterns through your cloud network.
- Analyzing how changes in one component affect other components.
- Pointing out outliers from the function invocations that fail to execute in time.
- Comparing your bills periodically to see how much each extra resource has cost you.
- Reviewing the programming patterns to determine how and when your code runs.
- Pinpointing system cold starts based on shifts in performance.
- Determining the performance capabilities of applications after comparing how they respond to various system properties.
- Flagging potential bottlenecks or system errors, and then using the insights to establish the best course of action to prevent future recurrences.
- Taking note of lags in the delivery of microservices after uncovering traces that are affected by latency during component transitions and individual function calls.
- Establishing the frequency of system errors across all container or function invocations.
Going by these examples, observability needs taking note of the output changes and sequences to draw informed conclusions.
6 Top Tools For Observability And Monitoring
As the concept of observability and monitoring developed and gained traction, so did the service providers and their cloud observability tools. Consequently, the cloud now offers a wide range of advanced tools for observability and monitoring.
Some of them come as built-in tools that run natively within the cloud platforms, while others are developed by third-party providers to be integrated with various cloud services.
Whichever category you decide to sample, you’ll find that the options across both fronts are offered in three variants — you can choose between dedicated observability tools, dedicated monitoring tools, and versatile all-inclusive solutions that serve as both monitoring and observability tools.
Here are some of the top tools in the observability and monitoring space (see our full roundup of cloud monitoring tools for a deeper list):
1. Lightstep
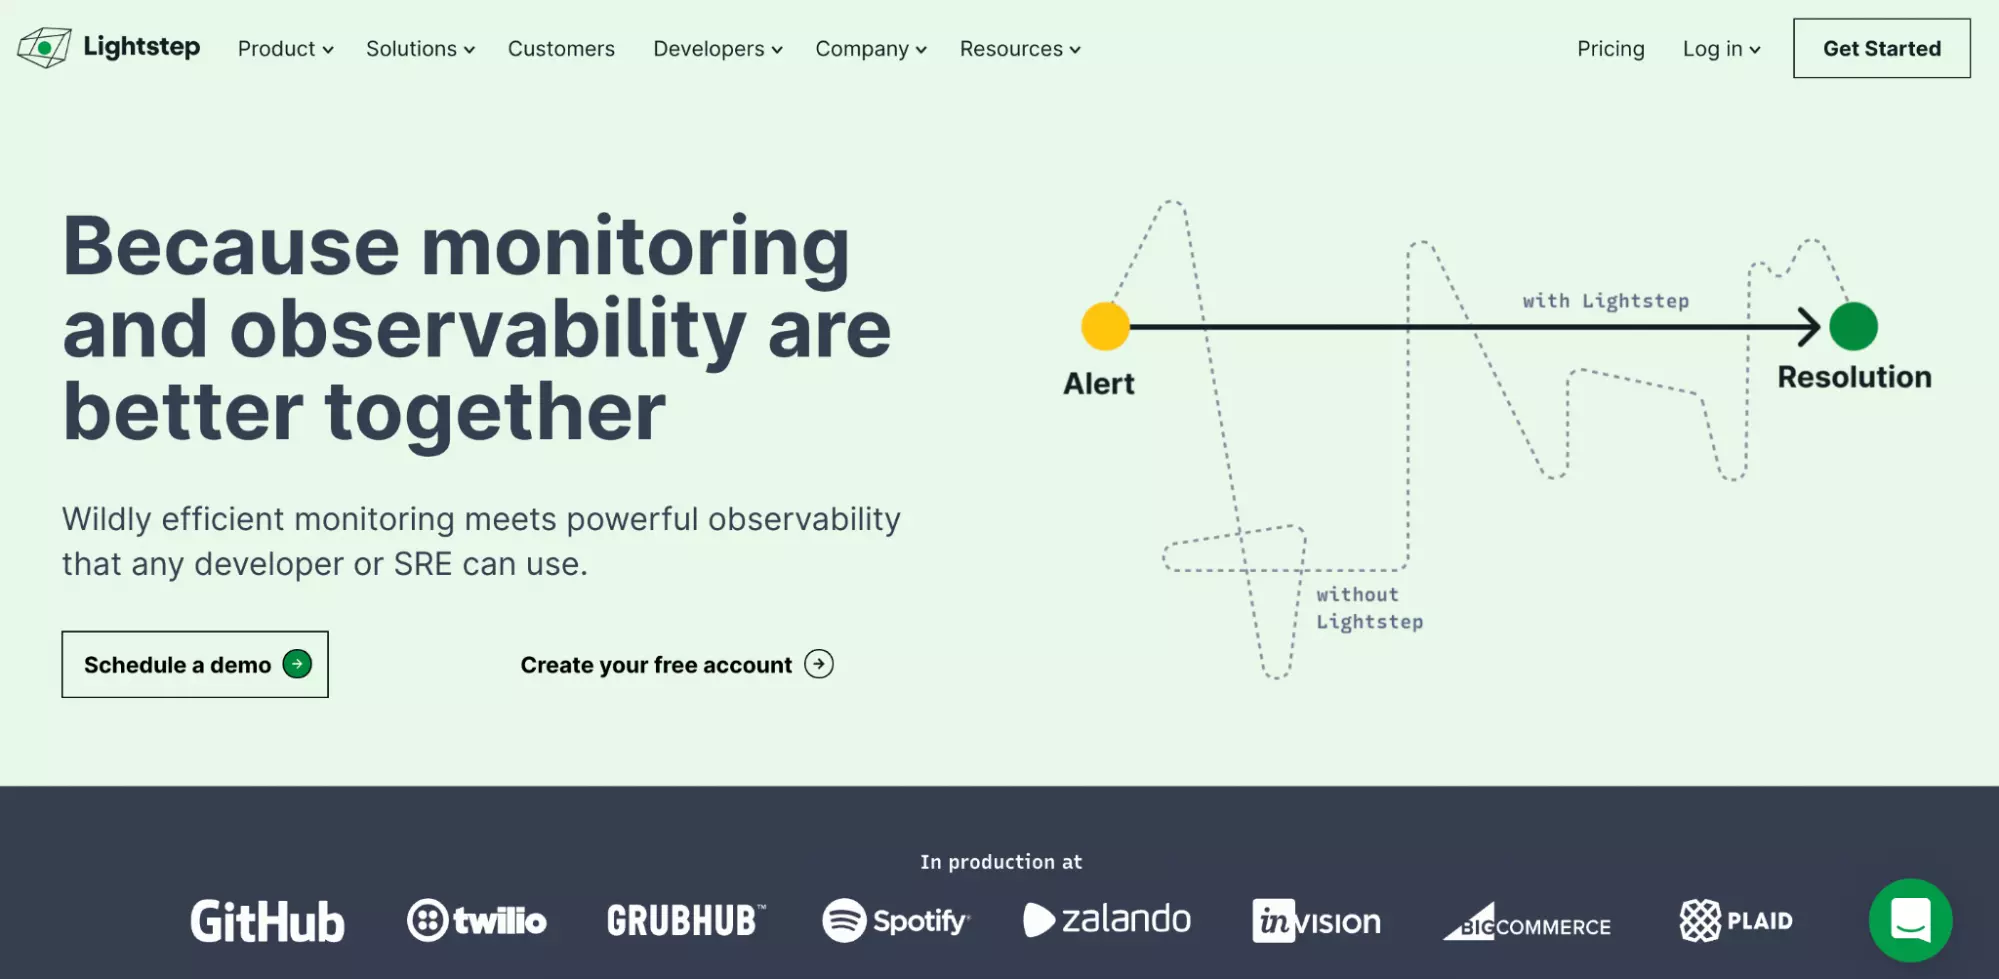
Distributed in both freemium and paid versions, Lightstep is an observability platform built specifically for DevOps. You can use it to gain visibility into complex deployments that involve the cloud, runtime, applications, multi-layered infrastructure, and third-party services.
Once you deploy it across your system, Lightstep’s extensive toolset proceeds to automatically detect infrastructural changes, review redundancies, establish sources of performance problems, and facilitate quick resolution of the issues.
2. Elk
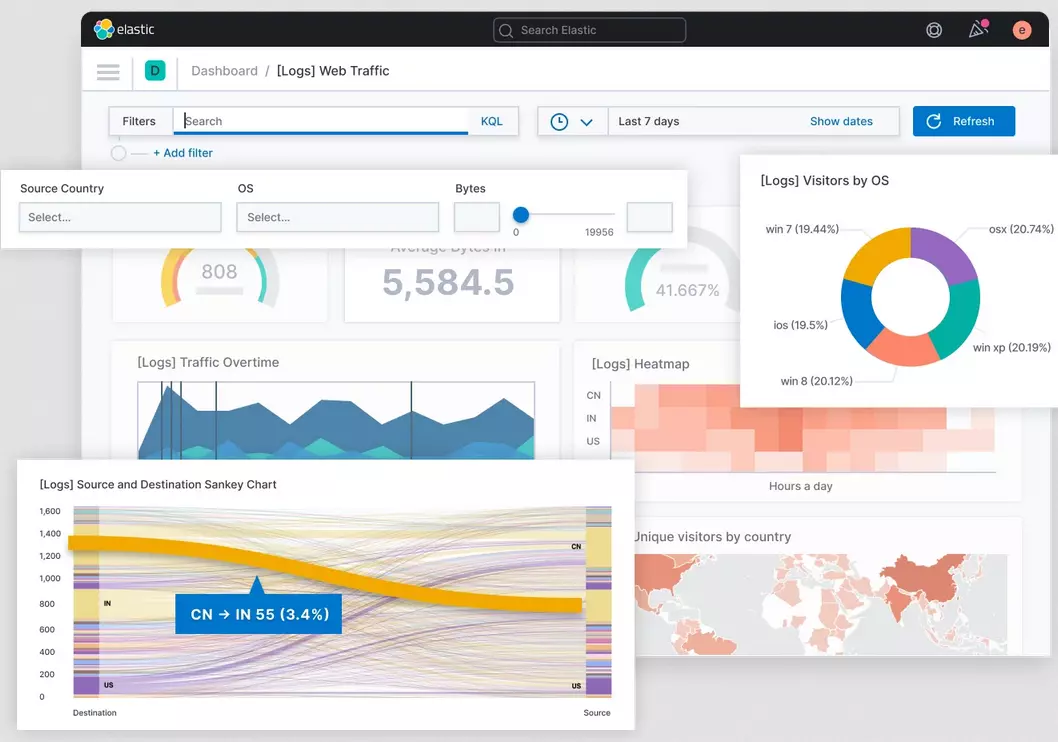
If you like the flexibility that open-source offers, you might want to try out this three-in-one software suite. ELK is a highly scalable stack that comprises three open-source tools — Elasticsearch, Logstash, and Kibana.
You can count on it to dive deep into your applications to retrieve logs — after which it proceeds to scrutinize and assess the logs, before finally relaying the insights through visualizations to facilitate troubleshooting.
3. Amazon CloudWatch
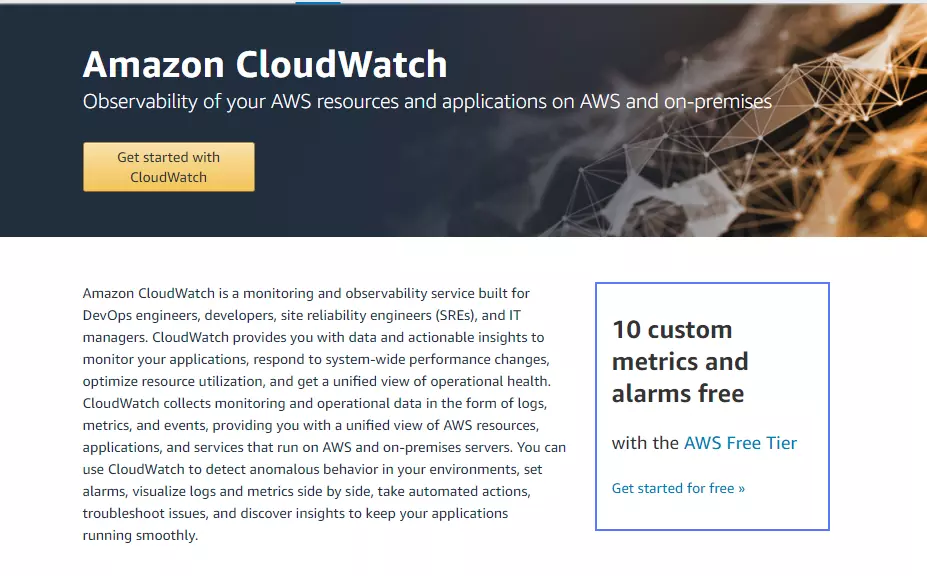
Going by AWS’s track record in the cloud computing industry, you can already tell that Amazon CloudWatch is not your average solution. The tool itself is robust enough to offer both observability and monitoring functionalities on a single platform.
The unified dashboard here provides all-round visibility, with actionable data insights for applications, infrastructure, AWS hybrid, plus on-premise systems. You can monitor your entire architecture stack, or perhaps generate metrics and insights into not only your containers but also the accompanying containerized microservices.
4. Google Cloud’s operations suite
A decent alternative to Amazon CloudWatch would be Google Cloud’s operations suite, which formerly went by the name Google Stackdriver. As you’ve probably figured already, the suite runs entirely on the Google Cloud environment, where you get to leverage its tools for observing, monitoring, troubleshooting, and improving application performance.
You’ll be able to extract log data and analyze it all for the sake of application troubleshooting. As for the cloud-powered applications, Google Cloud’s operations suite collects metrics and prepares intuitive visualizations on performance indicators, uptime, plus the applications’ overall health.
5. SolarWinds AppOptics
Although SolarWinds AppOptics prefers to sell itself as an Application Performance Monitoring Solution, it comes with all the standard bells and whistles you’d expect in an observability and monitoring solution. You’ll notice, for instance, that it combines full-stack application monitoring with infrastructure monitoring.
The application side focuses on tracking exceptions, profiling live codes, and helping you identify, as well as troubleshoot bottlenecks. Then the corresponding infrastructure monitoring engine stretches to cover all possible architectures. You can use it to generate and analyze metrics for cloud, on-premise, and hybrid infrastructures.
6. CloudZero
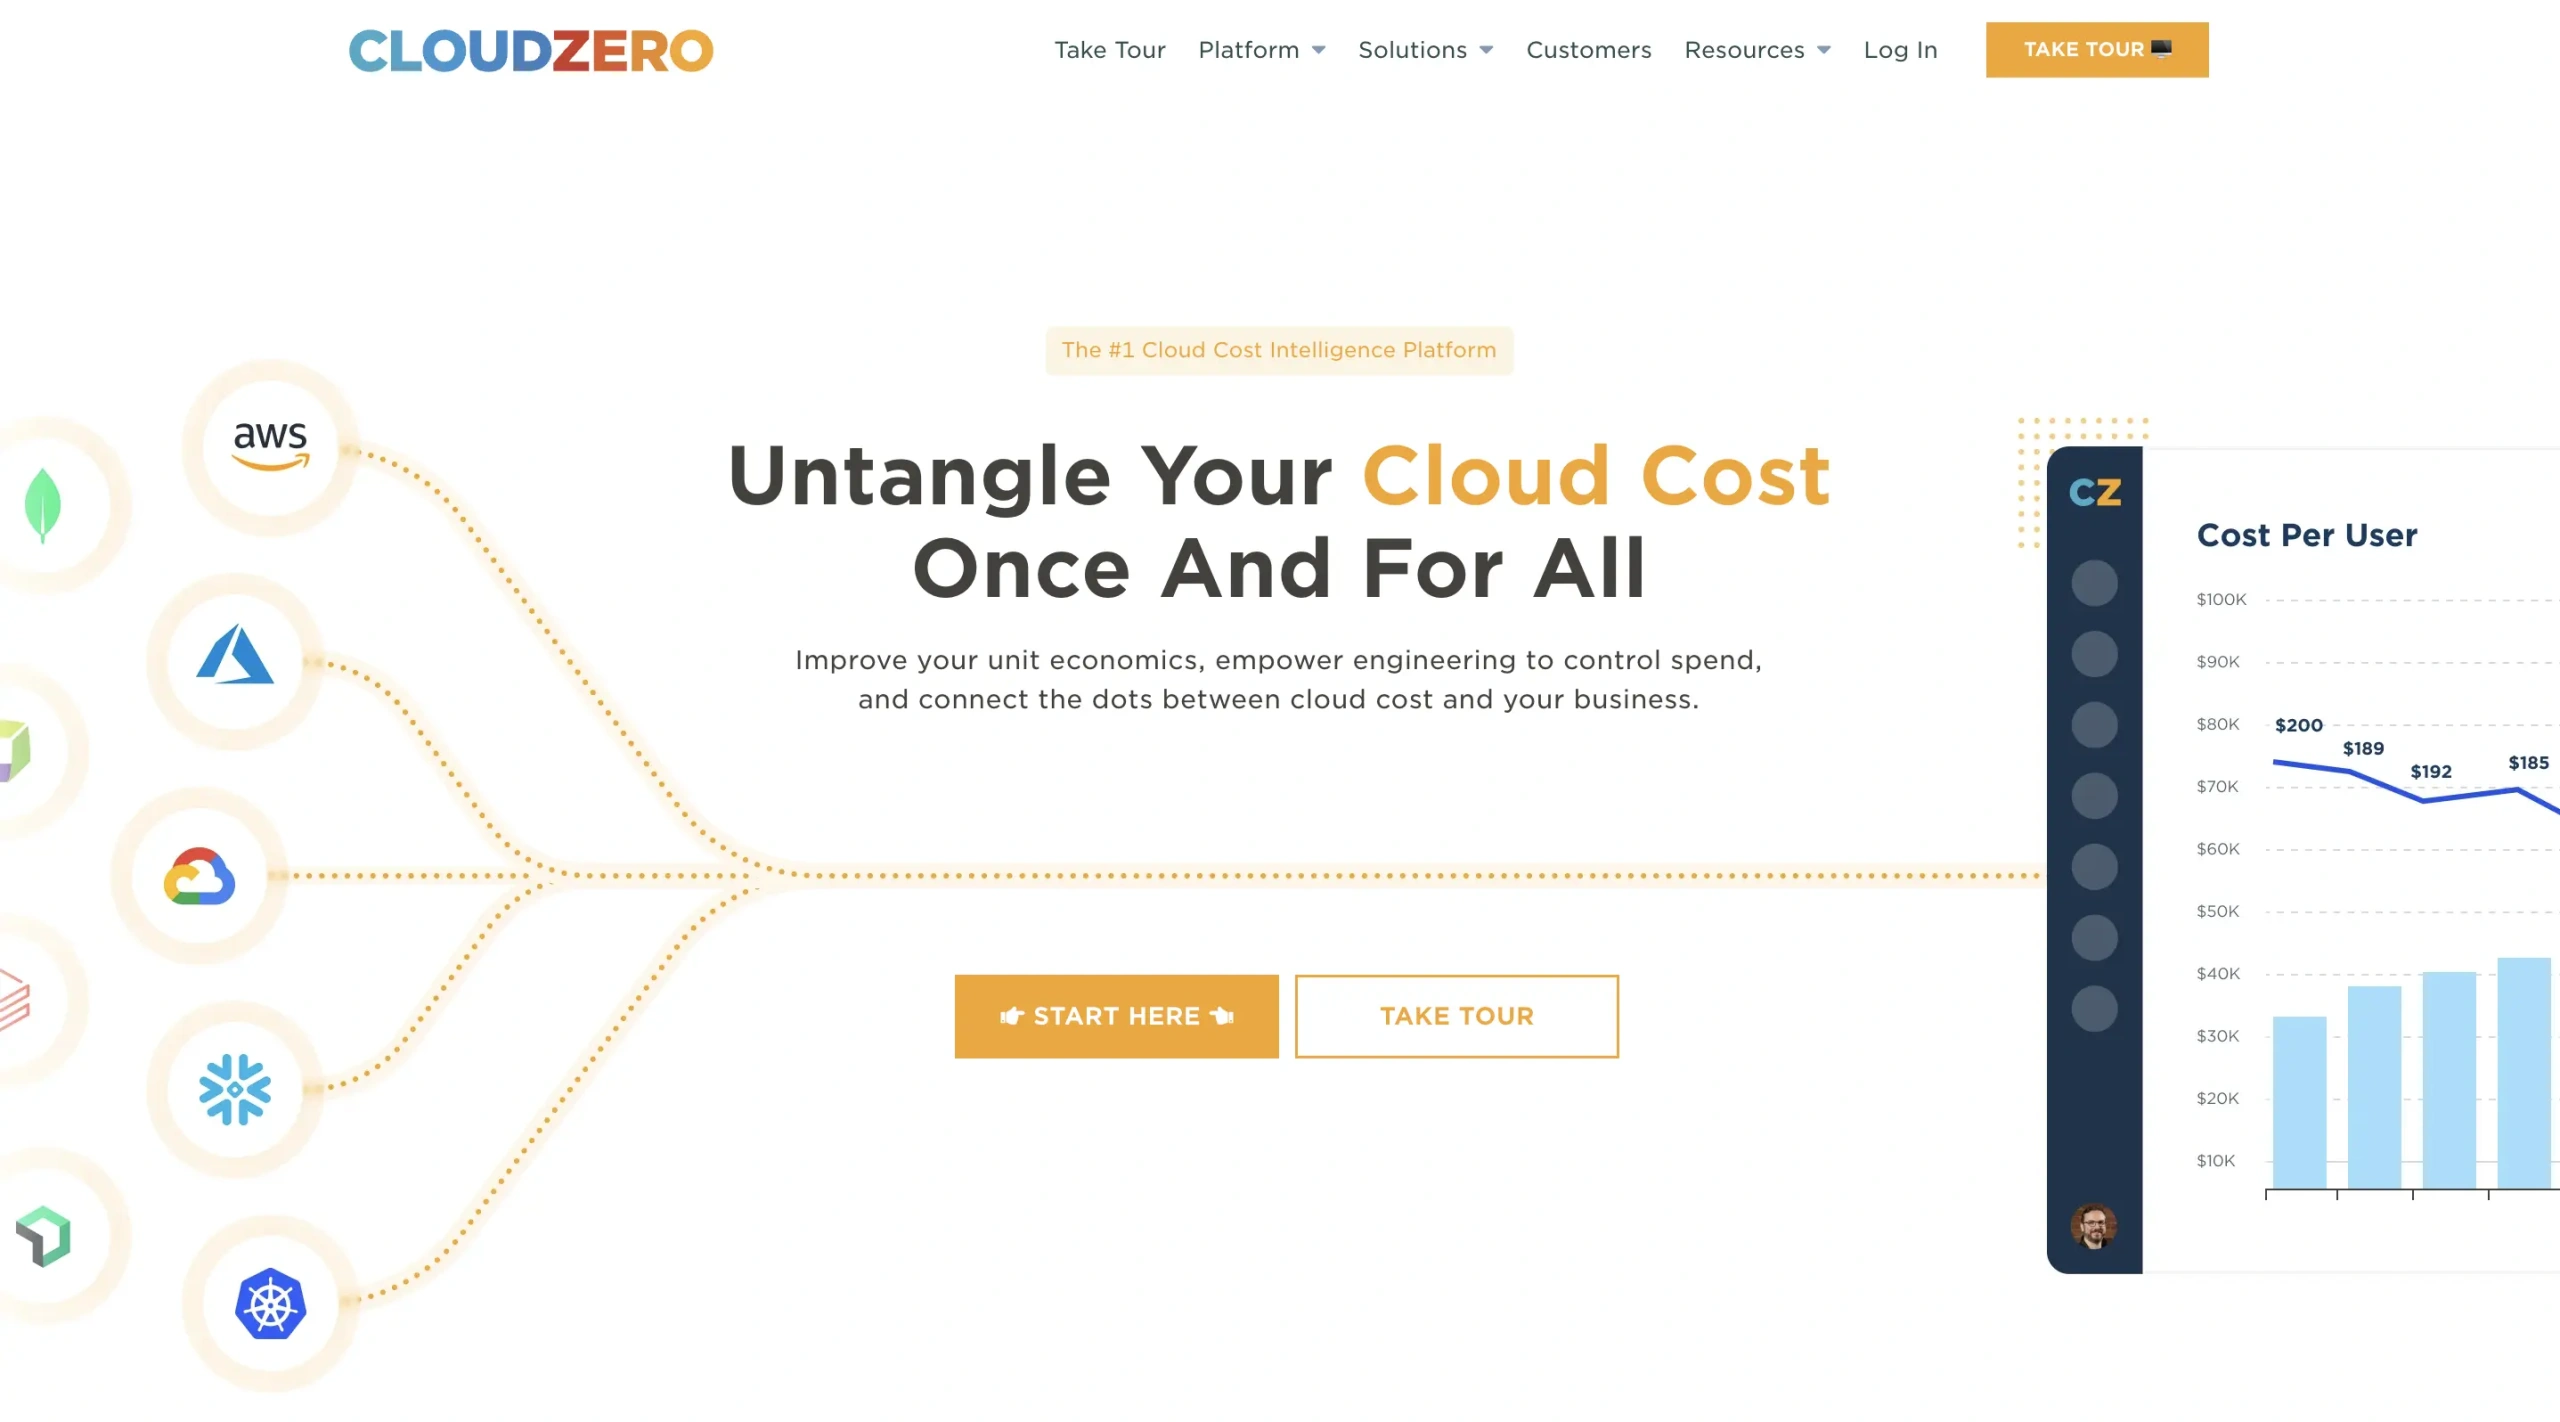
While the bulk of tools in this space prioritize performance monitoring, CloudZero is a platform that allows you to monitor another critical cloud factor that’s often overlooked — cloud costs.
The cloud cost intelligence platform itself is a cost monitoring solution that enables organizations to measure and monitor cost metrics that matter most to their business — like SaaS COGS, unit cost, cost per customer, feature, product, dev team, and more.
Engineers can see the cost impact of their work and finance teams can financially answer critical questions around costs. Teams can even drill into cost data from a high level down to the individual components that drive their cloud spend — and see exactly how services drive their costs and why.
Request a demo today to see what CloudZero’s cost intelligence platform can help your organization monitor, measure, and control cloud spend.


