A variance analysis report — sometimes called a budget variance report — is used to measure actual performance against your budgeted or planned performance.
From a finance perspective, it’s essentially a way to measure your organization’s financial planning effectiveness and identify cost variances before they compound. While there are a number of reasons you might be surprised by your variance analysis, it can be a signal that something went wrong along the way and you have not been collaborating with your team, are using the wrong tools, or have ineffective processes.
Follow these five best practices to ensure there are no issues with the way your budget is prepared — and that you’re never surprised by the variance analysis report in your cloud-based business.
1. Know What You’re Measuring And Create A Chart That Matches Your Business
Modern accounting descended from the industrial era. This means there are words and phrases typically used in the chart of accounts that may not apply to your cloud-based business.
You can rebuild your chart of accounts to more closely reflect your business so you don’t end up inadvertently hiding any costs.
For example, all your engineering costs don’t need to go under one budget line. Instead, separate out your labor, tools, cloud costs, and so on.
As your business and expenses grow, it will be easier to understand your individual costs if you don’t bucket them together. Align your chart of accounts with areas of the business that are poised to see growth, which are typically the engineering, marketing, and sales departments.
Report
Finance needs to prove AI’s return: CloudZero report
260 senior finance leaders (more than half CFOs) told us why the speed of seeing AI spend, not the size of it, separates who pulls ahead on AI from who gets burned.
2. Keep Your Financial Plan And Your Variance Analysis Report In The Same Place
This tip sounds simplistic, but you might be surprised to learn that many organizations do not take this approach.
A direct copy of your financial plan should be linked into your variance analysis report. They should live together so that when you update your financial plan, your variance analysis changes accordingly. This provides critical speed of insight into any variances, and ensures your information is always up to date. The value of having them tied together is that you can improve the accuracy of your forecasts by measuring how good of a forecaster you actually are.
3. Make Sure Your Data Sources Are Accurate
The integrity and accuracy of your data is key when it comes to your financial planning and variance analysis. When it comes to gathering data for your variance analysis report, the two “problem children” of many organizations are usually engineering and marketing. They often have the highest expenses and it is difficult to ascertain where they should be allocated.
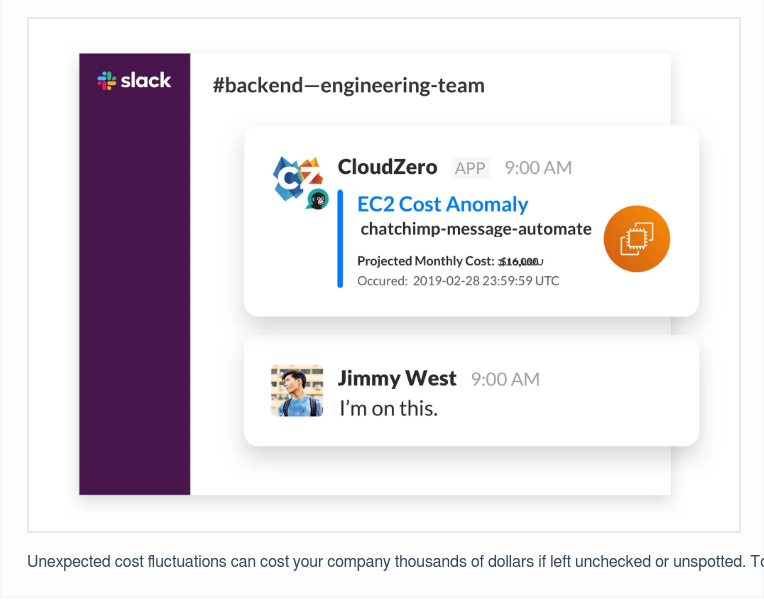
Tools like CloudZero can simplify understanding your engineering cloud costs and provide clarity for key impact areas of your business.

We also recommend that finance stays up to date using project tracking software like Jira, so they can evaluate the effectiveness of every engineering dollar spent. Depending on the size of the organization, you can break down expenses by person or by project to understand their spend and how it compares to the plan.
4. Use Both Numerical And Qualitative Data In Your Budget Variance Analysis
Most departments turn over a generic spreadsheet when finance asks for numerical data for their budget variance analysis report; finance then has to track down the key expenses and return numerals themselves.
This can lead to human error and confusion. Getting the right ROI numbers can also be challenging because the bank account or credit card statement doesn’t always tell the whole story — which is why pairing qualitative context with the right cloud cost management tools makes a meaningful difference.
However, if you also ask for qualitative data, you will learn the context behind the numbers.
The engineering team, for example, may be experimenting with machine learning, which is driving up costs. Having this background when going into your variance analysis report means you won’t be surprised if you see red.

5. Make Education A Two-Way Street
The best way to maintain a smooth variance analysis cycle is to avoid a large variance in the first place. This only becomes possible if you shift the organization’s cultural mindset around ROI.
For example, the engineering team doesn’t think in terms of business or investment ROI — they focus on how they can build the things they need for their product and achieve a product or customer ROI. However, if finance provides education around how their actions lead to ROI, they may begin to shift their mindset and make business decisions around that metric.
While engineering can learn about ROI from finance, finance can learn from engineering about the importance of using an incident response process. In engineering, if something doesn’t work as intended, the team has a specified process for identifying the issue, figuring out why it happened, fixing the problem, and learning from it.
In variance analysis, having a similar process can come in handy when the variance is greater than expected.
Plan Effectively So You Are Never Surprised By Your Variance Analysis Report
The major takeaway for financial planning and variance analysis is that open communication and collaboration are key.
You can look at all the spreadsheets you want, but sometimes it’s faster and more effective to walk over to the next department and ask them for more context on a specific metric.
In addition, using cost intelligence solutions like CloudZero can help you better understand your organization’s cloud spend in metrics that matter most to your business.  to see how it works.


