API metrics have long been a core part of building and operating reliable SaaS products. Teams track the likes of request volume, latency, and uptime to ensure APIs perform as expected under load.
First: API cost intelligence metrics measure how API usage translates into cloud, AI, and third-party spend — and attribute that cost to customers, features, workflows, and teams so SaaS businesses can protect margins as usage scales.
But today, the API metrics that matter most go beyond performance.
Modern APIs serve traffic, trigger multi-step workflows, and fan out across microservices. They also invoke AI models priced by token usage, and scale dynamically with customer behavior.
Each request now carries a real, variable cost that traditional API monitoring tools weren’t designed to explain.
In this guide, we’ll break down the API metrics every SaaS team must track so you can experiment freely without crashing your margins.
Performance Metrics Keep APIs Alive, Not Profitable
Latency, error rates, and availability explain whether an API works. They do not explain whether it makes or loses money. They’re table stakes for reliability and customer experience.
What they don’t tell you is how expensive that response was.
An API can meet every SLO while triggering multiple downstream services, retrying requests, invoking various AI models (with variable token usage), or moving large volumes of data across regions.
From the dashboard, everything can seem healthy. But from a cost perspective, the same request may now cost 2X, 5X, or even 10X more than it did last quarter.
“Traditional API metrics answer operational questions. But modern SaaS teams also need economic answers.”
Plus, API costs don’t scale linearly anymore
Today, a new feature can double your COGS without changing the request count.
That is because modern APIs are part of distributed, event-driven systems where a single request can fan out across microservices, queues, databases, and third-party APIs.
So, if you’re only watching request volume and latency, those dynamics can remain invisible. Well, until they show up in your bill.
Another reason API cost issues persist is organizational
Consider this: engineering teams see requests, endpoints, and traces. Finance teams see invoices, budgets, and variances.
That means each group is often looking at a different version of the truth. And without shared metrics, conversations start to sound like this:
- “Yeah, traffic grew as expected.”
- “Our costs grew faster than revenue.”
- “Nothing changed on our side!”
In practice, something did change. It just happened inside API workflows, request paths, or AI usage patterns that weren’t visible in financial terms.
The API metrics that matter today bridge that gap. They connect technical behavior to economic impact, so you can understand not just what happened, but also why it mattered.
Report
Finance needs to prove AI’s return: CloudZero report
260 senior finance leaders (more than half CFOs) told us why the speed of seeing AI spend, not the size of it, separates who pulls ahead on AI from who gets burned.
This Gap Matters More Than Ever
APIs now sit at the center of customer-facing features, partner integrations, internal automation, and, more resoundingly now, AI-powered workflows.
That makes APIs one of the most scalable (and most consequential) cost drivers in most SaaS businesses today.
So, teams that continue to track APIs purely as infrastructure risk scaling inefficiency along with usage.
But the ones who’ll track APIs as economic engines as well will gain the clarity to experiment, optimize, and grow without eroding their SaaS margins. How?
That’s the shift we’ve built this guide around. And we’ll start by breaking down the API usage metrics that actually explain where costs are coming from.
API Usage Metrics That Explain Where Costs Come From
Consider these:
1. Request volume (by endpoint, feature, and customer)
Many teams track total API calls per service or per environment. And that’s useful for capacity planning.
But to make request volume actionable, it needs context. More specifically:
- By endpoint: Some endpoints are cheap; others trigger expensive workflows.
- By feature: Two features may generate similar traffic but vastly different costs.
- By customer or account: High-usage customers can become margin-negative pretty quickly.
Without this segmentation, teams often optimize the loudest services instead of the most expensive ones.
In practice, request volume only becomes meaningful when it’s tied to ownership and intent, not just infrastructure.
2. Request amplification ratio
Request amplification is one of the fastest ways API costs grow without traffic growth, because every downstream call multiplies compute, network, and AI usage.
The request amplification ratio captures this behavior by answering the simple but powerful question, “For every incoming API request, how many total API calls does the system execute?”
A 1:1 ratio is rare. Ratios of 5:1, 10:1, or higher are more common, especially in microservices and AI-driven systems.
This metric matters because amplification multiplies cost sprawl. Traffic can stay flat while total API execution (and the related costs) rise sharply.
3. Multi-call workflow depth
Amplification relates closely to workflow depth (the measure of how many API calls are required to complete a single business action).
Examples here include generating a report, onboarding a customer, or producing an AI-generated response. Each action typically spans multiple services and APIs.
Over time, these workflows tend to grow. So, tracking your calls per workflow can help you spot when a system is becoming more complex and expensive than the value it delivers.
4. Internal vs external API call mix
Internal service-to-service calls primarily consume compute and network resources. External calls often add third-party API charges, AI model usage, and data egress fees.
Understanding the mix between internal and external API calls helps your folks answer critical questions, like:
- Which workflows rely most heavily on paid APIs?
- Where are vendor costs embedded inside our services?
- How exposed are we to usage-based pricing changes?
This distinction is increasingly important as modern SaaS stacks rely more heavily on AI providers, payment processors, data enrichment services, and external integrations.
Yet, API usage metrics explain where activity comes from — but not how efficiently that activity turns into cost.
These metrics show where API activity is coming from and how it behaves. But they don’t reveal how much your usage is costing. Let’s dive into that next.
API Efficiency Metrics That Reveal Waste and Optimization Opportunities
Once you understand where API usage comes from, the next step is assessing efficiency and uncovering optimization opportunities.
1. Cost per API call
If you track only one API metric in 2026, it should be cost per API call — because it converts engineering behavior into unit economics.
Cost per API call translates raw technical activity into economic meaning. Instead of just counting requests, you can see how expensive each request actually is.
A meaningful cost-per-call calculation includes:
- CPU and memory
- Storage and database operations
- Networking and data transfer
- Downstream service dependencies
- AI and token-based usage, where applicable
And instead of debating whether traffic “went up,” you can capture:
- Which endpoints are becoming more expensive
- Whether optimizations actually reduce cost
- Which APIs are cheap at low volume but costly at scale
Your Cost per API Call can also surface uncomfortable truths, like features that look successful based on adoption, but erode your margins with every request.
2. Token usage per API request
AI-driven APIs often appear operationally healthy while silently becoming margin-negative due to untracked token usage per request.
With clear visibility into your token usage per request, you can compare efficiency across features, identify customers or workflows driving disproportionate AI spend, and optimize prompts and response patterns intentionally.
3. Retry rate and error cost impact
Every retry is a hidden tax: it re-executes compute, retriggers downstream APIs, and often re-consumes AI tokens without delivering new value.
However, don’t just track the retry rate. Also capture the cost impact of retries by endpoint and workflow. After all, a small retry loop on a high-cost API can double your costs without changing your request volume by much.
Tracking your retry cost can also help you distinguish between noisy but cheap retries and truly expensive ones (and prevent undetected cost inflation over time).
4. Cache effectiveness and avoided API cost
Combine these two, and you get a far more insightful metric for answering questions like:
- How much spend did caching prevent?
- Which endpoints benefit most from caching?
- Where are our cache misses that are disproportionately expensive?
Framing caching in cost terms helps you justify investments in better caching strategies, instead of just faster responses.
Now, to make your API metrics truly actionable across the business, the next step is understanding who owns that cost and what it supports.
That’s where cost attribution comes in.
API Cost Attribution Metrics That Both Finance and Engineering Need
Usage and efficiency metrics explain how APIs behave. Cost attribution metrics explain how that behavior impacts revenue, margins, and pricing decisions.
These attribution metrics tend to have the biggest impact on API cost optimization in our experience.
1. Cost per customer (API-driven)
Every customer action (like searches, exports, automations, and AI requests) flows through APIs. So, tracking your API-driven cost per customer enables you to:
- Identify customers whose usage scales faster than their revenue
- Spot power users that require different pricing tiers or limits
- Understand which customer segments are most efficient to serve (so you can focus on attracting more of them to grow your bottom line)
Picture this:
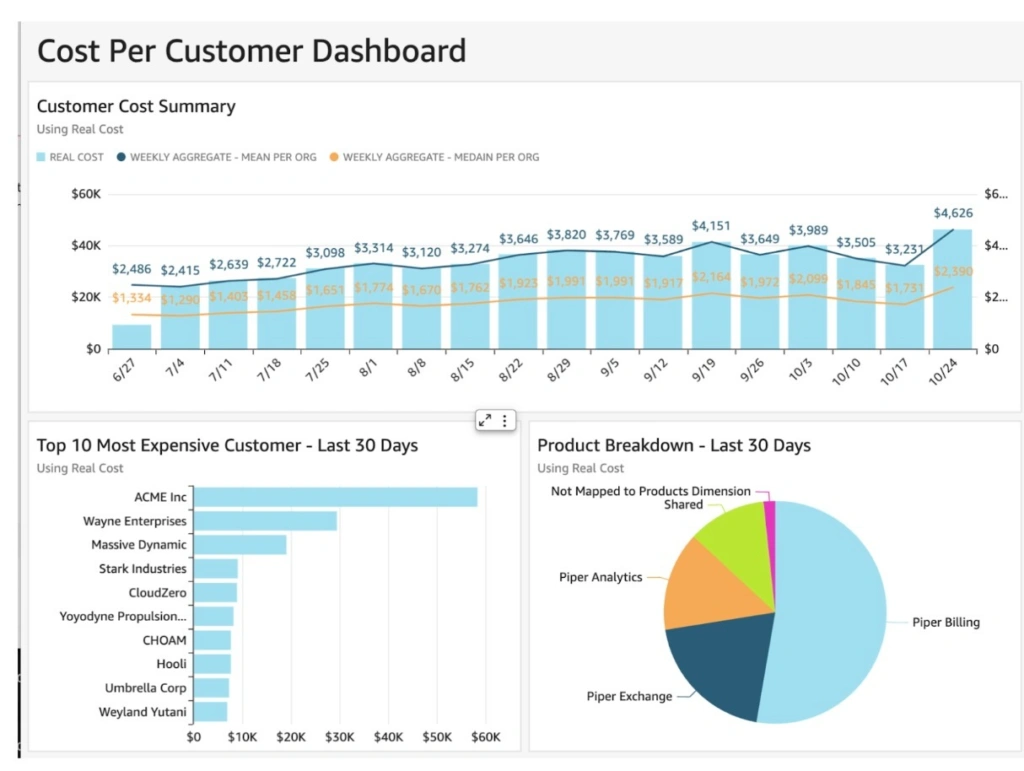
This metric is especially important for finance teams trying to reconcile ARR growth with margin compression. Often, the issue isn’t pricing but unreported API usage behavior.
Helpful resource: How To Track Cost per Customer Better Than Anyone Else
2. Cost per feature or product area
Tracking your cost per feature can help you answer questions that traditional metrics can’t, like:
- Which features are most expensive to operate?
- Is this newer feature more cost-efficient than this legacy one?
- Does this feature’s usage justify continued investment?
The Cost per Feature is especially critical when you need to decide whether to expand or deprecate a feature, set up or revise your pricing and tiers, and decide how to prioritize engineering efforts.
Related: How to Price AI Features Without Losing Money
3. Cost per workflow or business transaction
Some of the most valuable API metrics don’t map to endpoints at all. They map to business actions. Examples here include:
- Cost per checkout
- Cost per report generated
- Cost per onboarding flow
- Cost per AI-generated recommendation
These workflows represent true SaaS unit economics, because customers buy outcomes, not API calls. So, measuring your cost per workflow can help your team get a true unit economics view of how the product operates in the real world.
Then you can use the metric to answer high-stakes questions like:
- Does this workflow become more profitable at scale?
- Are we subsidizing certain actions unintentionally?
- And should we redesign this flow before usage grows further?
For finance and leadership teams, this is where API metrics finally connect to pricing, margin modeling, and growth strategy.
4. Cost by team, service, or environment
Attribution is also internal, like this:
Understanding your API costs by units, like per team, service owner, or environment, can help you:
- Encourage responsible experimentation
- Set guardrails without slowing delivery
- Hold teams accountable for outcomes
When your folks can see the financial impact of their own systems and technical decisions, they can focus on teaming up to improve costs instead of finger-pointing.
Takeaway: Attribution metrics can help you turn API costs from a shared mystery into something your teams can reason about and act on. Instead of asking “Why is our cloud bill so high?”, teams can ask, “Which customers or features drive this spend?” Or, “Is the value worth the cost?”, and “What should we optimize, price differently, or invest in further?”
Yet, even with perfect attribution, you’ll still need to anticipate risk. And that’s where forecasting and anomaly API metrics come in.
API Risk And Forecasting Metrics That Prevent Budget Surprises
The API metrics above explain the past. Risk and forecasting metrics explain what will break your margins next. With the right risk and forecasting metrics, you can focus on what’s about to happen. Meaning you can tell where to intervene before it impacts your bottom line.
1. Cost anomalies by API endpoint
Traditional anomaly detection flags spikes in total spend. API-level anomaly detection is far more precise because you can detect issues like:
- An endpoint whose cost jumped without traffic growth
- A new feature that changed request behavior
- A code or configuration change that increased downstream calls
- An AI model update that altered token consumption
That can look like this:
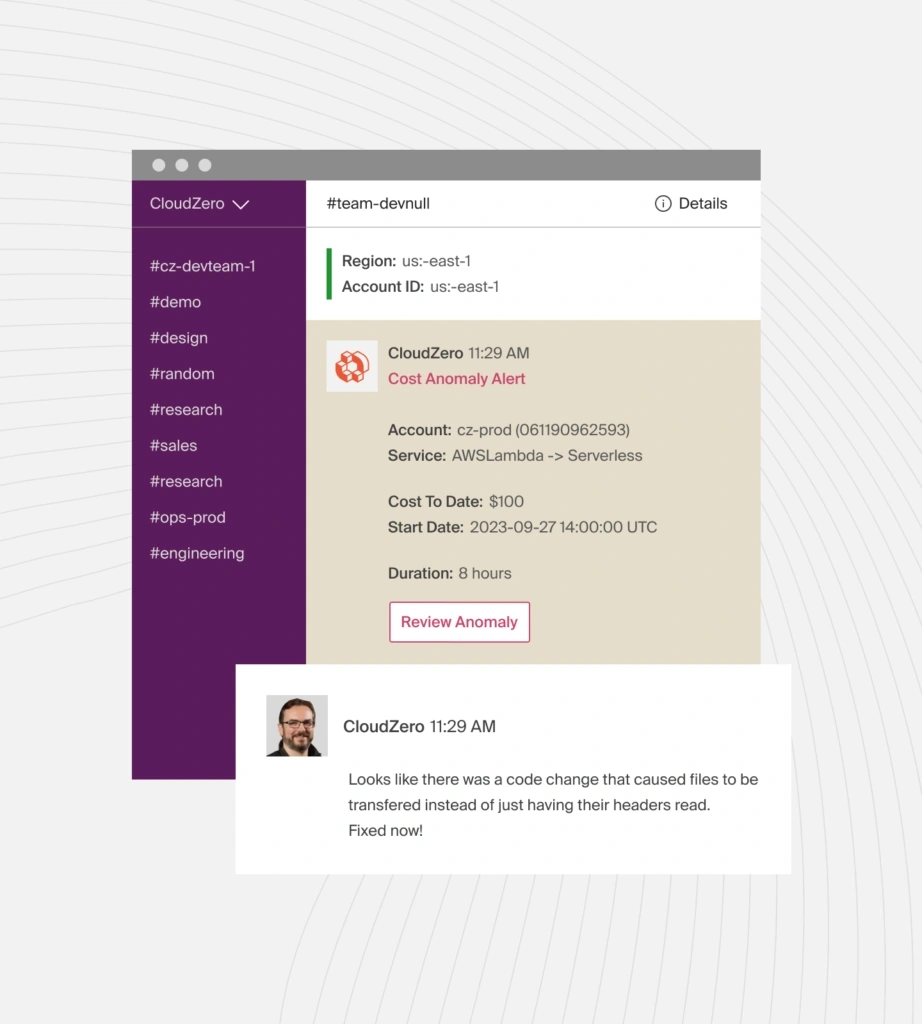
What makes this metric powerful is correlation. Instead of saying, “Costs went up yesterday,” you can see and say:
- “This endpoint doubled in cost after the last deployment.”
- “Retries in this workflow started consuming 3X more tokens.”
That context transforms anomalies into fixable engineering issues instead of finance emergencies.
2. Marginal cost per incremental API call
Marginal cost helps you answer the deceptively simple question, “What does the next API call actually cost us?”
Relying on averages alone hides nonlinear scaling, customer-specific cost differences, and the step-function pricing effects common with AI usage. An API can look cheap on average but become expensive at the margin. This tends to happen once caching is exhausted, retries increase, or larger customers adopt heavier workflows.
But tracking marginal cost helps teams:
- Forecast spend under different growth scenarios
- Model the true cost of onboarding new customers
- Decide whether your pricing, limits, or architecture need adjusting
For CFOs and FP&A teams, it becomes the foundation for accurate forecasting and margin modeling.
Helpful resource: What is Marginal Cost for Engineers (And 10 Architecture Decisions That Secretly Inflate Your Costs)
3. Cost growth rate vs. Usage growth rate
Another forecasting blind spot is assuming usage growth and cost growth move together.
They rarely do.
Instead, compare the API usage growth rate and your API cost growth rate. It’ll help you spot early warning signs that efficiency is degrading.
Examples here include:
- Costs growing faster than requests
- Stable traffic with rising API costs
- Feature launches that permanently raise your baseline API cost
Here’s another one.
4. Forecast accuracy by API-driven cost center
Forecasting API spend is notoriously difficult when APIs are treated as shared infrastructure.
Instead, you’ll want to break down your forecasts by more granular insights, such as API service, feature, or workflow. It’ll help you improve accuracy.
Instead of one opaque “API cost” line item, you can model how specific behaviors affect your future spend. And that means you can enable more reliable budgets, better pricing decisions, and have fewer end-of-month surprises as a result.
Takeaway: Risk and forecasting metrics shift the conversation from “Why did this spike happen?” to “What’s about to get more expensive, and why?” That visibility helps teams fix issues before they hit the bill, greenlight experiments with cost confidence, and scale APIs without fear of runaway costs.
At this point, the remaining challenge isn’t what to measure. It’s how to make all these metrics visible, consistent, and actionable across teams.
Here’s how.
Why Traditional API Observability Tools Aren’t Enough
Most SaaS teams already have solid API observability in place. They can trace requests across services, inspect logs, and diagnose failures quickly.
But API observability tools tell you where a request went, why it failed, and which service introduced latency. They don’t tell you how much that request cost, whether the workflow was efficient, or if a specific customer or feature is eroding margins now.
By the time you get it manually, the technical context is gone. Nobody can easily connect the bill back to specific API behavior. And that makes it difficult to tell what to fix, how, and where.
This is exactly where CloudZero fits in
CloudZero serves as the FinOps system of record for API economics, connecting usage signals to cloud and AI spend and attributing that cost across customers, features, and workflows.
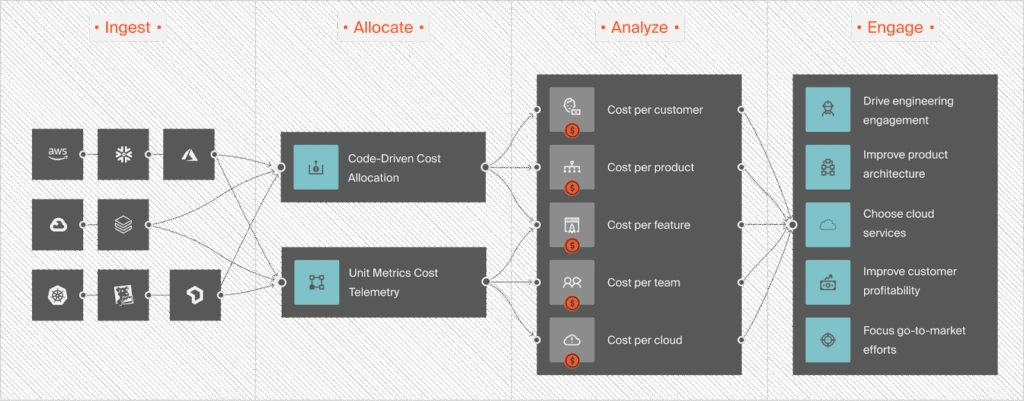
Instead of guessing where your API costs are coming from, you can see them clearly, along with rich context about the people, products, and processes driving them. Meaning you can tell exactly why the changes are happening and where to fix them — without halting experimentation and innovation.
Key Takeaways:
- Modern APIs are economic engines, not just infrastructure
- Cost per API call is the foundational metric for 2026
- Attribution turns API spend into unit economics
- Teams that track API economics can scale without margin erosion
If APIs are central to how your product works and how your business scales, you’ll not want this level of cost visibility as an afterthought.
Instead, grab your free, personalized demo here to see how leading teams (like Toyota, Grammarly, and Moody’s) use CloudZero to turn API metrics into clear, actionable cost intelligence, so they can scale innovation without sacrificing profitability.