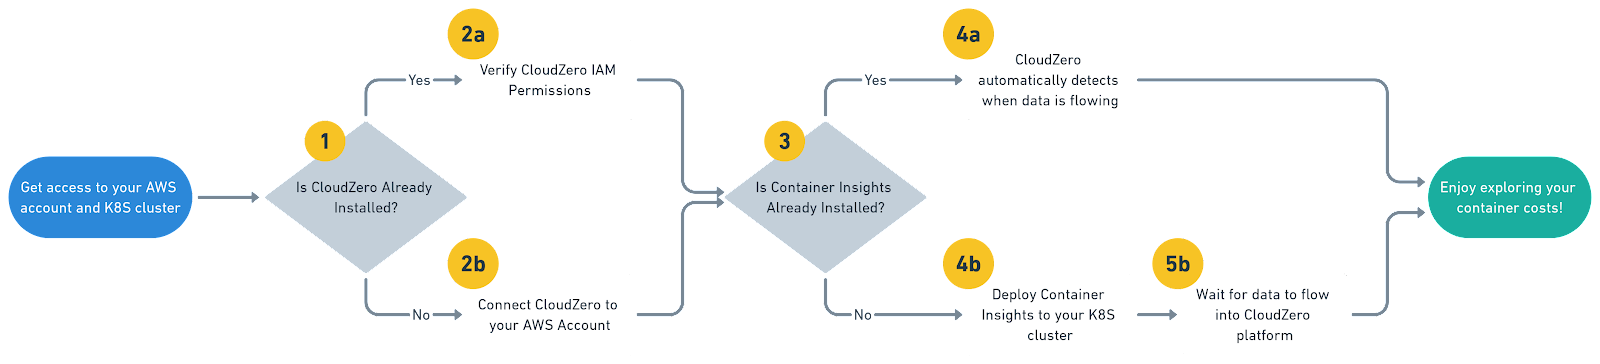
If you are looking to account for your container costs and understand how your AWS Kubernetes or EKS cluster spend maps onto your workloads, this guide was made for you! In this post we will walk through the steps to get up and running with CloudZero and Amazon Container Insights fast.
CloudZero has integrated with Amazon CloudWatch Container Insights for its strength as a secure and automated solution for sharing container metrics within AWS. In addition for the many customers who have already embraced Container Insights, CloudZero gained the added benefit of being able to detect and start reporting on your container costs immediately without any configuration.
“CloudZero and Amazon’s CloudWatch Container Insights made it possible for us to go further, and easily track cluster costs based on actual consumption — which let us identify the applications consuming the most resources, and prioritize our engineering resources where we could leverage them the most.” ― Matthew Jackson, DevOps @ Drift
Step 1: Connect CloudZero to your AWS account
If you don’t already have CloudZero configured for your environment, start a free trial and create your account. Once connected we will guide you through the setup process.
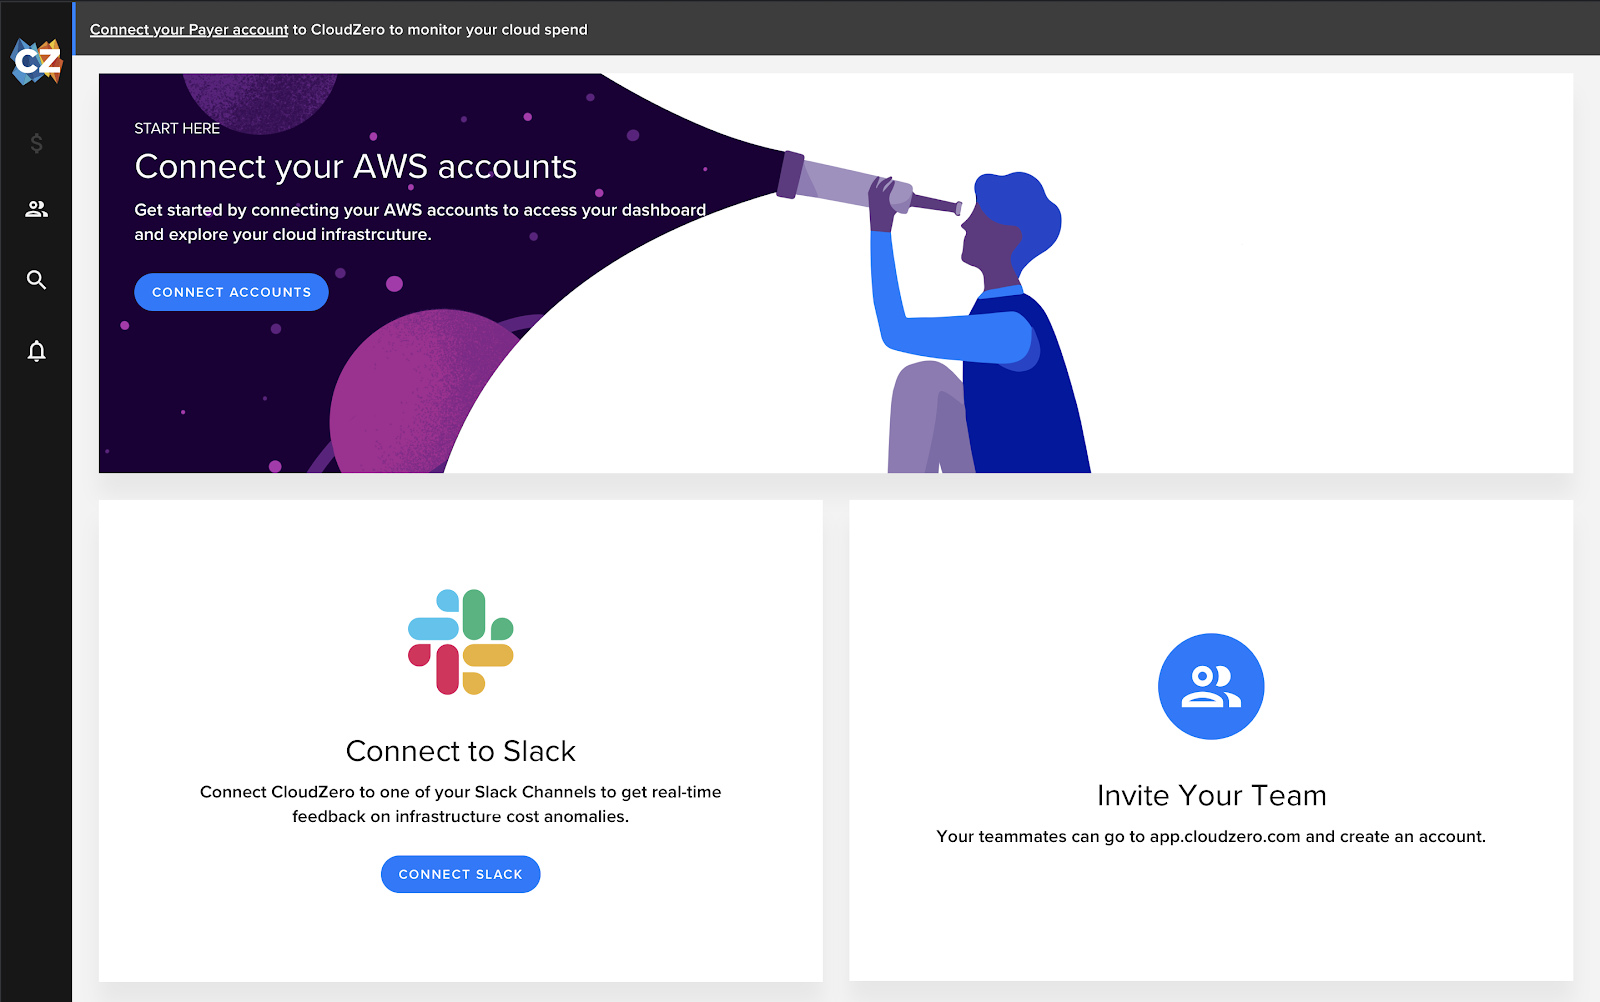
You will need access to your primary AWS payer account and an account that has a Kubernetes or EKS cluster deployed. If you are unsure about how best to get started, click on our in product chatbot and we can help you out. Once connected (via our fully automated CloudFormation template) and you have AWS billing data flowing, you are ready to install Contain Insights
Report
Finance needs to prove AI’s return: CloudZero report
260 senior finance leaders (more than half CFOs) told us why the speed of seeing AI spend, not the size of it, separates who pulls ahead on AI from who gets burned.
Step 2: Deploy Container Insights to your Cluster
Apply Container Insights to your Cluster
The AWS getting started documentation to configure Container Insights for your Kubernetes or EKS cluster is a little verbose, here is the abridged version.
- Give your cluster the ability to write data to AWS CloudWatch by attaching the AWS Managed CloudWatchAgentServerPolicy to the IAM policy attached to your Kubernetes or EKS worker nodes. (more details on this and other considerations can be found here)
- From a terminal window that has kubectl installed and connected to your cluster, run the following command after replacing CLUSTER-NAME and CLUSTER-REGION with your actual cluster name and region:
$ curl https://raw.githubusercontent.com/aws-samples/amazon-cloudwatch-container-insights/latest/k8s-deployment-manifest-templates/deployment-mode/daemonset/container-insights-monitoring/quickstart/cwagent-fluentd-quickstart.yaml | sed “s/{{cluster_name}}/CLUSTER-NAME/;s/{{region_name}}/CLUSTER-REGION/” | kubectl apply -f –
You can also download, edit, and review this template before applying it.
This installs two Daemonsets, one for cloudwatch-agent and one for fluentd. This Daemonset is created in the amazon-cloudwatch namespace, which you can verify using the following terminal command:
$ kubectl get ds -n amazon-cloudwatchNAME DESIRED CURRENT READY UP-TO-DATE AVAILABLE NODE SELECTOR AGEcloudwatch-agent 2 2 2 2 2 <none> 91dfluentd-cloudwatch 2 2 2 2 2 <none> 3d4h
Once configured, you can verify that Container Insights data is properly making its way to AWS by checking that the /aws/containerinsights/<cluster-name>/performance CloudWatch log group is present and has data, you should also start to see data populate the Container Insights dashboard.
To verify run the following AWS CLI command, which should produce a list of available performance logs:
$ aws logs describe-log-groups –log-group-name-prefix /aws/containerinsights/|grep performance
Once deployed, Container Insights gathers performance metric data (CPU/memory/network usage) and writes this information to the following CloudWatch Log groups:
|
CloudWatch Log Group |
Purpose |
Source |
|
/aws/containerinsights/<cluster-name>/performance |
Performance Metrics |
cloudwatch-agent |
|
/aws/containerinsights/<cluster name>/application |
Application Logs |
fluentd-cloudwatch |
|
/aws/containerinsights/<cluster name>/dataplane |
Dataplane Logs, kubelet.service, kubeproxy.service, and docker.service |
fluentd-cloudwatch |
|
/aws/containerinsights/<cluster name>/host |
Logs from Hosts/nodes. var/log/dmesg, /var/log/secure, and /var/log/messages |
fluentd-cloudwatch |
Container Insights also uses the Embedded Metric Format (EMF) to create custom CloudWatch Metrics which also drive the Container Insights dashboards and are available for you to use in your own CloudWatch dashboards and alarms.
Step 3: Connecting CloudZero to Container Insights
This step is the easiest because it’s automatic and one of the reasons why this integration is so powerful. CloudZero automatically identifies when Container Insights is enabled and uses the data from the /aws/containerinsights/<cluster-name>/performance log to calculate and display your container costs with no additional configuration required on your part. CloudZero performs a very efficient CloudWatch Logs Insights query every hour to aggregate metrics with minimal impact on your AWS costs.
CloudZero will also automatically ingest past data as well so if you already have a month’s worth of Container Insights data, after connecting CloudZero to your account, you will be able to analyze a month’s worth of costs as well.
|
Note: Container Insight Cost Considerations |
Additional Configuration Considerations
Verify CloudZero’s IAM Permissions
Ensure CloudZero has the necessary IAM permissions to access your Container Insights CloudWatch Log stream.
If you configured CloudZero automatically using our CloudFormation template, then the CloudZero Role has everything it needs and no further configuration is necessary. If however, you configured CloudZero manually, the easiest way to verify access is to ensure the CloudWatchLogsReadOnlyAccess policy is attached to the CloudZero cross-account access role (note: not to be confused with the CloudWatchReadOnlyAccess policy). You will need to configure the CloudZero role in each AWS account that has Container Insights enabled.
You can also choose to restrict the CloudZero access role to only those CloudWatch Log Groups necessary using the following policy snippet:
{
“Sid”: “ContainerInsightsMonitoring”,
“Effect”: “Allow”,
“Action”: [
“logs:TestMetricFilter”,
“logs:StopQuery”,
“logs:StartQuery”,
“logs:List*”,
“logs:Get*”,
“logs:FilterLogEvents”,
“logs:Describe*”
],
“Resource”: “arn:aws:logs:*:*:log-group:/aws/containerinsights/*”
},
Note: You will need to configure the CloudZero cross-account access role if you manually connected your accounts or connected them using CloudFormation before June 1.
You can reconfigure the CloudZero IAM Role manually by editing the CloudZero resource role or by removing the CloudZero CloudFormation stack and re-connecting your account via the CloudZero account connection page.
Tune Container Insights for your Environment
1: The log groups created by Container Insights are created without any expiration set. While the log storage costs are likely small, you should always consider how long you want to retain any data. To configure the log retention days you have two options:
- Set the expiration in fluentd.yml by adding retention_in_days and add “logs:PutRetentionPolicy” permissions to your IAM worker node policy (this permission is not included in the managed policy you attached earlier).
- Manually change the retention settings on the log group itself
2. Container Insights creates custom cloudwatch metrics via EMF which depending on the size and scale of your clusters can be cost-prohibitive.
For example, a small cluster might look something like this:
24 cluster metrics + (5 nodes or EC2 instances * 8 node metrics) + (10 unique pod names * 9 pod metrics * 5 namespace) + (5 unique service names * 6 service metrics * 5 namespace) + (1 unique namespace * 6 namespace metrics)
This gives us the equation:
24 + (5 * 8) + (10 * 9 * 5) + (5 * 6 * 5) + (5 * 6) = 694 metrics
Which at $0.30 per metric for first 10,000 metrics, this comes to $208.20 per month
If the metrics will be too costly for your environment, you can turn these metrics off using a CloudZero provided configuration that disables the CloudWatch EMF metrics, more information on this can be found here.
NOTE: Doing this will completely disable the Container Insights Dashboard and is only recommended if you find the custom metrics to be too costly. These metrics are not required for CloudZero to monitor your costs.
3: If you already have centralized logging solution configured for your cluster you can remove the application logging (fluentd-cloudwatch) component by running the following command:
$ kubectl delete daemonset fluentd-cloudwatch -n amazon-cloudwatch
Troubleshooting
The AWS CloudWatch Agent DaemonSet is not loading
- First check that you have enough capacity across your nodes, if either the CloudWatch or FluentD daemonsets are not deploying, you might be out of resources.
- Next, check your taints and tolerations. Many organizations will taint their more ephemeral auto-scaling node groups (for example node groups that use Spot compute) to prevent kube-system and other similar components from running. If so you will need to configure a toleration to allow the CloudWatch agent to run, for example, if you have tainted your node group as follows:
$ kubectl taint nodes MyNodeGroup key=value:NoSystem
Then you will need to add the following toleration to allow the CloudWatch agent to run:
tolerations:
– key: “key”
operator: “Exists”
effect: “NoSystem”
No data or partial data is flowing to CloudWatch
This is almost always due to a misconfiguration of your node groups IAM policy. Ensure you have applied the CloudWatchAgentServerPolicy to your policies and ensure you have covered all of your node groups. It is typical to have multiple node groups, either managed by EKS, self-managed, or completely custom-configured. When in doubt get a list of your nodes using kubectl get nodes and verify each one has the right IAM policy attached.
Somethings not working, how can I start from scratch again?
Removing CloudZero:
Delete the CloudZero CloudFormation Stack to remove CloudZero’s access from your environment.
Note, CloudZero may have created the AWS Cost and Usage report (CUR) during setup which writes data to S3. Removing the CloudZero CloudFormation stack will not remove the CUR configuration or the S3 bucket.
Removing Container Insights:
Run the same command as before, this time using delete instead of apply, don’t forget to replace CLUSTER-NAME and CLUSTER-REGION with your actual cluster name and region:
curl https://raw.githubusercontent.com/aws-samples/amazon-cloudwatch-container-insights/latest/k8s-deployment-manifest-templates/deployment-mode/daemonset/container-insights-monitoring/quickstart/cwagent-fluentd-quickstart.yaml | sed “s/{{cluster_name}}/CLUSTER-NAME/;s/{{region_name}}/CLUSTER-REGION/” | kubectl delete -f –
Wrapping up: Fully Automated Container Cost Allocation
By using CloudZero to combine the metrics from Container Insights and AWS Cost and Usage information customers can automatically allocate costs to the workloads being orchestrated by Kubernetes. CloudZero calculates the cost of each pod within the architecture and then re-aggregates them to attribute costs to other hierarchical Kubernetes concepts, like namespaces and clusters. 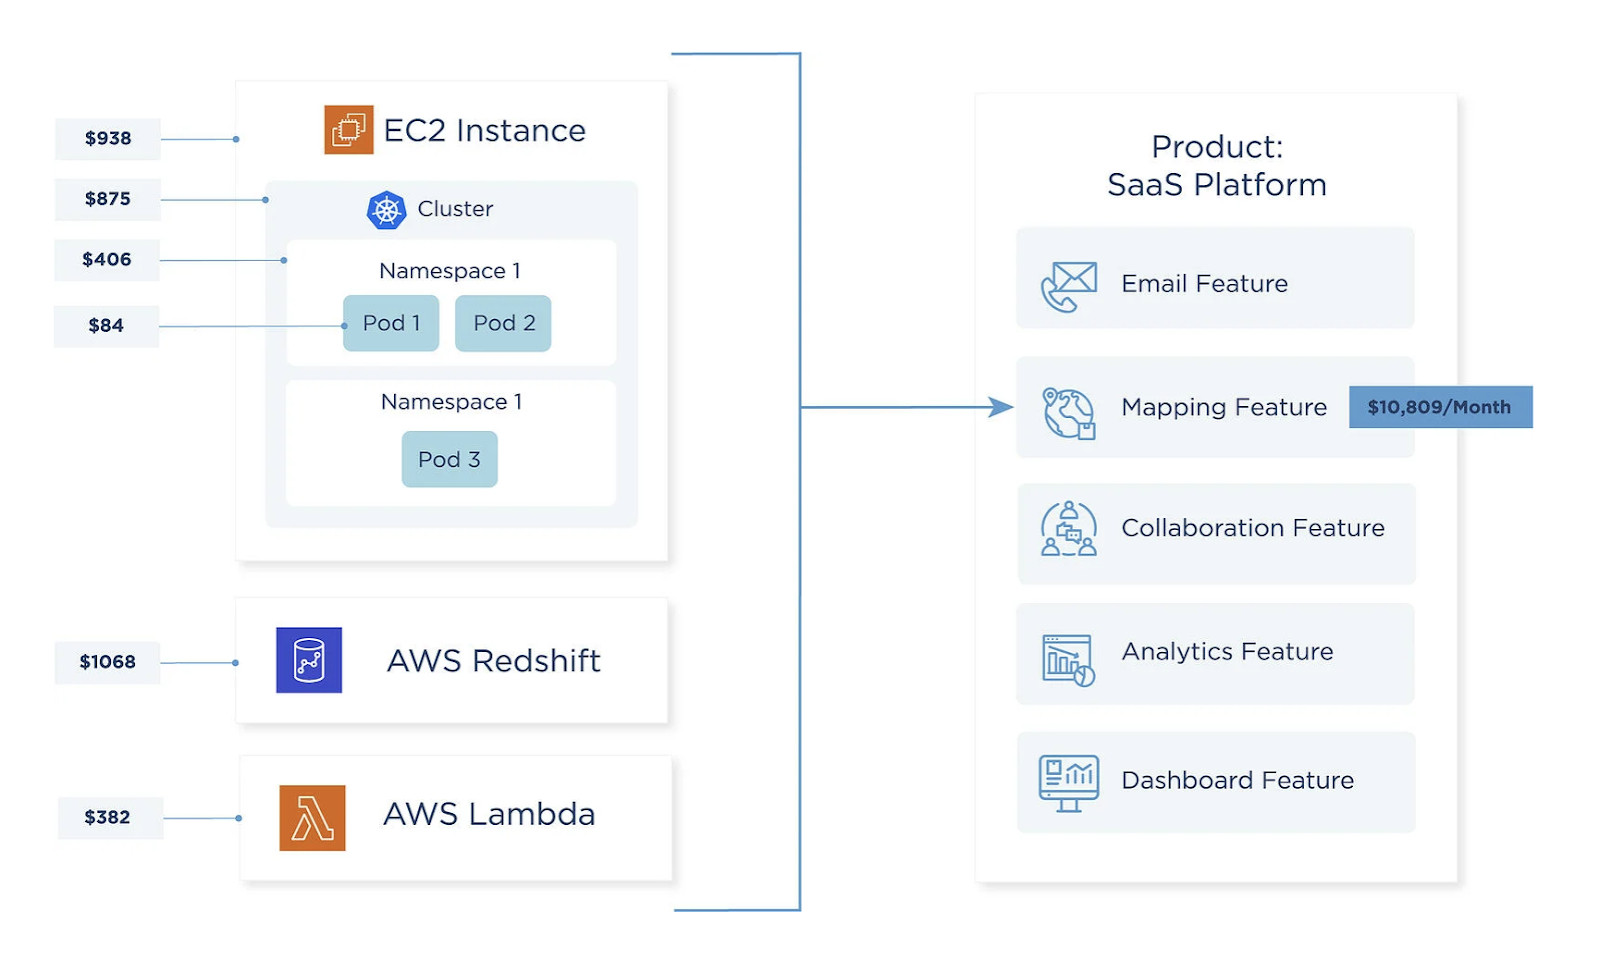
Container Cost Nirvana: Mapping your AWS and container costs to your business
Cost is calculated based on the cost of the EC2 instance – which represents the cost of a node in the Kubernetes system – combined with pod-level CPU and memory utilization. This allows us to assign a portion of the node’s total cost to the pod. This is handled automatically in the CloudZero platform; there is no need for manual allocation rules.
Generally speaking, this proportional algorithm works across a broad range of EC2 instance types, including those with SSD, NVMe SSD, GPU cores, GPU memory, and networking enhancements.
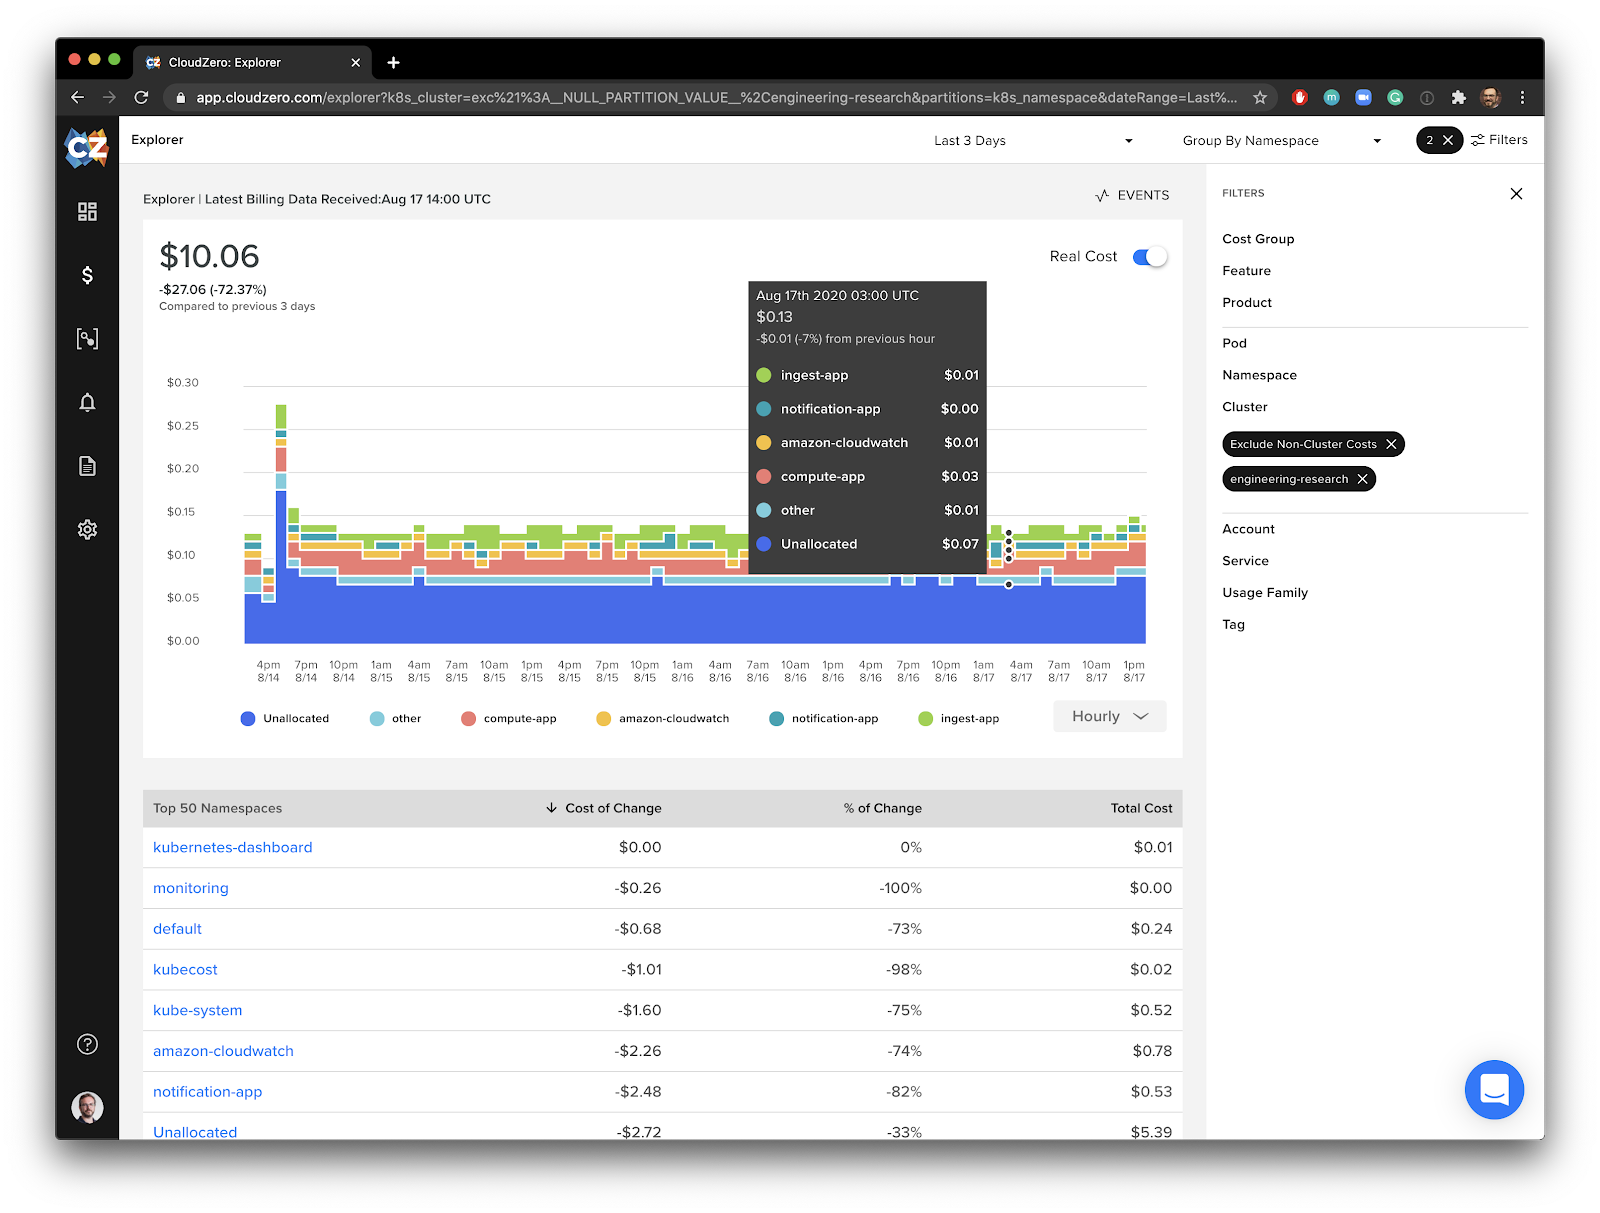
The final result is a new way to explore your container costs over time by cluster, pod or namespace using CloudZero. For example, we can use CloudZero to take a look at one of our clusters and see how it’s costs decrease as we scale down the cluster.
We can also observe the cost to run Container Insights itself on the cluster, which in this example, is only about $0.01 a day.
A better view into EC2 and Kubernetes spend with CloudZero
For Drift, this has empowered them to go beyond their cost savings goals and start to think proactively about optimizing their cloud computing spend.
“Now, in addition to having hit our most recent cost goals, we’re much more consistently able to identify when applications are consuming more of the shared cluster resources in advance, and can give timely feedback to their developers before it becomes a problem.”
― Matthew Jackson, DevOps @ Drift