Quick Answer
Cloud TCO (total cost of ownership) is the complete cost of adopting, operating, and maintaining cloud infrastructure over a defined period, usually three to five years. It includes direct costs like compute, storage, and networking, plus indirect costs such as migration, training, security, and engineering time. A useful TCO model answers a harder question than "how much does the cloud cost?" It answers: was it worth it?
What Is Cloud TCO?
Cloud total cost of ownership is the sum of every expense needed to move workloads to the cloud, run them, and keep them running, not just the line items on your AWS or Azure invoice. TCO in cloud computing captures what finance teams actually care about: the full economic picture, mapped to business outcomes.
Traditional IT procurement was straightforward, if painful. You bought servers, depreciated them over five years, and hoped nothing caught fire. Cloud computing replaced that model with something more flexible, and more opaque. Instead of one large capital expenditure, you get thousands of small operational charges that shift month to month based on usage, region, and how many engineers left their dev environments running over a long weekend.
Here is the part that makes TCO matter right now: Gartner forecasts global public cloud spending reached $723.4 billion in 2025, a 21.5% year-over-year increase. At the same time, CloudZero’s survey of 475 senior leaders found organizations waste an average of 35% of that spend on idle, overprovisioned, or unmanaged resources. Even the top quartile of operators saw efficiency drop from 70% to 45% in the same period. FinOps maturity doubled, but the savings did not follow.
That paradox, maturity up, efficiency down, is what CloudZero calls the Critical Recalibration. It means TCO is no longer a budgeting exercise. It is a strategic question about value: for every dollar of cloud spend, how much business value came back?
The organizations getting this right track cloud cost analysis at the unit level, cost per customer, feature, team, product or cost per transaction, — not a single monthly number they hope trends downward.
Report
Finance needs to prove AI’s return: CloudZero report
260 senior finance leaders (more than half CFOs) told us why the speed of seeing AI spend, not the size of it, separates who pulls ahead on AI from who gets burned.
Why Does Cloud TCO Matter More In 2026?
Two forces are reshaping cloud computing total cost of ownership calculations, and both make the old models obsolete. Understanding them is the first step toward a TCO framework that actually reflects reality.
1. AI workloads broke the cost model
GPU instances cost $98.32 per hour on-demand for an 8x NVIDIA H100 configuration on AWS.
A single training run for a large language model can burn through hundreds of thousands of dollars in cloud compute. According to the FinOps Foundation’s State of FinOps 2026 report, 98% of organizations now manage AI spend, up from just 31% in 2024. That is the fastest expansion of FinOps scope ever recorded.
But here is the visibility gap: CloudZero’s billing data shows AI accounts for roughly 2.5% of actual cloud spend, while surveys indicate organizations budget 30–36% of their cloud investment for AI initiatives. The difference is not a rounding error. It means most AI cost is embedded, hiding inside general compute, storage, and data transfer line items where traditional cost tools cannot isolate it.
If your TCO model does not separate AI costs from traditional workloads, your three-year budget will be wrong before year two starts.
2. The scope of TCO expanded beyond cloud
The FinOps Foundation also reports 90% of organizations now manage or plan to manage SaaS spend alongside cloud infrastructure cost. Licensing, private cloud, and data center expenses are being pulled into unified models. What started as “how much is AWS?” has become “how much does our entire technology stack cost to operate, and is it delivering value?”
Cloud Vs. On Premise Cost Comparison
With TCO’s growing complexity established, the next question organizations ask is foundational: is cloud cheaper than on premise? The honest answer depends on utilization, timeframe, and how thoroughly you count everything.
This cloud vs. on premise cost comparison breaks down the categories that matter most.
Cost category | on premise | Cloud |
Upfront investment | High — servers, networking, facility buildout, power, cooling | Low — no capital expenditure, pay-as-you-go |
Ongoing compute | Fixed — hardware depreciates over 3–5 years | Variable — billed per hour or per second based on usage |
Scaling speed | Slow — procurement cycles of weeks to months | Fast — spin up new instances in minutes |
Overprovisioning risk | High — you buy for peak, pay for idle | Moderate — still possible if not actively managed |
Staffing model | Full IT operations team on-site | Reduced ops burden, but cloud engineering skills needed |
Security and compliance | Full ownership, full control | Shared responsibility, you still own your data |
Disaster recovery | Expensive, usually needs a secondary site | Built-in, cross-region replication is a configuration choice |
GPU/AI workloads | More cost-effective at sustained use (12+ months) | More cost-effective for burst and experimental workloads |
Total cost trajectory | Predictable but rigid | Variable but flexible |
Hidden costs | Facilities, power, cooling, hardware refresh cycles | Data egress, cross-region transfer, support tier pricing |
For sustained workloads running 24/7, on premise infrastructure often reaches cost parity within 12 months, per Lenovo’s TCO analysis of AI server configurations. For variable workloads, burst capacity, or teams that want to skip hardware procurement entirely, cloud wins.
Most enterprises land in between. Gartner predicts 90% of organizations will adopt a hybrid approach by 2027, which means the real cloud vs server cost comparison is not an either-or decision. It is a portfolio question: which workloads belong where, and what unit economics prove it?
What Costs Go Into A Cloud TCO Calculation?
The comparison table above shows how cloud and on premise costs differ in category. But a complete cloud TCO model needs to capture costs across four layers, and the mistake most organizations make is stopping at layer one.
1. Infrastructure (the bill you see)
These are the line items on your cloud invoice. Compute is the largest share, covering virtual machines (EC2, Azure VMs, GCE), containers (Kubernetes clusters, ECS, GKE), and serverless functions. An m5.xlarge on AWS costs roughly $0.192/hour on-demand but drops to $0.121/hour with a one-year savings plan, a 37% discount for committing to consistent usage.
Storage costs accumulate quietly. Amazon S3 standard starts at $0.023 per GB/month, which sounds cheap until your data lake hits 500 TB and the monthly bill for parking data nobody touches reaches $11,500. Networking, egress charges ($0.09/GB for the first 10 TB out of AWS), cross-region replication, VPC peering, and NAT gateways, is the cost category cloud providers would prefer you not examine too carefully.
Managed services like RDS, BigQuery, and Snowflake round out this layer. Their pricing models are convenient and opaque. Snowflake bills by credit, BigQuery by bytes scanned. Forecasting these costs takes a deep understanding of your query patterns.
2. Operations (the bill you forget)
Monitoring and observability tools are how you know your cloud is working. At enterprise scale, observability spend alone can reach six figures annually. Security, compliance, audit logging, and support tiers from cloud providers add another layer. AWS Enterprise Support starts at $15,000 per month, the price of having a human answer the phone when production goes down.
3. Migration (the one-time cost that never stays one-time)
Cloud migration cost covers application refactoring, data transfer, testing, dual-running environments during transition, and retraining staff. A survey of 700 engineering leaders found 60% of organizations underestimate ongoing management and optimization costs during migration. The dual-run period, where you pay for both old and new infrastructure simultaneously, consistently costs more and lasts longer than planned.
4. People (the bill nobody counts)
Cloud shifts what engineers do, not how many you need. Instead of racking servers, your team manages infrastructure-as-code, debugs cold starts, and builds cost allocation frameworks. A survey of 700 engineering leaders found 52% say the disconnect between FinOps and development teams leads directly to wasted spend. Only 14.2% of organizations have reached “Run” maturity in the FinOps Foundation’s framework, the stage where cost optimization is continuous and embedded in engineering culture.
Cloud TCO Cost Categories At A Glance
Cost layer | What it covers | % of typical TCO | Most common blind spot |
Infrastructure | Compute, storage, networking, managed services (RDS, Snowflake, BigQuery) | 50–60% | Data egress and cross-region transfer fees |
Operations | Monitoring, security, compliance, support tiers | 15–25% | Observability tool costs that scale with data volume |
Migration | Refactoring, data transfer, dual-running, testing | 5–15% (one-time, often recurring) | Dual-run periods lasting 2–3x longer than planned |
People | Cloud engineering, FinOps, training, on-call | 15–25% | Engineering time spent on cost management instead of building product |
How To Calculate Cloud TCO In 5 Steps
With the cost categories mapped, the next step is building the calculation. Cloud TCO is not a single formula. It is a framework that needs quarterly recalibration, because cloud costs shift faster than most finance models anticipate.
Step 1: Inventory your current environment. Document every workload, its hosting model (on premise, colo, existing cloud), resource needs (CPU, memory, storage, I/O), and actual utilization patterns. If you cannot measure utilization today, you cannot forecast cloud costs accurately.
Step 2: Map workloads to cloud services. Not every application belongs in the cloud. A steady-state database may fit reserved instances. A batch job may fit spot pricing. An inference API may need GPU instances costing 50x a standard node. Match each workload to the right service and pricing tier.
Step 3: Calculate direct cloud costs. Use provider pricing calculators, AWS Pricing Calculator, Azure Pricing Calculator, and Google Cloud Pricing Calculator, as starting points. But treat them as floor estimates: they show list prices, not actual spend after data transfer, support, and scope creep.
Step 4: Layer in operational and people costs. Add monitoring, security, support, and engineering time. A reasonable estimate for operational overhead is 20–30% on top of direct infrastructure, though this varies with maturity and complexity.
Step 5: Build in a waste factor and a plan to reduce it. Assume 30–35% waste in year one if you are new to cloud, that is the industry benchmark. Track progress against it quarterly.
What To Look For In A Cloud TCO Calculator
With the five-step framework in hand, the natural next question is which tools can automate it.
Provider-native tools serve a purpose, but they carry an inherent incentive to make their platform look attractive. AWS retired its standalone cloud TCO calculator and now directs users to Migration Evaluator. Azure offers a TCO Calculator comparing on premise vs. cloud cost equivalents. Google Cloud provides similar estimating tools.
The structural limitation: none of these account for multi-cloud complexity, and none include the operational and people costs that make up 30–40% of real TCO.
Calculator | Multi-cloud | Unit economics | Handles untagged spend | Includes people/ops costs |
AWS Migration Evaluator | AWS only | No | No | No |
Azure TCO Calculator | Azure only | No | No | Partial (estimates some operational) |
Google Cloud Pricing Calculator | GCP only | No | No | No |
Apptio / IBM Turbonomic | Yes | Limited | Partial | Yes |
CloudZero | Yes (AWS, Azure, GCP, K8s, SaaS) | Yes (cost per customer/feature/team) | Yes (code-driven allocation) | Integrates with engineering workflows |
A calculator worth investing in provides four things:
- Multi-cloud visibility, a single view across AWS, Azure, and GCP
- Unit economics, cost per customer, transaction, feature, model or per AI, because total spend is a vanity metric and unit cost is the metric connecting spend to business outcomes
- Allocation without complete tagging, because most organizations never exceed 80% tag compliance
- Tend analysis, because TCO is a trajectory, not a snapshot
How To Reduce Your Cloud TCO
Knowing your total cost of ownership cloud number is half the job. Reducing it, without cutting the services that drive business value, completes the picture. The levers below deliver the highest impact.
1. Rightsize first, commit second
The most expensive mistake in cloud cost optimization is buying reserved instances or savings plans before understanding actual utilization. Start by rightsizing, matching instance types and sizes to real workload needs. Then commit to the reduced baseline. Teams that rightsize before committing save 20–40% more than those that commit first and discover waste later.
2. Automate shutdown of non-production environments
Dev, staging, and test environments running 24/7 but used eight hours a day represent pure waste. Automated scheduling cuts these costs by roughly 65%. This is the cloud equivalent of turning the lights off when you leave the room, obvious, yet almost nobody does it automatically.
3. Adopt unit economics as your cost language
Stop managing cloud cost as a single number. Start tracking cost per customer, cost per transaction, or cost per feature. Unit economics reveals patterns that aggregate metrics hide: is growth efficient, or just expensive? If cost per customer rises faster than revenue per customer, your cloud strategy has a profitability problem, even if total spend looks acceptable as a percentage of revenue.
This is the “was it worth it?” lens that separates strategic FinOps from cost-cutting exercises. CloudZero was built around exactly this principle, connecting every dollar of cloud and AI spend to the business outcome it produced.
4. Get AI cost visibility before the wave hits
Organizations that have navigated cloud cost deliberately are the ones positioned for AI’s next wave. Those waiting are about to be caught by it. The FinOps Foundation reports that most organizations managing AI spend are still in the visibility phase, not yet optimizing. Building cost attribution for AI workloads into your TCO model now is the highest-leverage move available.
How CloudZero Gives You The Full TCO Picture
Traditional cloud TCO calculators produce a number. CloudZero produces the story behind that number, why costs are changing, which teams are driving spend, which products are profitable, and most critically, the answer to “was it worth it?”
CloudZero connects cloud cost to business context through unit economics. Instead of seeing total AWS spend, you see cost per customer, per feature, per deployment, per inference call.
That context transforms “our cloud costs $2 million per month” into “cost per customer dropped 15% while revenue per customer grew 20%, this investment is working.” That is not a cost report. That is a strategic signal.
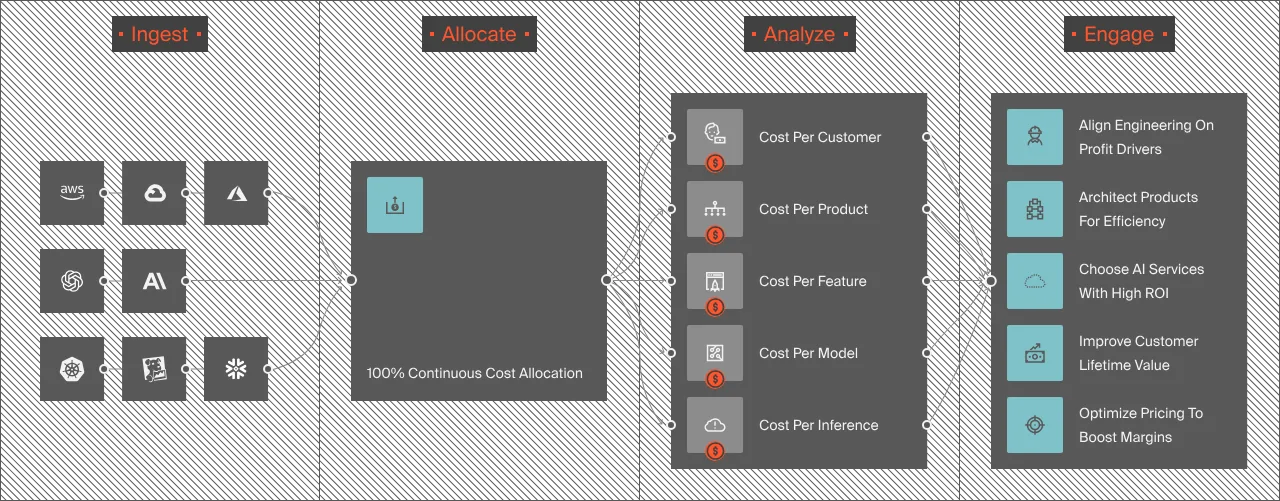
The platform allocates 100% of cloud costs without relying on tags. Most tools break down when tagging is incomplete, and tagging is always incomplete. CloudZero uses machine learning-driven allocation to map every dollar to a cost dimension (team, product, environment, customer) even when tags are missing.
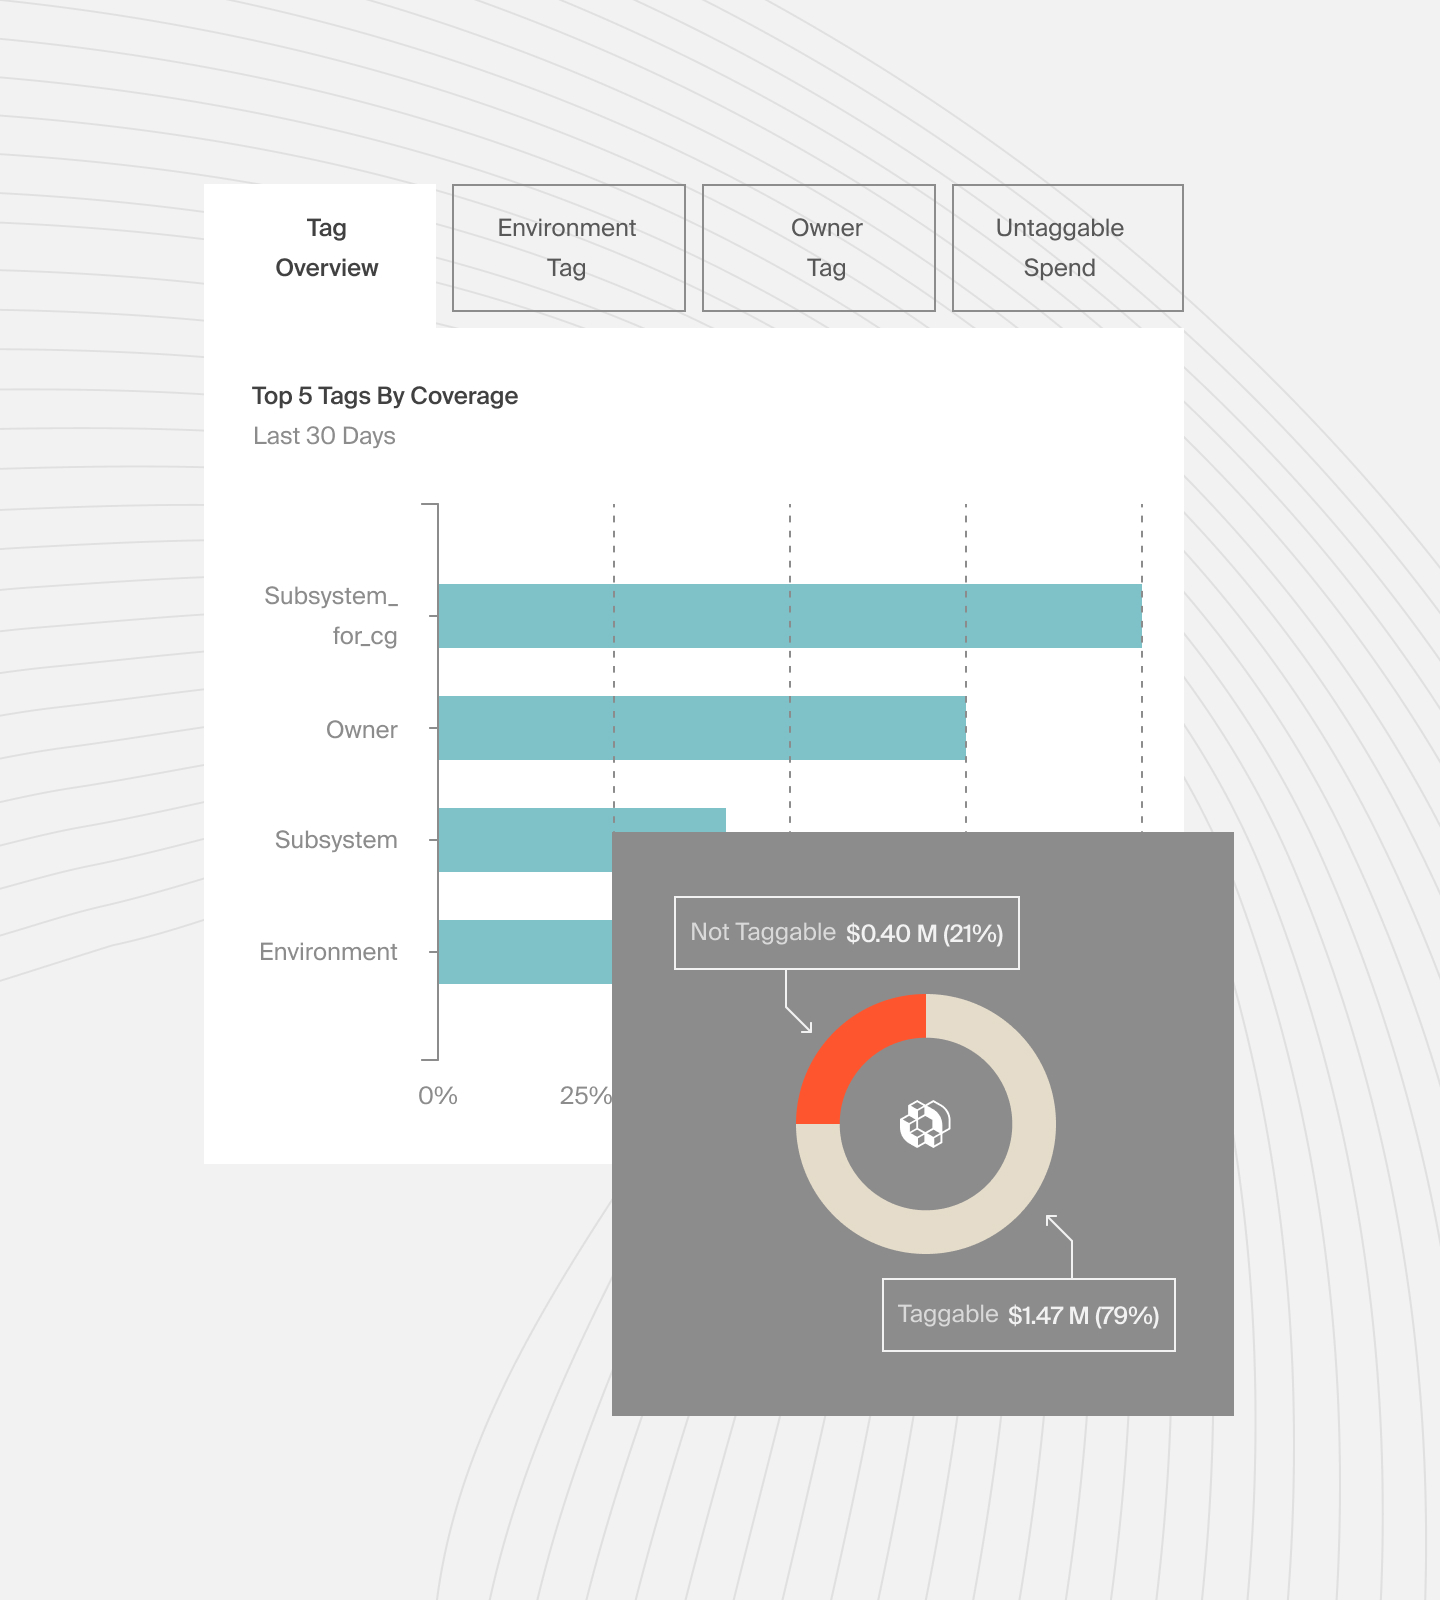
CloudZero’s tagging dashboard
For organizations navigating multi-cloud and AI spend, CloudZero normalizes costs across AWS, Azure, GCP, Kubernetes, Snowflake, Datadog, New Relic, and third-party AI APIs (OpenAI, Anthropic) into a single unified view.
CloudZero customers consistently close the gap between TCO visibility and TCO reduction. Upstart, a leading AI lending platform, saved $20 million by connecting unit-level cost data to engineering decisions. PicPay, one of Brazil’s largest digital payment platforms, saved $18.6 million through CloudZero’s allocation and optimization capabilities. And SonicWall achieved 6x increase in engineering engagement with cost data — turning TCO from a finance report into an engineering workflow.
Acting on it, with unit-level context to know which actions create value, is.  to get unit-level visibility into your total cost of ownership. You can also get a free cloud assessment today to see where you currently stand.
Cloud TCO Frequently Asked Questions