You may have outgrown Amazon CloudWatch. Perhaps you want something more robust than CloudWatch, which provides full-stack observability.
Below, we’ll share a list of the proven, top CloudWath alternatives that can meet all your needs in one place.
What Is CloudWatch?
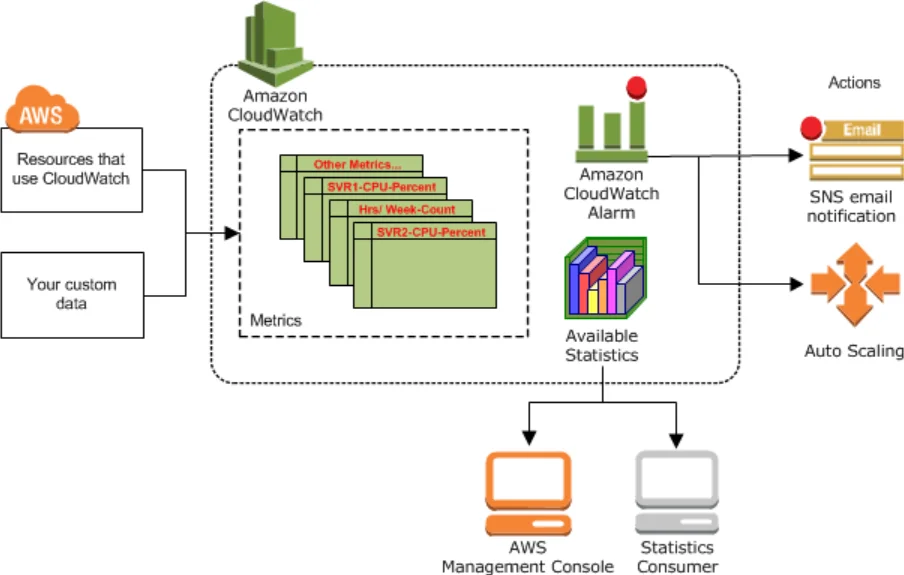
Amazon CloudWatch is a native service for collecting, visualizing, and analyzing operational health and performance data in the Amazon Web Services ecosystem.
CloudWatch provides insight into how you use your applications, services, and infrastructure so that you can improve AWS resource usage.
The real-time monitoring service works across multiple AWS services, on-premises, and on other clouds. The CloudWatch architecture enables this.
CloudWatch was designed for developers, IT managers, DevOps engineers, and site reliability engineers (SREs).
CloudWatch features
Amazon CloudWatch provides:
- Observability and monitoring across AWS services (cross-account monitoring) and on-premises
- Monitoring across clouds (hybrid cloud monitoring)
- End-to-end application monitoring
- Infrastructure monitoring
- Metrics, events, traces, and log management
- Automated anomaly detection and alarms (alerts)
- Synthetics monitoring
- Real user monitoring (RUM)
- Container monitoring
- Network and service monitoring
- Time-series data analysis
- Identity and Access Management (IAM security)
Yet, CloudWatch is not flawless, and you may be considering the best CloudWatch competitors for a couple of reasons.
Why would you want to consider Amazon CloudWatch alternatives?
Some of those top reasons to consider alternatives to CloudWatch include:
- CloudWatch limits you to a 15-month data retention period
- It is designed for best usage in the AWS IaaS platform – not as an easier-to-manage SaaS product
- CloudWatch pricing can be higher than that of third-party AWS monitoring services – and estimating its cost can be daunting
- Memory usage metrics are not available by default. To monitor this basic indicator, you need to configure a custom metric
- CloudWatch is not designed for multi-cloud monitoring, such as Google Cloud with Oracle Cloud monitoring, and across private clouds
- The CloudWatch Agent installed on your servers tends to collect too many metrics at a go, making it resource-intensive
- Query limits. Examples include limiting a single query to process up to 10,000 metrics and just 500-time series, and the inability to support more than 75 Metrics Insights alarms per Region
- Also, you may want deeper insight into your AWS cloud environment, especially accurately mapping cloud resource usage to your cloud cost management by the hour
If you are concerned about CloudWatch’s limitations, you’ll want to consider the following alternatives. But here are some factors you’ll want to consider first.
Research Report
FinOps In The AI Era: A Critical Recalibration
What 475 executives told us about AI and cloud efficiency.
What To Look For In A CloudWatch Alternative (Evaluation Criteria)
- Full-stack observability – Instead of using separate tools, that can introduce visibility blind spots, select an alternative to CloudWatch that delivers a single source of truth.
- Robust application performance management – CloudWatch offers good APM support, which means your options should match (and, ideally, go beyond basic APM).
- Reliable log monitoring and management – Select an alternative that can help you log context-rich data about your activities for robust root cause analysis and faster mean time to restore (MTTR).
- Multi-cloud observability – CloudWatch may be sufficient for an on-premises-AWS combo. But if you have a hybrid cloud or multi-cloud environment, pick an option that offers exactly that.
- Compatibility with CloudWatch: You’ll still want a CloudWatch alternative that plays well with the AWS monitoring platform (and other AWS monitoring solutions, such as CloudTrail).
Top 15 CloudWatch Alternatives For AWS Observability
There are various options available, including cloud cost optimization platforms and all-in-one observability platforms for AWS and other cloud providers.
CloudZero
CloudZero is a complete cloud cost optimization platform for organizations of all sizes. Unlike conventional cost tools, which are often inexact and clunky, CloudZero delivers accurate, granular, and immediately actionable cloud cost insights on demand.
CloudZero features
- Per-unit cost – View both summaries, such as total or average cost, and unit costs insights, such as Cost per Customer, per feature, per team, per project, per environment, per service, and custom metrics.
- Seamless integration – Delivers real-time cost data seamlessly with CloudWatch and AWS Cost Explorer.
- No tagging required – CloudZero enables you to view the costs of your tagged, untagged, and untaggable resources even if you have less-than-perfect tags.
- Always audit-ready – Allocates 100% of your cloud costs in minutes or a few hours, even if you have a complex cloud environment.
- Multi-cloud observability – Monitors cloud costs (AWS, Azure, GCP, Oracle Cloud) and platform cost information (Kubernetes, Snowflake, Datadog, MongoDB, New Relic, Databricks, and more) in a single, interactive dashboard. No need for separate views.
- Budgeting and forecasting – create a custom budget and get accurate data to predict future costs so you can be prepared.
- Real-time cost anomaly detection – Get timely, noise-free, and context-rich anomaly alerts right in your inbox to prevent surprise costs.
CloudZero pricing is a simplified, tier-based pricing model that won’t be unpredictable month-to-month.
Want to see CloudZero in action yourself (and why companies like Remitly, MalwareBytes, and Obsidian use CloudZero)?  and see why.
AppDynamics
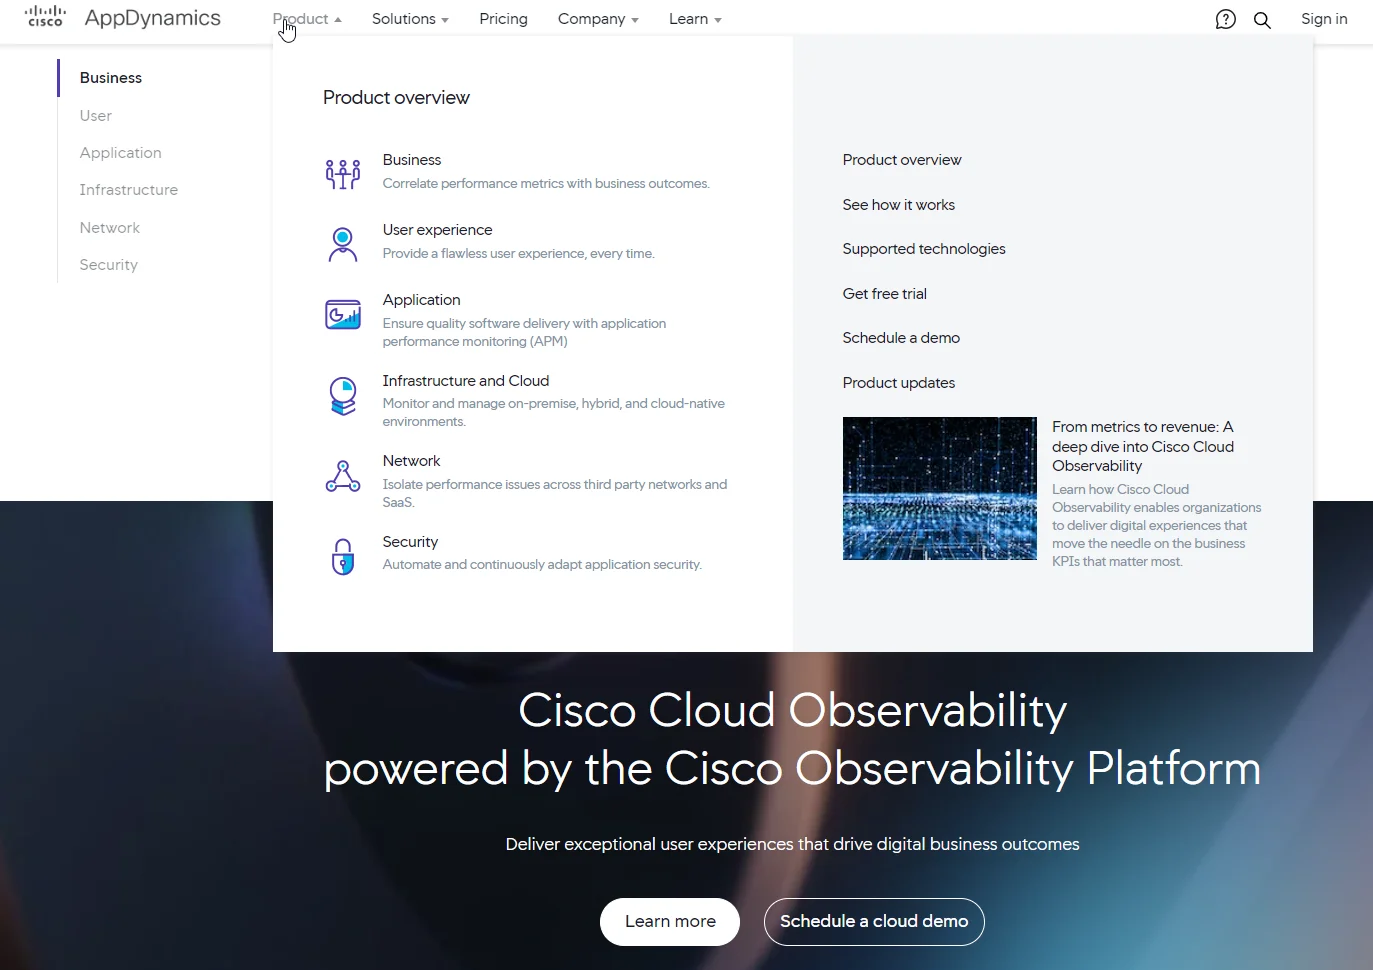
Cisco’s AppDynamics is a top alternative to CloudWatch for application performance monitoring (APM). Yet AppDynamics is more of a full-stack observability platform than an APM tool only. Here’s what we mean.
AppDynamics features
- Full-stack monitoring platform – AppDynamics covers most monitoring needs today, including APM, infrastructure, end-user, network, server, synthetic, and more.
- Agent-based platform – Like CloudWatch, AppDynamics uses an agent and controller for data collection.
- Automated code diagnostics – This not only reduces manual intervention but also enables faster code analysis so you can take the right action sooner.
- Flow map visualizations – These mappings help end-users perform relevant analytics to identify bottlenecks and performance issues.
- Application mapping – You can use this feature to analyze root causes, enabling you to identify issues faster and fix them before they become serious.
- AI-driven anomaly detection engine – By using Machine Learning and predictive analytics, it detects abnormal system patterns and instantly alerts you to potential problems.
- Automatic discovery – AppDynamics provides faster visibility into your IT assets by automatically tracing and mapping out your services and infrastructure components.
- Automated alerting system – It sends real-time alerts to stakeholders when issues arise, enabling them to take immediate action.
Pricing for AppDynamics depends on the service you choose. Various options are available, from Infrastructure Monitoring Edition for $6 per CPU core to Cisco Secure Application Edition for $13.75 per CPU core.
Azure Monitor
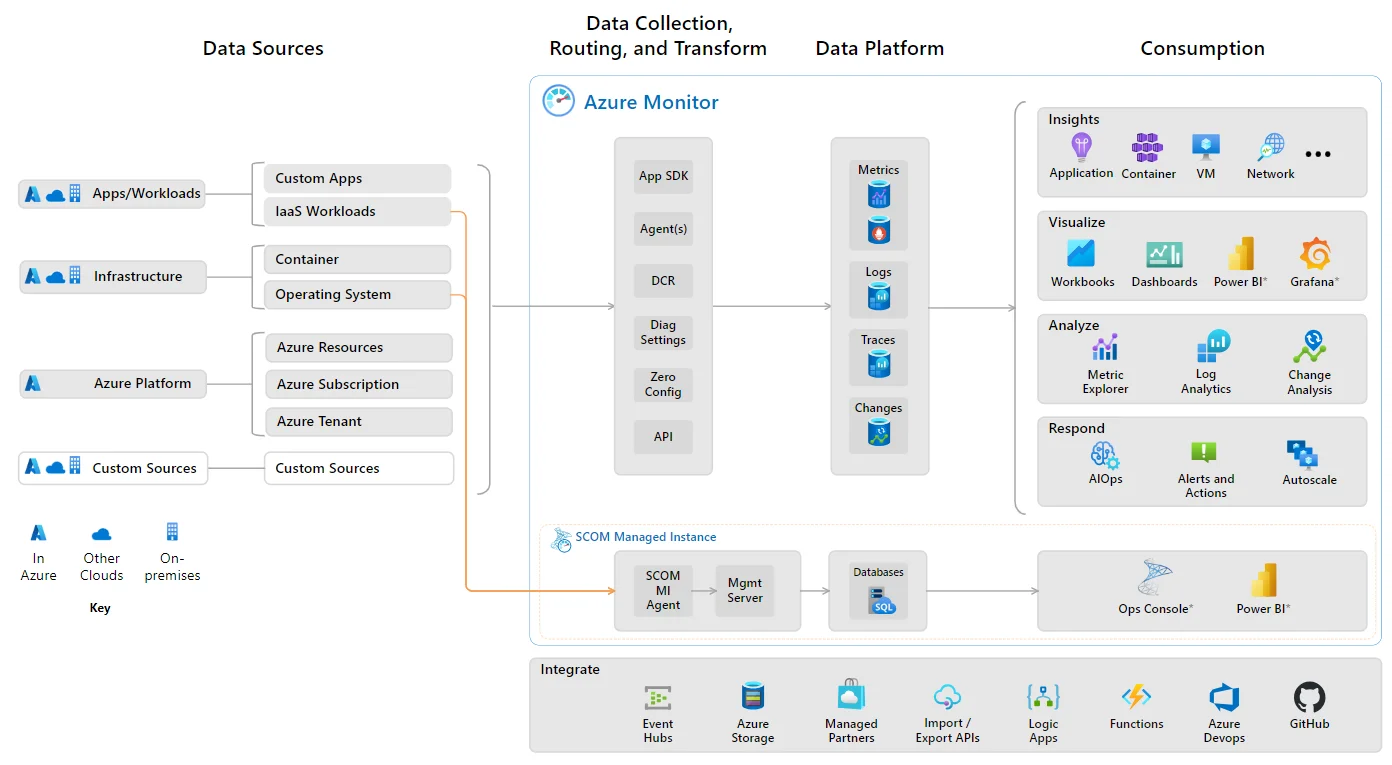
Azure Monitor is a native monitoring tool within the Microsoft Azure cloud platform, similar to CloudWatch in AWS. And, like CloudWatch, Azure Monitor provides monitoring for AWS and other custom data sources, on-premises data centers, and across many Azure services by default.
Azure Monitor features
- Multi-cloud monitoring platform – Monitor IT resources in the Azure cloud, non-Azure subscriptions and tenants, other clouds such as AWS, and on-premises.
- Comprehensive monitoring support – Collect, analyze, and act on monitoring data from your infrastructure, network, applications, containerized workloads, and more monitoring areas.
- Virtual machine and database monitoring – Gain insights into how your databases and VMs are performing whether they are in the cloud or in a local data center.
- Azure Sentinel – Gain a centralized view of your security posture and prevent unauthorized access with Identity and Access Management (IAM).
- Open-source architecture – Get seamless and broad integration with other open-source or proprietary monitoring tools whenever you choose.
Pricing for Azure Monitor is pay-as-you-go, so you only pay for what you use — and based on the services you consume. For example, retention, alerting, and ingestion are each priced separately.
Dynatrace
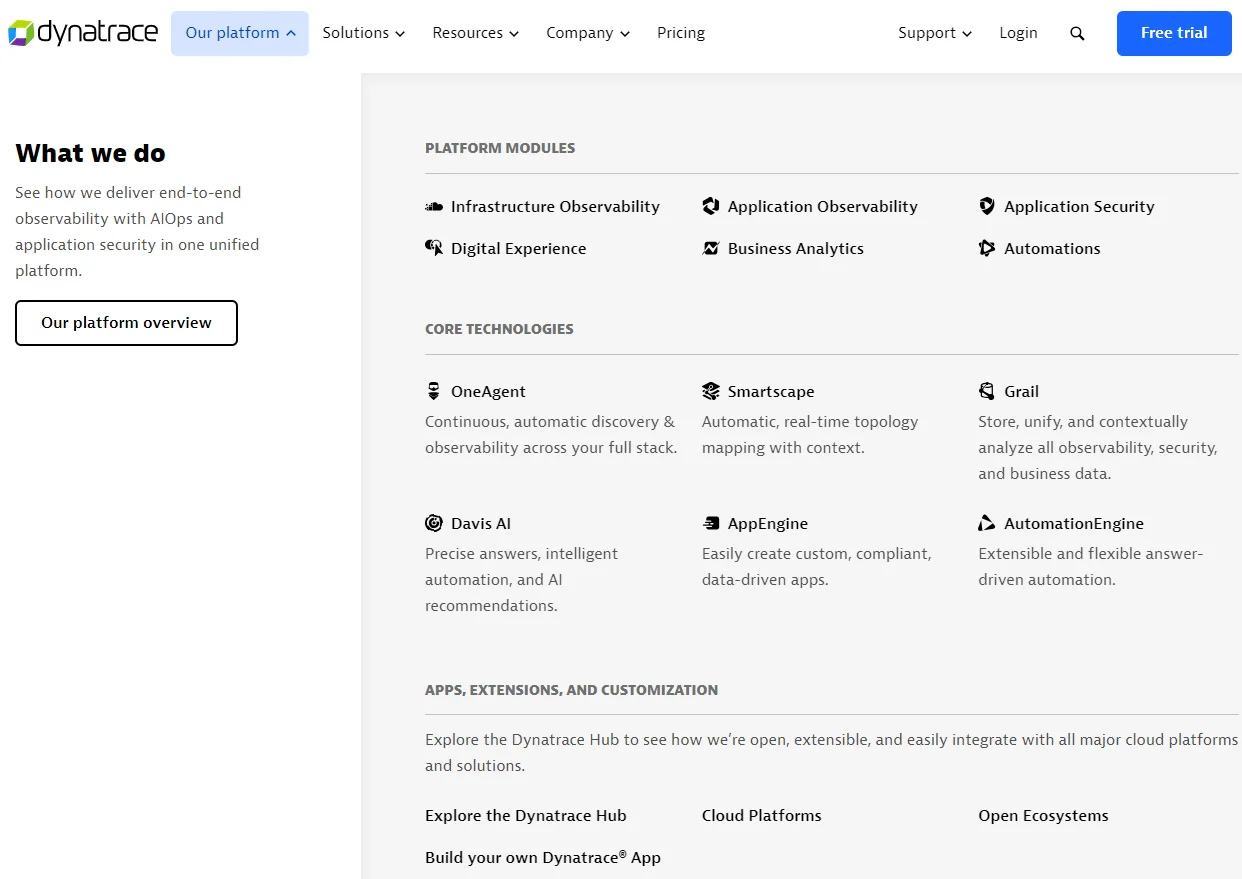
Dynatrace is one of the most comprehensive CloudWatch alternatives today, especially if you are looking for a hybrid cloud or multi-cloud observability platform. Dynatrace has some noteworthy features.
Dynatrace features
- APM – Dynatrace delivers more thorough application performance monitoring at scale compared to CloudWatch.
- Business analytics – Track, analyze, and act on business processes, KPIs, and events in real-time to prevent customer service disasters.
- Security monitoring – Dynatrace helps you increase visibility into the security of your application by combining runtime app protection and AI/ML with DevSecOps automation.
- Digital experience monitoring – Combine a causational data lakehouse with real user monitoring (RUM) to improve their experiences across your mobile, website, and IoT platforms.
- SmartScape – This is Dynatrace’s topology mapping feature, providing automated, real-time, and contextual insights.
Besides host unit pricing, Dynatrace has its custom currency, the Davis data units (DDU).
Datadog
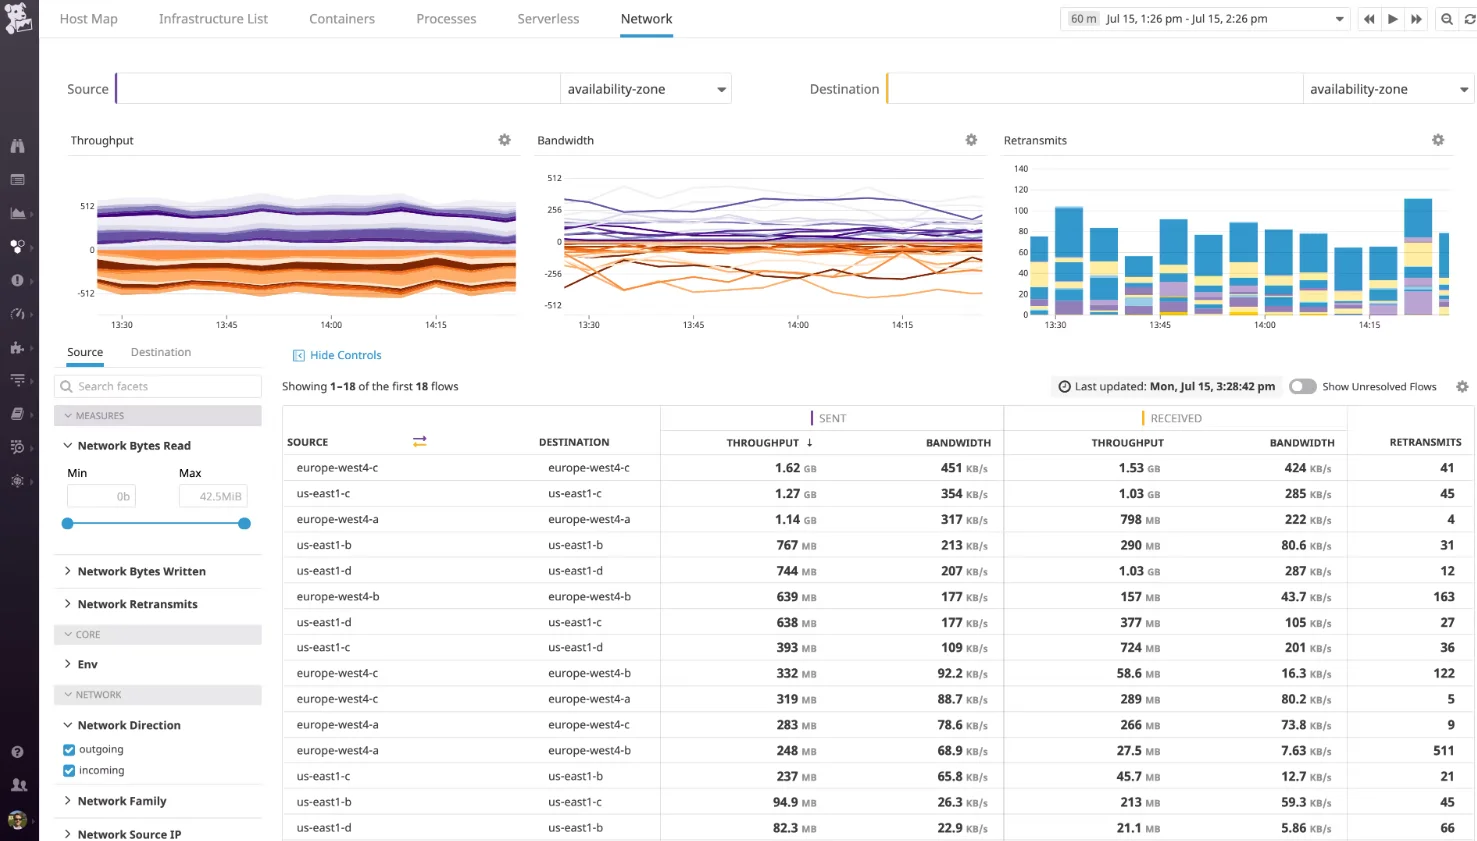
Datadog is a full-stack alternative to CloudWatch, a Cloud monitoring as a Service platform. It offers a diverse range of observability and monitoring capabilities, from infrastructure to real users to multi-cloud monitoring.
Datadog features
- Full-stack observability – Datadog provides visibility into virtually any tech stack and app at any scale, anywhere.
- Interactive dashboards – You can view real-time, high-resolution graphs of metrics and events across sources, easily customize the view (in code or interactively), and share the intel with your stakeholders.
- Automated alerting – Get timely alerts about issues right in your email, Slack, ServiceNow, PagerDuty, etc, whether it is inside a single host or a cluster.
- Full API access – You can get full data access with Datadog’s RESTFUL HTTP API
However, Datadog pricing can be complicated and expensive at scale. We’ve shared that and a list of the best 15 Datadog alternatives here.
GitLab
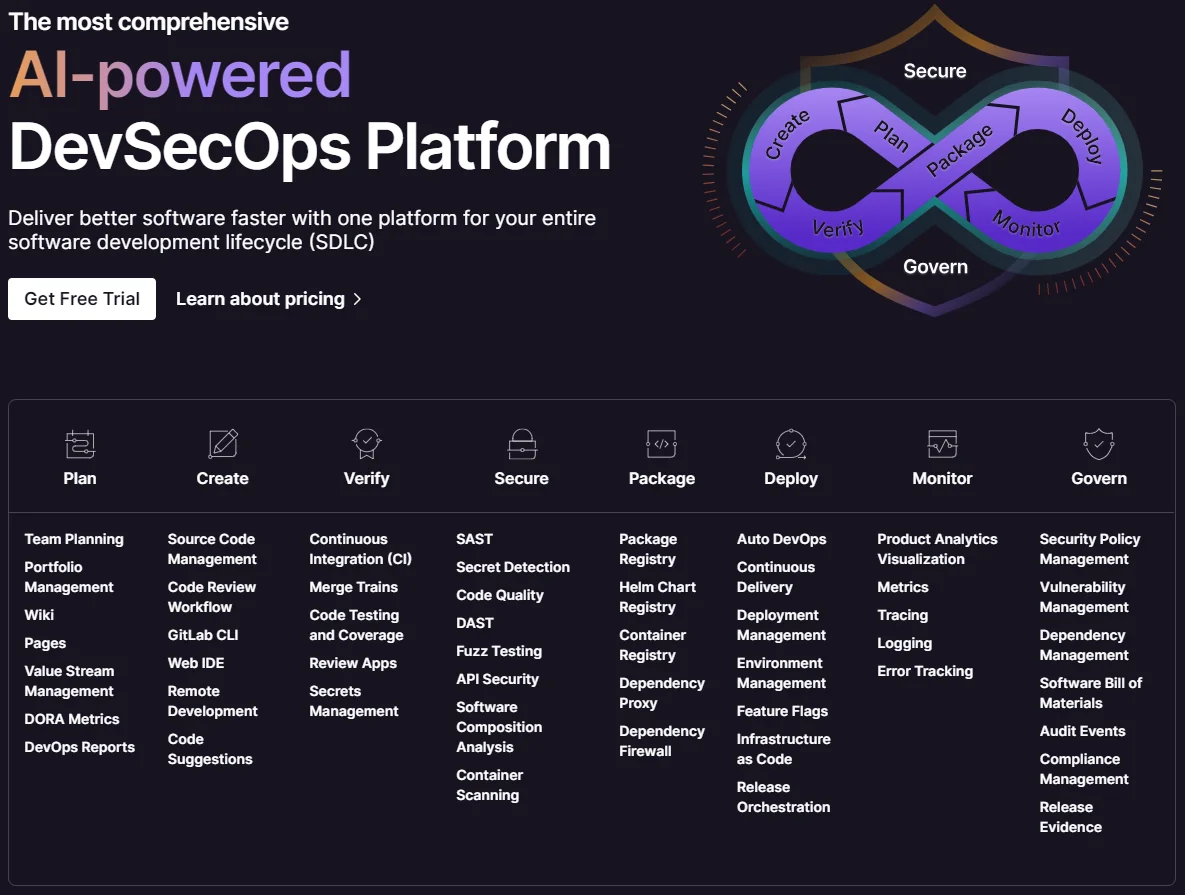
GitLab is a comprehensive software development platform for DevSecOps teams. And, like ClloudWatch for AWS, GitLab also has a suite of monitoring tools to help you track the health of your code throughout its software development lifecycle.
GitLab features
- GitLab Performance Monitoring – GitLab integrates with the open-source, time-series monitoring service, Prometheus, to deliver this intel right within GitLab.
- Supports metrics, traces, events, and logs – Collect and display performance metrics, trace requests, view logs distributed across multiple services, and more.
- Error tracking – GitLab pairs with Sentry to gather app errors and surfaces them in the GitLab UI so you can sort and filter them to identify critical errors.
- Incident management – Define and track incidents, error budgets, and service-level objectives in one place.
GitLab monitoring tools vary in price depending on whether you use GitLab.com, Self-managed, or Dedicated editions, and what plan you choose, such as $29/user/month for Premium.
IBM Instana Observability
Instana Observability is IBM’s native monitoring platform with enterprise-scale capabilities. But like CloudWatch, you can use it to monitor your on-premises assets and services running in other clouds, such as AWS, GCP, and Azure.
IBM Instana Observability features
- Digital experience monitoring – Instana helps monitor apps, mobile, and web use cases in real-time with end-to-end transaction tracing.
- Infrastructure monitoring – Like CloudWatch, Instana observes and reports on most infrastructure components’ health and performance metrics in the cloud, on-premises, and serverless.
- Hybrid cloud monitoring – Instana monitors IT assets across the IBM Cloud, AWS, Azure, Google Cloud, and more.
- Open standards – The platform supports many open-source projects for monitoring, from Prometheus to Grafana to cAdvisor.
- Real-time application performance monitoring – Track all production applications across all environments and clouds.
Pricing for IBM Instana Observability is based on a flat-rate model for both infrastructure and applications monitoring.
Logz.io
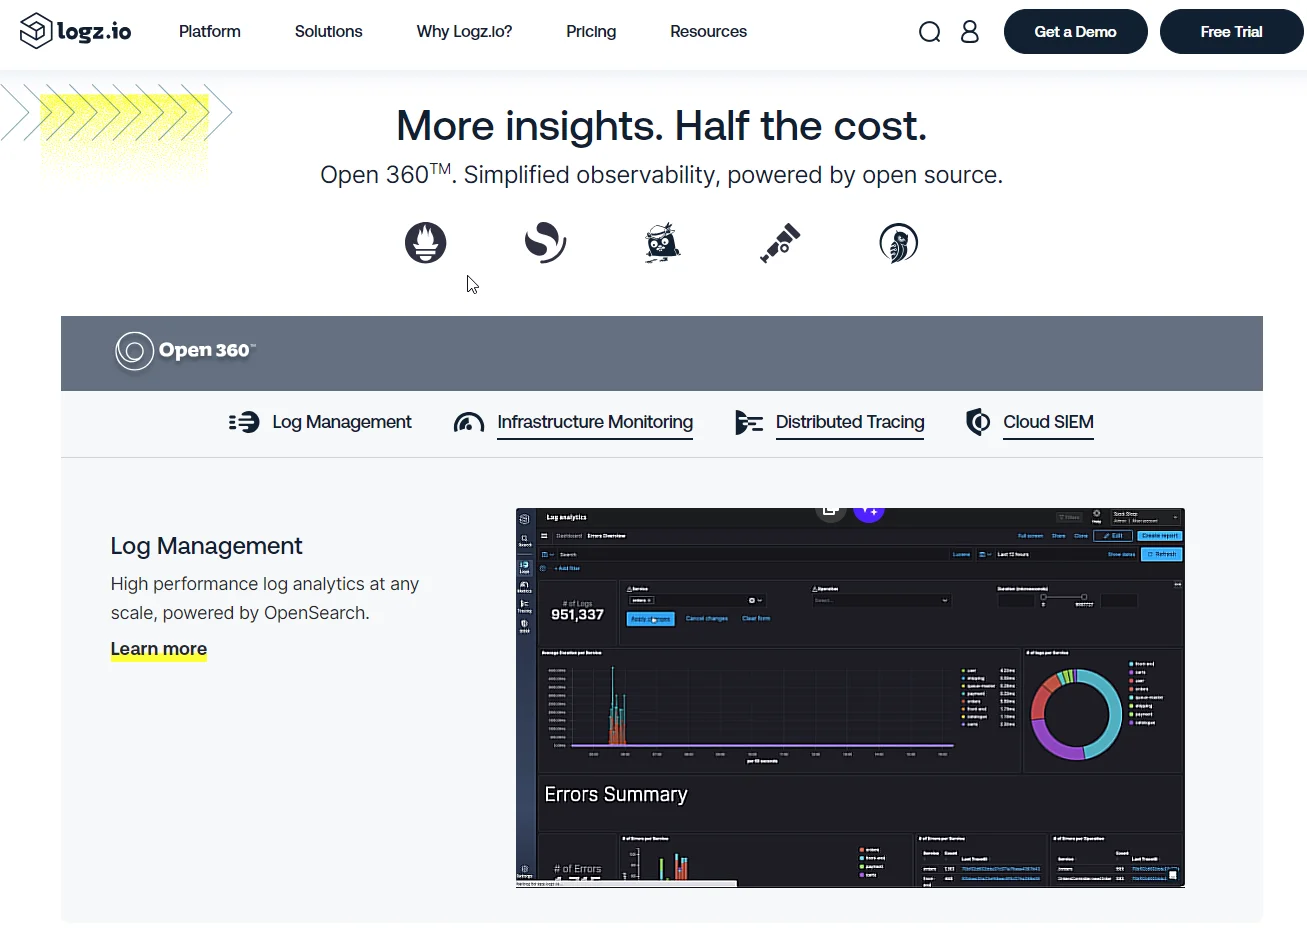
Logz.io is first and foremost a cloud-based log analysis solution. Yet, Logz is built on open source, integrating several projects into a single platform for diverse monitoring capabilities.
Logz features
- Log management – It leverages OpenSearch to provide a highly scalable log analysis platform.
- Cloud SIEM – By centralizing and investigating all security events, you can determine vulnerabilities, and their root causes, and resolve them.
- Infrastructure monitoring – This feature is powered by Prometheus in Logz.io.
- Distributed tracing – Powered by Jaeger, this function enables you to view your requests across microservices.
Logz pricing is based on the volume of data you ingest. For example, log management starts at $0.92 per GB per day with 7 days retention while infrastructure monitoring starts at $0.40 per 1,000 time series metrics and 18-month retention.
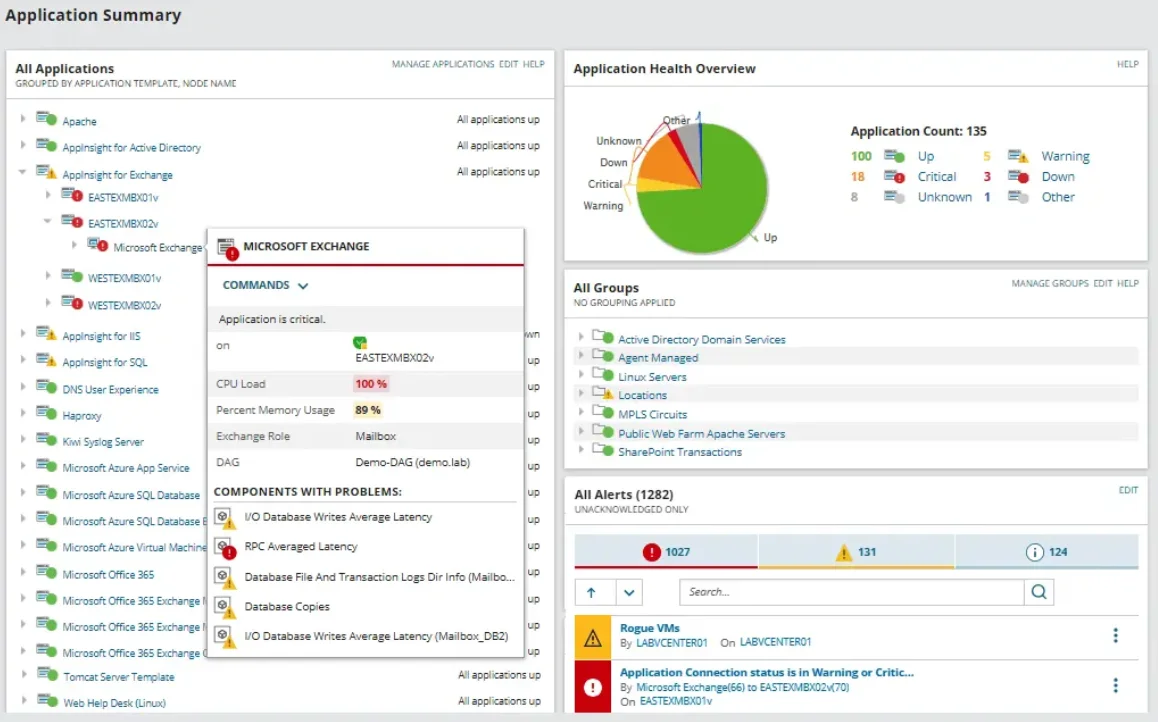
ManageEngine Applications Manager
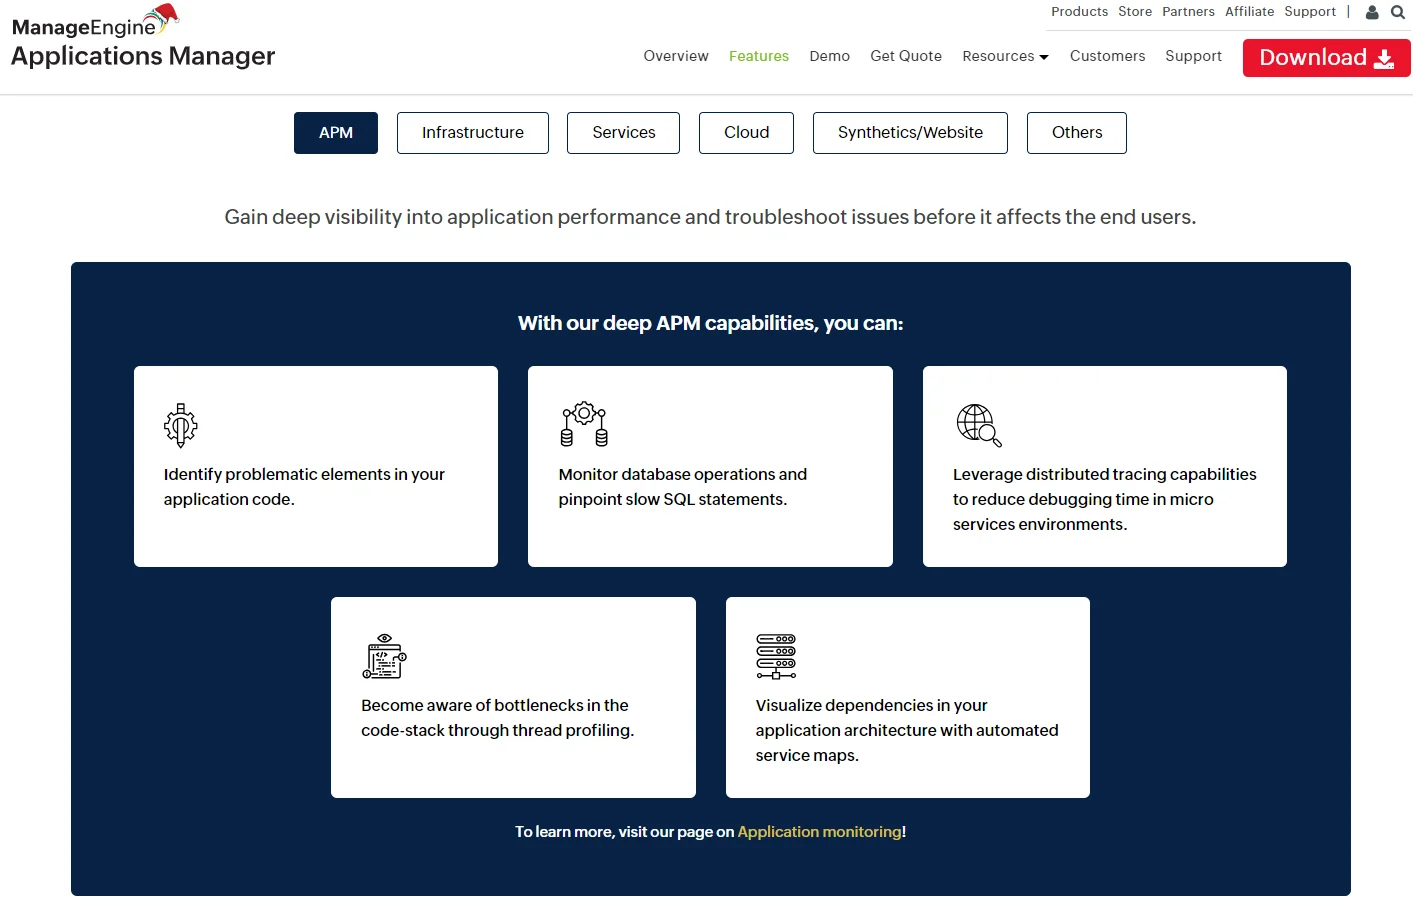
Applications Manager provides an enterprise-grade observability platform that extends beyond CloudWatch’s scope. It also works in the cloud and across on-premises infrastructure, including ERP products such as SAP Server and Oracle E-Business Suite.
ManageEngine Applications Manager features
- Agentless monitoring – The platform doesn’t require you to install it on your servers, like CloudWatch, which can reduce resource consumption.
- Root cause analysis – Despite its broad offering, the platform enables engineers to surface data that leads to resolving issues at the source.
- Comprehensive APM – Not only does ManageEngine offer robust APM, but it also includes other management capabilities, such as security, analytics, auto-discovery, and dependency mapping management.
- Business service management – This refers to grouping applications logically based on geography or business services. You can pinpoint the root cause of problematic business services in one place.
Pricing for ManageEngine Applications Manager is based on the specific monitoring service you use (e.g. Real User Monitoring) and the plans you pick (subscription, perpetual, or custom quote).
Netdata Cloud
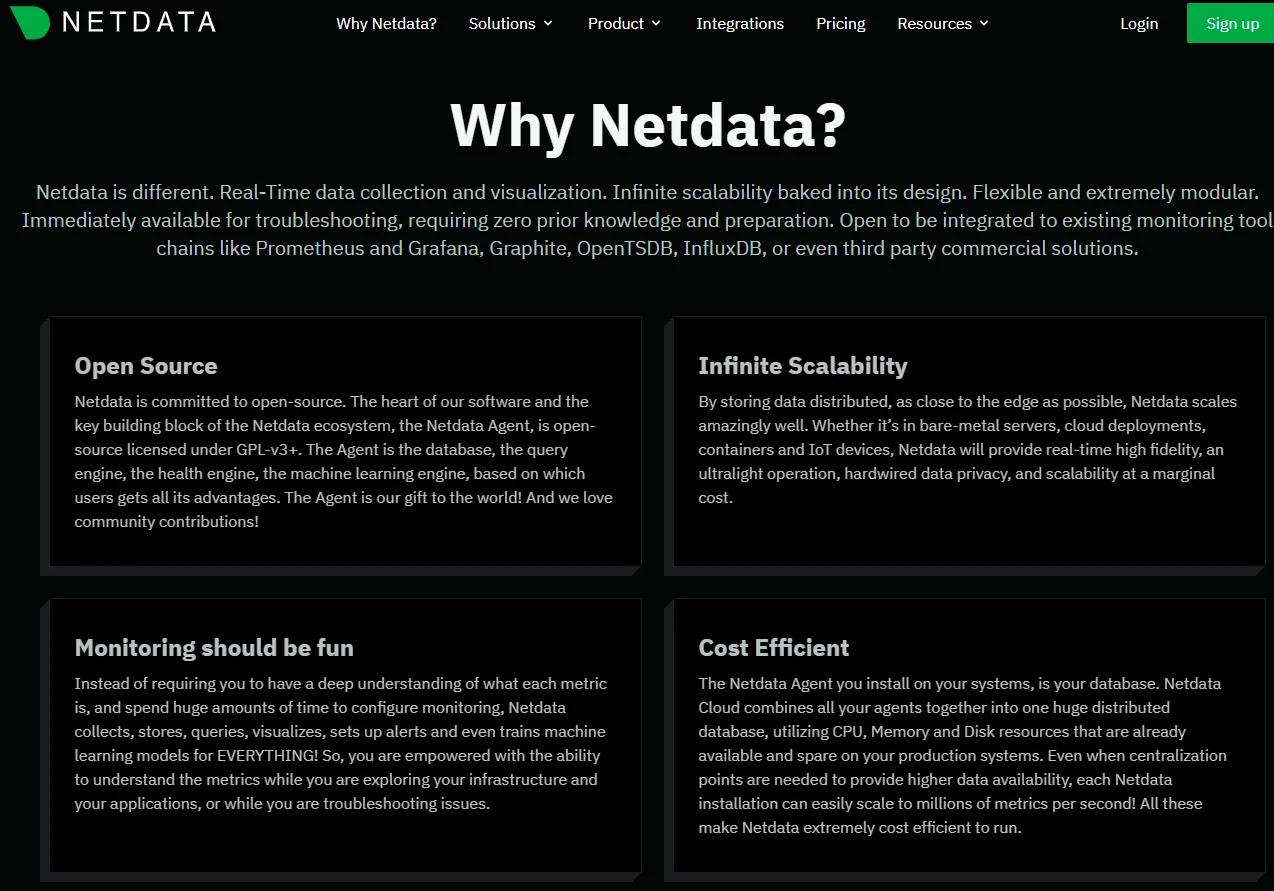
Netdata Cloud is an open-source platform for collecting and visualizing metrics in real time. The solution is powerful yet easy to use, and it integrates with hundreds of other solutions for observability and monitoring.
Netdata Cloud features
- Low monitoring latency – Like CloudWatch, NetData provides 1-second granularity. However, it offers 1-second latency vs 2-10 minutes CloudWatch latency.
- Highly scalable agent – Unlike CloudWatch’s agent, Netdata Agent requires fewer resources to run on your servers without sacrificing scalability.
- Fully automated dashboard – You can use the automated, meaningful dash or build a custom one.
In terms of pricing, NetData’s Community and Agent OSS editions are free while pricing for Enterprise On-premise and Business editions starts at $3 per node per month (billed annually).
New Relic
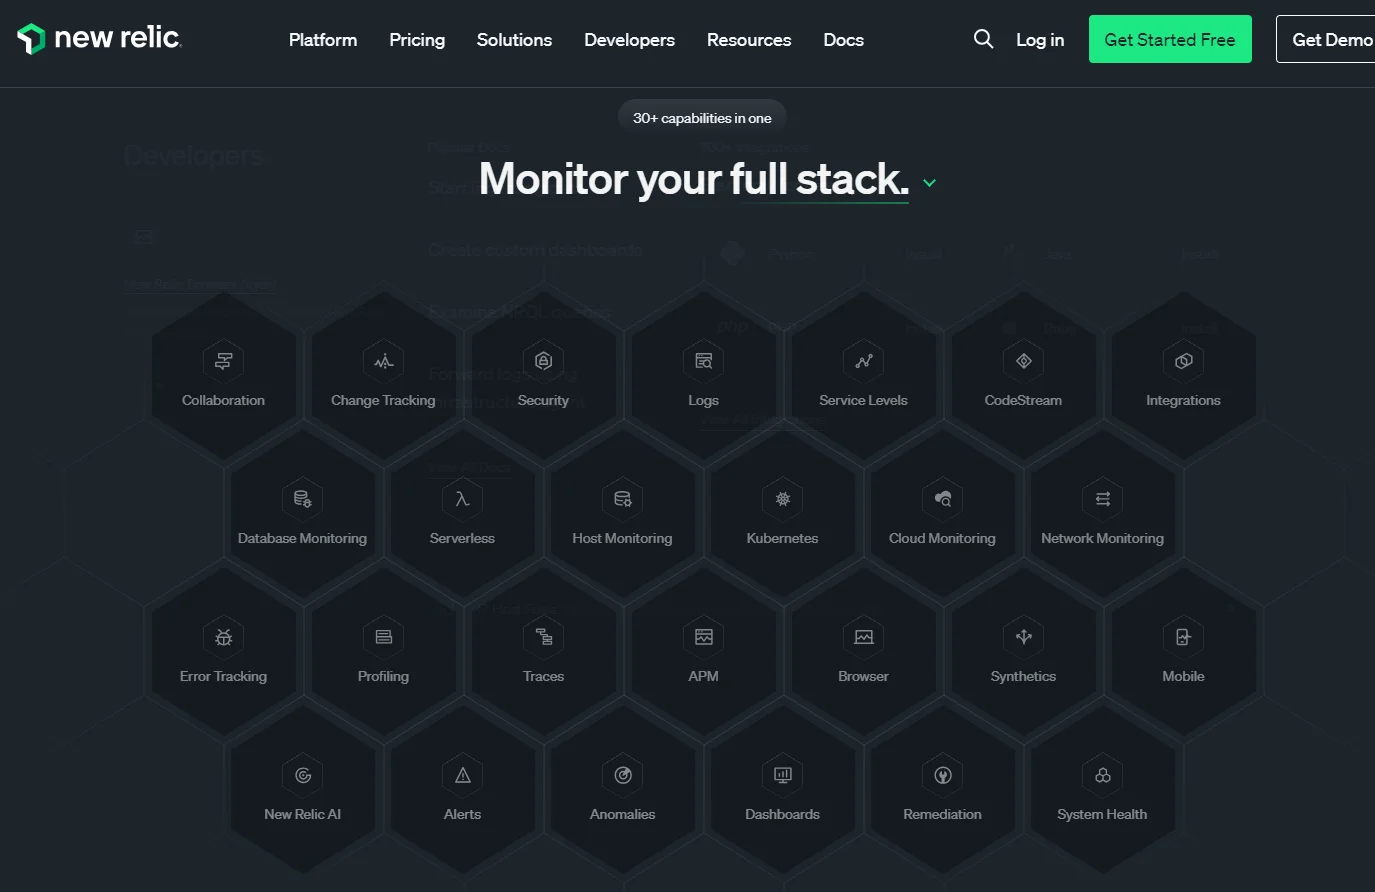
New Relic is a modern, comprehensive observability platform with a ton of features. So, if you’ve outgrown CloudWatch, New Relic may be one of the top alternatives to consider today.
New Relic features
- Full-stack monitoring – New Relic, like Datadog and Sematext, offers deep monitoring data for any stack, at any scale, cloud, and on-premise environment.
- Native-level integration with AWS, Azure, and GCP – It works great across the major cloud providers as well as custom data sources (metrics, traces, events, and logs).
- Profiling – The APM Thread profiler enables you to surface app bottlenecks in production.
- Error tracking – Have a single place to track and triage errors across your stack.
- Robust log monitoring and management – Expect a fast and context-rich log analysis solution.
New Relic pricing is based on usage. The number of users and data transferred also affect billing. A variety of plans are also available (basic vs core vs full platform).
Sematext
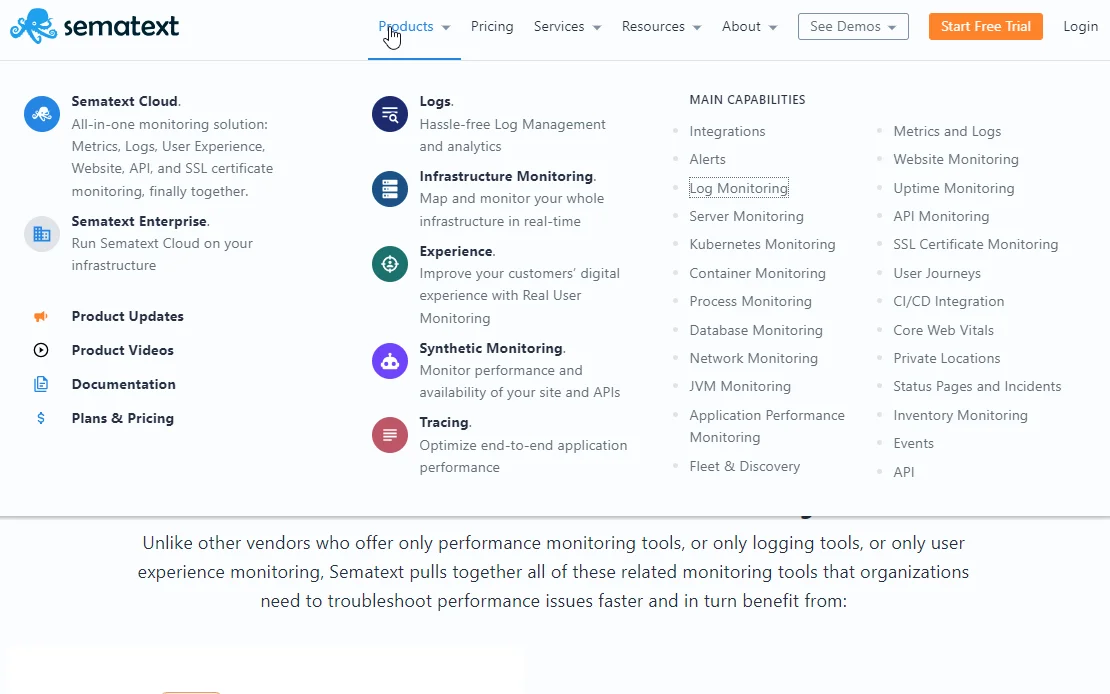
Like New Relic and Datadog, Sematext is one of the most comprehensive observability platforms today. Yet, it installs in about 10 minutes, is highly extensible, and has a 30-day free trial.
Sematext features
- Full-stack observability – Sematext enables you to see inside any infrastructure, application, and other stack components with logs, metrics, real-user, and synthetic monitoring.
- Unified container monitoring -You get a detailed view of your Kubernetes and Docker metrics, events, and logs in one place.
- Robust log management – Expect centralized, real-time, and context-rich log management for multiple log sources.
- Fully managed Elasticsearch and Kibana – It is also auto-scaled, optimized for logs, and integrated with Kibana to save you time and manual labor.
Sematext is also more affordable than full-stack observability alternatives such as Datadog. However, pricing for Sematext monitoring is based on the tools you use.
Splunk Observability
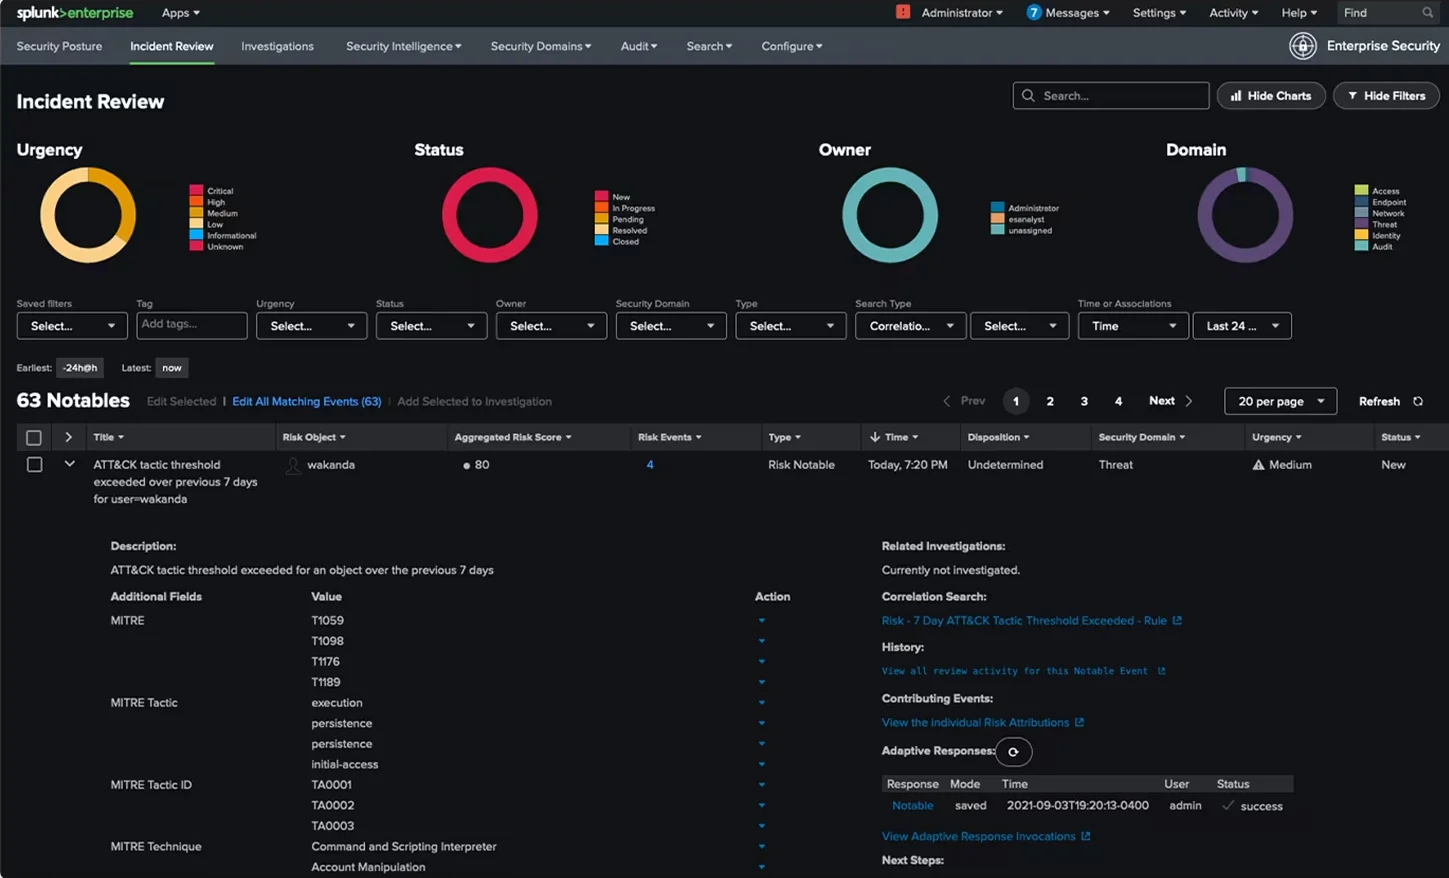
Like CloudWatch, Splunk Observability delivers real-time, AI-powered application performance monitoring. However, Splunk goes beyond that by offering high-resolution business intelligence, CI-CD, and IoT observability solutions in a single platform.
Splunk Observability features
- Full-stack monitoring service – Not only does Splunk provide monitoring for multiple data sources and devices, but it also supports on-premise, in-cloud, and hybrid deployments.
- OpenTelemetry native platform – This means you can integrate Splunk Observability with your existing stack without introducing significant compatibility issues.
- IT Service Intelligence – Splunk’s platform enables you to build custom apps as well as monitor their health with custom KPIs and metrics at the service level.
- Real user monitoring – Splunk delivers robust RUM alongside infrastructure, APM, and synthetic monitoring.
Observability pricing for Splunk starts at $15 per host per month (billed annually) for infrastructure monitoring. The Application and Infrastructure monitoring plan costs $60 per host per month (billed annually). The end-to-end option is $75 per host per month (also billed annually).
SolarWinds Server and Application Monitor
SolarWinds SAM provides deep monitoring for both commercial and custom applications. It is a highly scalable, high-performance observability solution for enterprises – if you want a more powerful tool than Amazon’s CloudWatch for AWS and Azure monitoring.
SolarWinds SAM monitoring features
- End-to-end monitoring – The platform offers robust monitoring for AWS, Rackspace, and Azure IT assets in the cloud and on-premises (Windows, Linux, UNIX, AIX).
- Server capacity planning – Monitor resource usage and generate capacity forecast charts to support capacity planning.
- Dependency mapping – It supports both infrastructure and application dependency mapping.
- Virtual server monitoring – Track and fix the health of your assets running on Hyper-V and VMware hypervisors.
SolarWinds offers various pricing options; subscription licensing (starts at $1,813), perpetual licensing (starts at $3,346), and custom quote.
Zabbix
Similar to Netdata Cloud, Zabbix is also an enterprise-scale, open-source monitoring solution, and an alternative to Amazon CloudWatch. Some of Zabbix’s highlight features include.
Zabbix features
- Open-source – If you want to leave CloudWatch’s proprietary platform, Zabbix offers an all-in-one solution for that.
- Network monitoring – Zabbix is well-known for its robust network monitoring on-premise or in the cloud. To support both modern and legacy network devices, it includes support for SNMP versions v1, v2c, and v3, and SNMP trap collection.
- Observe and monitor anything – Besides network monitoring, you can also use Zabbix to monitor your containerized assets, apps, server hardware, and services.
- Agent-less monitoring – Expect to use any protocols for remote monitoring, including ODBC, IPMI, SSH/Telnet checks, ICMP and TCP checks, etc.
Zabbix is free and backed up by over 250 global partners to keep it up-to-date, powerful, and secure.
How To Truly Understand, Control, And Optimize Your Cloud Costs Today (Including Data And Monitoring Costs)
With these 15 CloudWatch alternatives, you can get full visibility into your entire stack, whether it is in the cloud or on-premises.
By performing a root cause analysis, you can determine what areas can impact your customers’ experience, system performance, and cloud costs.
Now, if you, like most organizations today, are looking to understand, reduce, and optimize your cloud costs, CloudZero can help.
Yes, CloudZero empowers you to check your monitoring costs, including on Datadog, New Relic, CloudWatch, and others.
Unlike conventional cost management tools, CloudZero provides accurate and immediate actionable cost intelligence. For example, CloudZero helps you:
- View and interact with your cloud costs per unit; Cost per Customer, per feature, per team, per service, per environment, and more (not just total and average costs like most tools, which is an incomplete approach).
- Take advantage of real-time cloud cost monitoring. CloudZero works like an observability platform to get you the complete cost picture, preventing surprise costs.
- Kubernetes cost analysis and reporting. CloudZero offers industry-leading Kubernetes cost analysis and reporting. Get K8s insights such as cost per pod, per node, or cluster alongside business concepts such as cost per environment, per team, per service, etc.
- Hourly granularity. CloudZero provides hourly cost reports instead of once per 24 hours, enabling you to resolve issues before they become budget overruns.
- Engineering-Led Optimization. Empower your engineers with the intelligence they need to prevent overspending at the architectural level and build cost-effective solutions from the start. That includes Cost per deployment, per environment, per service, and more.
Drift has saved over $4 million already and Symphony Talent reduced its AWS costs by 48% with CloudZero. MalwareBytes and Remitly now save 6-10 hours weekly managing cloud costs with CloudZero. You can, too.
to experience CloudZero firsthand.


FinOps In The AI Era: A Critical Recalibration
What 475 executives told us about AI and cloud efficiency.