A major problem led Amazon to introduce Cost Explorer and Cost and Usage Reports. Many Amazon Web Services (AWS) users were overspending on services they couldn’t quite identify.
Before the two cloud financial management tools, the AWS public cloud was like a buffet menu without prices. Engineers could use as many cloud resources as possible (and then some), only to be hit with surprise bills at the end of the month or billing cycle.
Yet, Cost Explorer and Cost and Usage Reports (CUR) seem like two sides of the same coin.
So, what are the differences between Cost Explorer and the CUR?
Quick Summary (Comparison Chart)
| AWS Cost and Usage | AWS Cost Explorer |
Description | A comprehensive, spreadsheet-like report of your billing data for a Payer AWS account | Highly visual cost graphs and tables showing a relatively high-level view of your costs and usage data for a specific Payer account in AWS |
Unique functionality | Details historical cost and usage data and sends it to an Amazon S3 bucket for further analysis and longer retention | Not only offers historical records but also creates forecasts and savings recommendations |
Data fields | Multiple line items. Also supports Cost Categories and Cost Allocation Tags | Up to 18 filters and groupings |
Format | CSV and Parquet | CSV |
Cost data duration | Hourly, daily, and monthly | Hourly (up to 14 days), daily, and monthly |
Pricing | Free, but standard Amazon S3 charges apply | Free, although querying cost and usage data via the Cost Explorer API costs $0.01 per paginated request |

What Does AWS Cost Explorer Do?
AWS Cost Explorer visually analyzes your resource consumption and related costs across the AWS public cloud. It is a complimentary cloud cost management service in the AWS ecosystem.
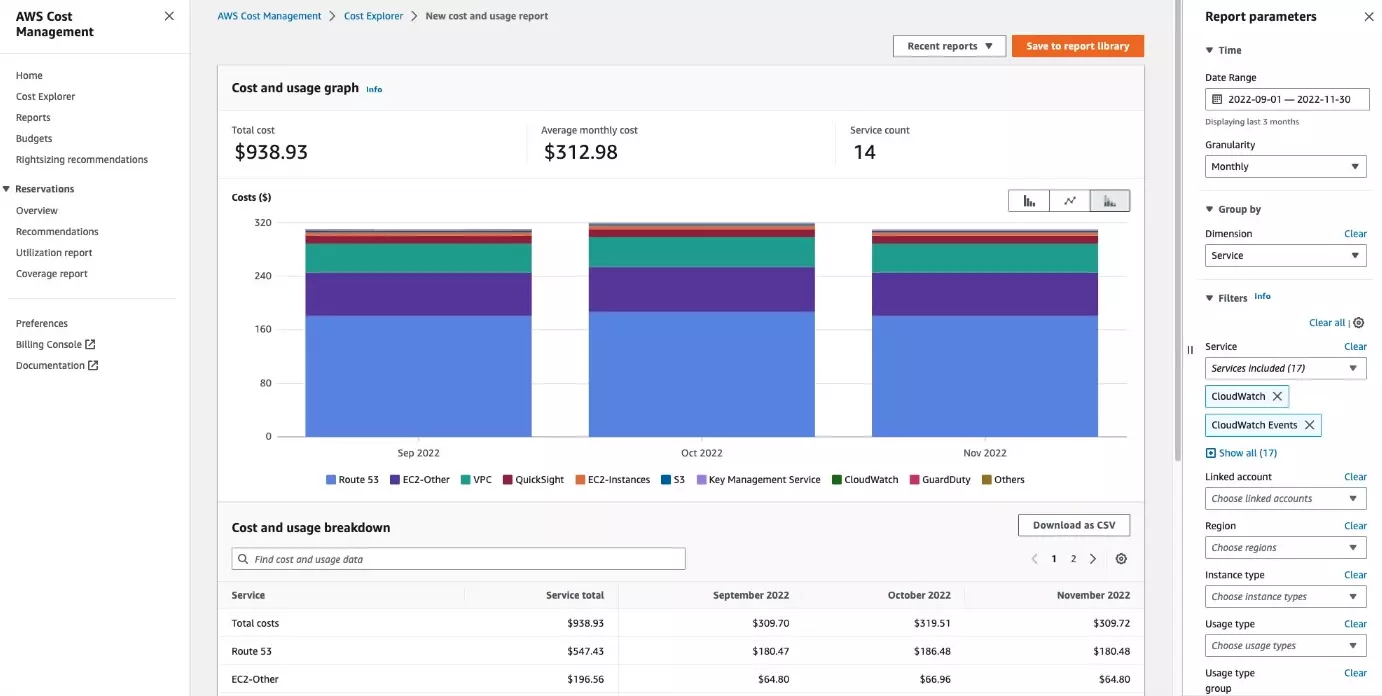
Once you enable AWS Cost Explorer in the payer account, the tool collects and reports on your cost and usage data across all the member accounts linked to it.
After a while of use, Cost Explorer can generate cost and usage reports for up to the previous 12 months on top of the current one. The tool then analyzes the historical data to generate a three-month forecast of your future usage and planning costs.
On the main graph, you can see your top five cost-accruing AWS services. The table view, on the other hand, allows you to examine all of your services’ costs and usage data.
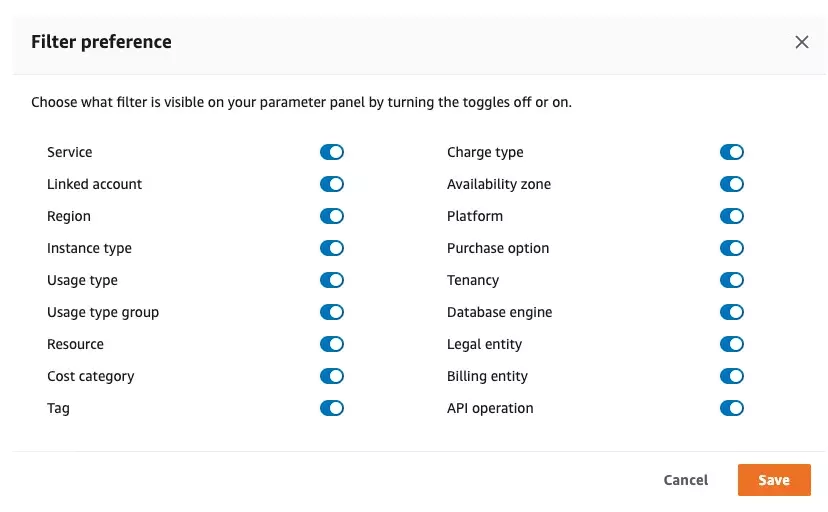
Even better, you can sort through up to 18 cost filters to see where you spent your money. Those filters include views by instance type, cost category, resource, region or availability zone, service, and linked account.
You can also view cost data hourly (for 14 days) and resource-level granularity (unlimited duration). If you want more detailed reports, you can get daily and monthly reports.
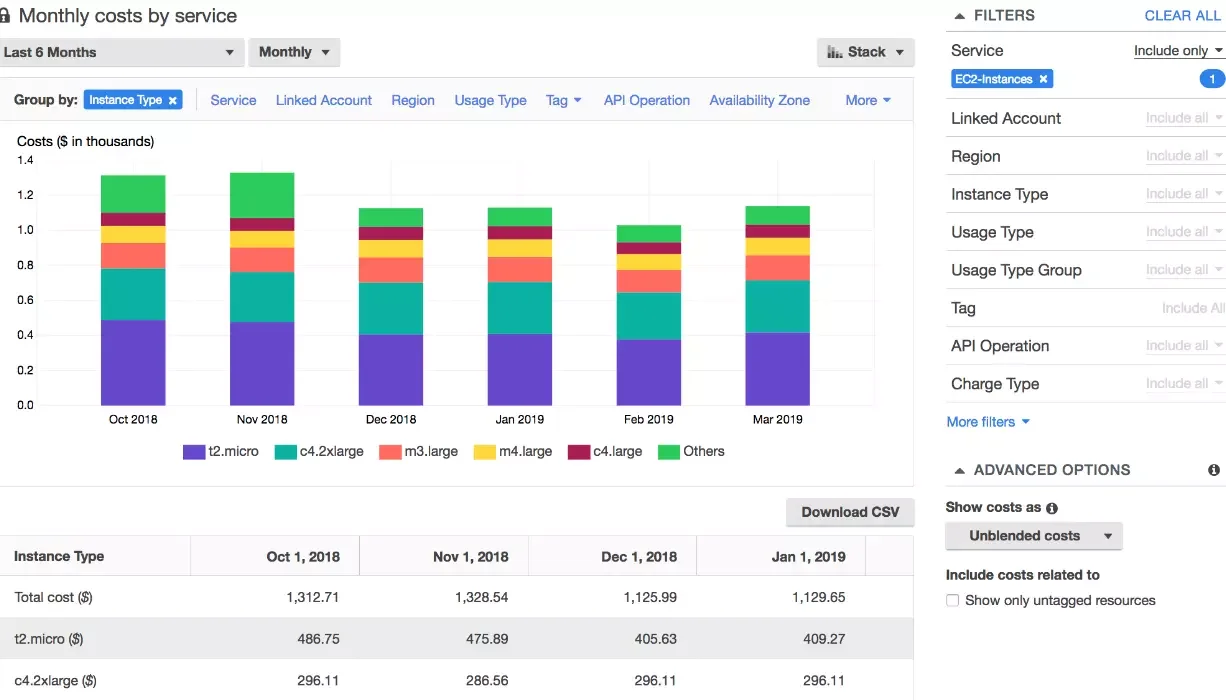
Cost Explorer monthly usage by service view
Something else. AWS Cost Explorer lets you create Savings Plans and Reservation reports of two types each:
- A Savings Plan Utilization report lets you visualize your cumulative Savings Plan usage and specify a tailored Savings Plan utilization goal. The report facilitates understanding how well you use your purchased resources.
- A Savings Plan Coverage report enables you to picture your general Savings Plans coverage. You can also set a customized Savings Plans coverage goal. The report aims to reveal savings opportunities.
- A Reservation Utilization report helps you view how much of your reserved resources you’ve utilized to tell how well you use them. It also lets you set a tailored reservation utilization target.
- A Reservation Coverage report enables you to see your aggregate reservation coverage and set a custom target. The report aims to help you pinpoint savings opportunities.
AWS Cost Explorer can also generate up to 50 custom cost and usage reports at once if you want to share them with multiple shareholders. These reports are also available in comma-separated value (CSV) file format.
Speaking of customization, you can use the AWS Cost Explorer API to create interactive and custom cost management applications. You will not need to set up any additional infrastructure to accomplish this. However, AWS charges $0.01 per paginated request, and each page counts as a single request.
Another thing. If you want to visualize underutilized EC2 instances that you could downsize (on an instance-by-instance basis) within the same instance family, AWS Cost Explorer can help.
It is also useful to consider your RIs and savings plans to determine the potential effect on your AWS bill. Cost Explorer also makes custom recommendations in all commercial regions (excluding China) across the instance families A, T, M, C, R, X, Z, I, D, and H.
However, Cost Explorer does not automatically implement the changes on your behalf, unlike other tools like ProsperOps.
What Are AWS Cost And Usage Reports Used For?
In AWS, a Cost and Usage Report (CUR) provides a detailed view of resource utilization and associated costs in raw format.
Indeed, AWS Cost and Usage Reports provide the most detailed billing data of any AWS cost management tool, including Cost Explorer. An AWS CUR includes cost and usage data by the hour, daily, monthly, product, service, product resource, and custom tags.
Here’s a crucial detail. A CUR enables you to create and save cost and usage data to your own Amazon Simple Storage Service (Amazon S3) bucket. Some things to note here:
- Through the Billing and Cost Management console, you can create up to 10 AWS Cost and Usage Reports for an individual account.
- You can download the CUR data in CSV format (GZIP) or Parquet file format to work the data with tools like QuickSight.
- To ensure you always have the most up-to-date CUR data in Amazon S3, choose the “Overwrite existing report” option.
- Choose the “Enable report data integration for” option to simplify integrating CUR with other analytics tools on AWS, including Amazon Athena, Amazon QuickSight, and Amazon Redshift.
After you’ve chosen your options, the report will take about 24 hours to generate. If you’re familiar with spreadsheet programs like Microsoft Excel or Google Spreadsheets, you’ll recognize this report:
After all, it looks like this:
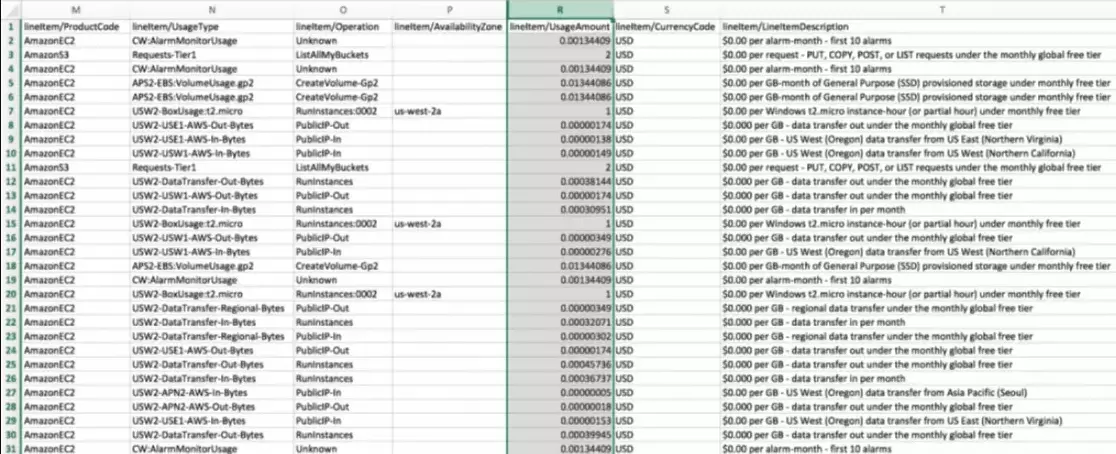
Credit: An AWS Cost and Usage Report – Superadmins
Each column in the generated AWS Cost and Usage Report serves a specific purpose, including answers to billing details that describe the following:
- What you used the money on = line_item_unblended_cost
- Who spent it = line_item_usage_account_id
- When it was spent = line_item_usage_start_date
- Where you actually spent it = product_region
- Why you made the spend = line_item_resource_id
Enabling AWS Cost Categories and cost allocation tags will make your CURs more meaningful and easier to categorize. The best time to do this is before creating and saving a Cost and Usage Report. But you can still add the tags and categories at any time after.
Now, you’ve probably noticed. These many line items for a large organization can add up fast and be absolutely overwhelming.
That’s why AWS lets you save the data directly into an Amazon S3 bucket. This enables you to use the Amazon S3 API to pull and analyze the CUR data with a more robust cost solution, like CloudZero, CloudHealth, or Cloudability, to name a few.
As a result, AWS allows you to save the data directly into an Amazon S3 bucket. You can also use other analytics and business intelligence tools, including Apache OpenOffice Calc, Tableau, and Microsoft PowerBI.
AWS will update your CUR in Amazon S3 at least once a day and up to three times daily. But if you want, you can use the AWS Cost and Usage API Reference to create, retrieve, and delete your reports.
What Is The Difference Between AWS Cost And Usage Report And AWS Cost Explorer?
The biggest difference between AWS Cost Explorer and the AWS Cost and Usage Report (CUR) lies in the level of detail they provide
- Cost Explorer offers a high-level, simplified view of AWS costs and resource consumption. It generates visual representations, forecasts, and savings recommendations, making it ideal for quick insights and forecasting based on historical data.
- On the other hand, AWS CUR delivers a comprehensive, line-item breakdown of AWS costs and usage data right down to the resource level. It generates highly detailed reports that can be stored in an Amazon S3 bucket and analyzed with external tools for deep, custom analyses.
This distinction makes Cost Explorer better suited for visualization and basic analysis, while AWS CUR is optimal for teams requiring granular control, such as detailed billing, chargebacks, and integration with advanced analytics platforms.
Once you understand the technical differences, the key is knowing when to use each tool.
When To Use AWS Cost Explorer Vs. AWS Cost And Usage Report
Here’s when to use each tool for optimal cost management.
Use AWS Cost Explorer when:
- Quick cost analysis – You need fast, high-level insights into your cloud costs, with simple filtering and visual representations of usage and spending over time.
- Setting budgets and forecasts – You want to establish budgets, monitor spending patterns, and predict future costs using historical data.
- Savings Plan recommendations – You are looking for savings opportunities and recommendations based on current and historical usage patterns.
- Custom alerts – You need to set cost alerts and monitor your usage at a glance without dealing with complex datasets.
Use AWS Cost and Usage Report (CUR) when:
- Detailed billing breakdown – You require a detailed, line-item report of AWS usage and associated costs for billing, resource management, or chargebacks.
- Custom data analysis – You need to export raw cost data into external tools like Amazon Athena, Excel, or Tableau for custom analysis and in-depth reporting.
- Compliance and auditing – You need highly detailed logs for compliance or auditing purposes, ensuring accurate tracking of each resource’s usage over time.
- Cost allocation – You need to allocate cloud costs across departments, teams, or projects with fine-grained control over how each dollar is spent.
Note: CUR’s level of detail is especially ideal for amortizing costs and querying cost and usage data with more robust tools like CloudZero.
Take The Next Step: Get Real Cost Intelligence Without Endless Tagging In AWS
Here’s the thing. AWS Cost Explorer relies heavily on cost allocation tags to organize your AWS costs and usage data. An AWS Cost and Usage Report would also be baseless without accurate tagging.
Without a near-perfect tagging system, cost data in CUR and Cost Explorer is likely to be inaccurate. Yet, maintaining perfect cost allocation tags is often a huge challenge for many engineers, finance teams, and FinOps professionals.
For example, as you scale AWS usage or merge organizations or teams due to acquisitions, you’ll likely need to redo or edit your tags significantly to maintain a consistent tagging strategy across your organization. That’s often time-consuming, error-prone, and demoralizing.
Also, messy tags, such as cost per team, environment, or project, don’t get you the granularity you’d otherwise want.
Worse still, even if you have decent tags, CURs, and Cost Explorer, they do not break down costs by individual customers, products, or features or help you understand the context surrounding the line items. Instead, a CUR and Cost Explorer report emphasizes totals and averages.
CloudZero Shows You Who, What, And Why Your Cloud Costs Are Changing
With CloudZero’s code-driven approach, you can collect, analyze, and report on cost and usage telemetry from your environment and applications. This contextualizes your AWS cost and usage data, empowering you to view the costs of your tagged, untagged, and untaggable resources.
You can even pinpoint the costs of individual tenants in a shared environment. Better yet, you can explore cost insights by role (engineer, finance, or FinOps). For example, your engineers can see how their technical choices, such as a deployment or architectural change, impact costs.
With CloudZero AnyCost, you can aggregate, analyze, and understand your costs across AWS, Azure, and Google Cloud, as well as platforms like Kubernetes, New Relic, Snowflake, and Databricks.
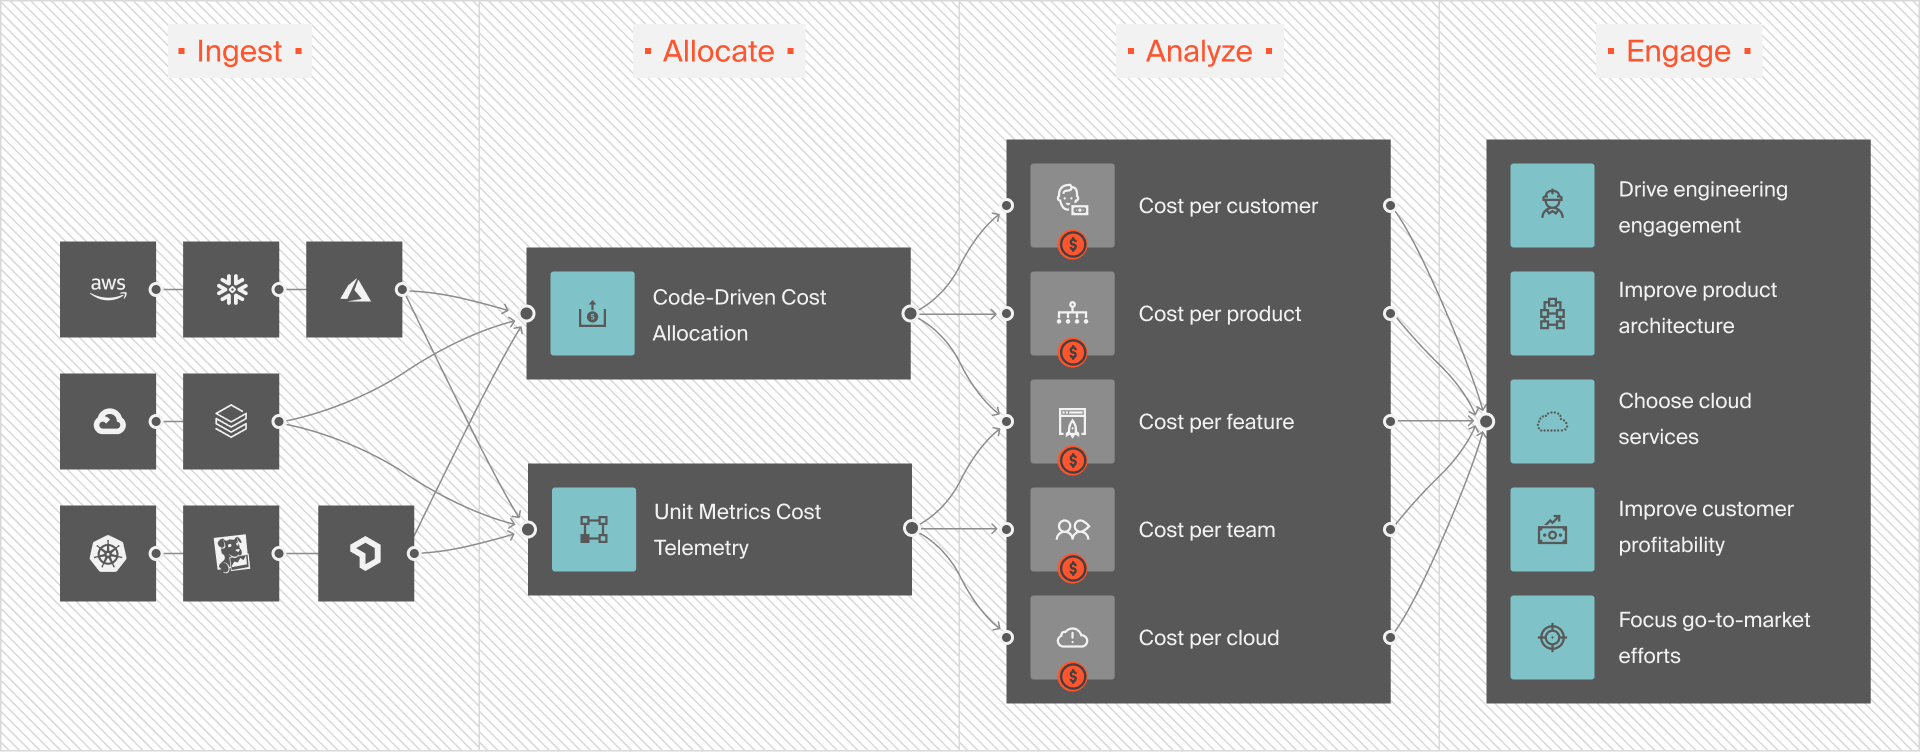
Best of all, CloudZero helps you break down your costs into immediately actionable insights like cost per customer, per team, per software feature, per service, per environment, and more — even if you have messy AWS tags.
So, instead of this:
You get this:
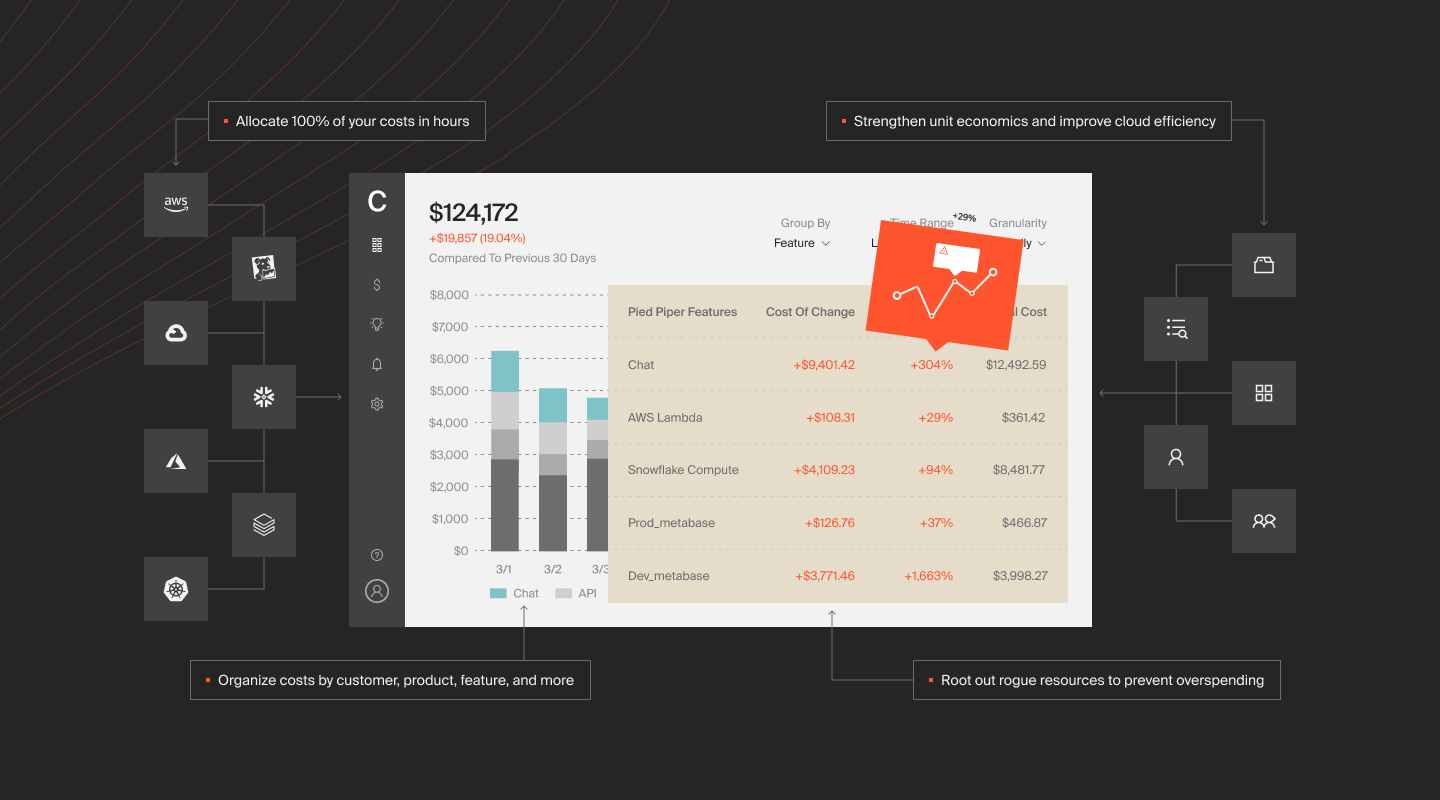
There’s more. CloudZero also delivers budgeting, forecasting, real-time cost anomaly detection, noise-free cost anomaly alerts, and more.
 to see CloudZero in action!


The Cloud Cost Playbook
The step-by-step guide to cost maturity