SaaS companies are known for their strong margins. With gross margins typically in the 60-90% range, even SaaS companies with comparatively weaker margins have a compelling business model when compared with most other industries.
Nonetheless, even a few percentage points of margin can have a huge impact on a company’s valuation and overall success. This chart, taken from a great article by Villi Iltche at Two Sigma Ventures, shows the correlation between gross margins and valuation.
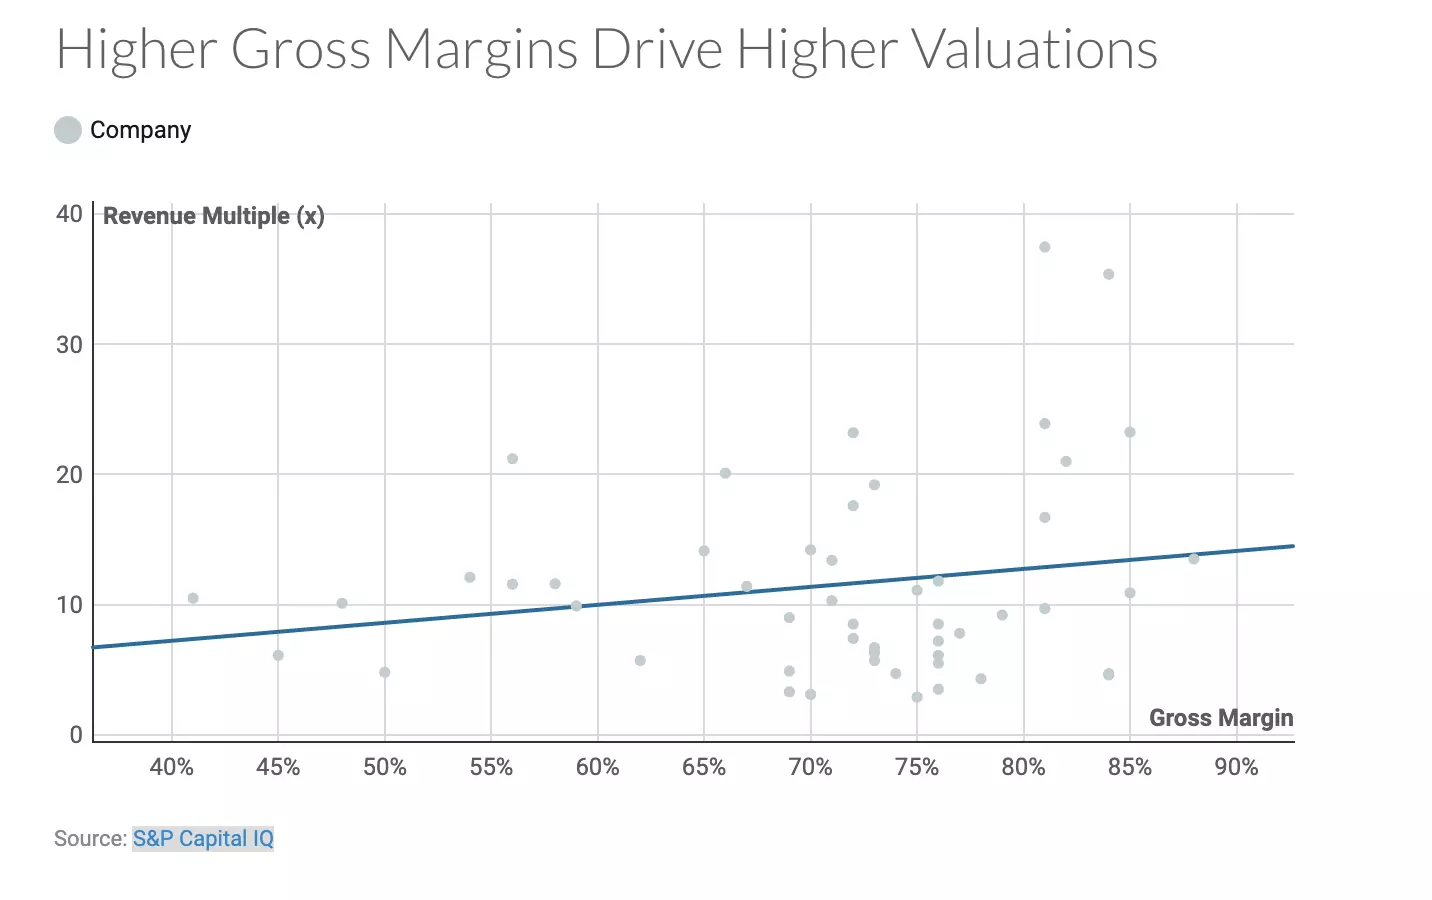
However, despite the enormous impact of gross margin (and as Iltche argues, stickiness of margin as a company grows), we’ve noticed an extraordinarily common and rather concerning pattern: many companies are over-reporting their cost of goods sold (COGS).
This observation is consistent across every size company and segment we talk to, from startups to public companies — and even includes many well-known names of the hottest companies out there.
When so much is at stake, this might seem hard to swallow. Why would any company miss an opportunity to maximize its valuation and share prices?
Cloud-Native Architecture Turned The Cloud Bill Into A Blur
The answer is that for many SaaS companies, their engineering teams are adopting cloud-native architectures — and it’s shattering their accounting and financial reporting processes.
In the early days of the cloud, companies could fairly easily split up costs with a combination of tagging and separate AWS accounts. However, cloud-native engineering has evolved — and most SaaS engineering teams are now running far more complex infrastructure, where resources for customers and products are shared — like multi-tenant or containerized architecture, such as Kubernetes.
These architecture decisions are often made by engineering in the name of innovation, speed, reliability — and ironically, cost. The unintended consequence, however, is that the cost metrics that finance needs in order to effectively report on COGS are obscured.
The bill arrives and finance can see how much is spent on EC2 or S3, but they can’t see how much it costs to run different products or features, much less how much it costs to support each customer.
In our experience, it’s especially common that when an engineering team makes the shift to Kubernetes — the finance team is blindsided. Their cloud cost reporting breaks — and they’re left to either accept their new cloud cost blindness or compromise their company’s pace of innovation. Innovation always wins.
Report
Finance needs to prove AI’s return: CloudZero report
260 senior finance leaders (more than half CFOs) told us why the speed of seeing AI spend, not the size of it, separates who pulls ahead on AI from who gets burned.
The Peanut Butter Approach
The way that a lot of finance teams are currently dealing with this is what we like to call, “the peanut butter approach”.
They’re spreading their costs out evenly across products, features, segments, and customers — often in some cobbled together system in spreadsheets.
For example, many of the companies we speak with use static percentages that they feel represents the per customer cost, or they simply spread out the shared resources — like networking and storage — across all customers evenly.
But here’s where the real danger comes in.
Many companies are padding their COGS because they don’t have confidence in their accuracy — and they can’t risk the consequences of mis-representing to investors.
For example, they may apply a default percentage that they feel is “safe”, so if they’re audited, it won’t be an issue.
It might look something like this: 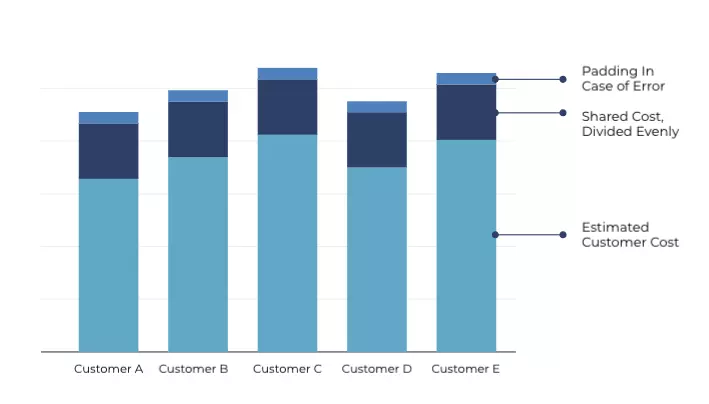 Multiple business leaders have told us that they believe their company’s market cap is lower than it should be because they are providing such conservative numbers. Growth stage companies often have even less confidence. FP&A and engineering leaders hope that there are no questions about the COGS metrics in their board slides.
Most of them think they’re outliers — but they’re actually the norm.
The Problem With Peanut Butter
The most obvious problem with the peanut butter approach is, of course, over-reporting. No company ever wants to say their margins are weaker than they actually are. Reporting lower (and more accurate) COGS helps the company’s overall strength, valuation, stock price, and more.
However, there’s another underlying issue. A lack of accurate, granular cost visibility, obscures the strategic insight that business leaders need in order to build a stronger, more resilient, more competitive business. Without it, there’s a gaping missed opportunity.
Here are a few examples.
Example 1: Maximizing the value of sales contracts
A SaaS company sells to large enterprise customers, with varying costs to support each of them. If their finance team takes the peanut butter approach, they have an inaccurate understanding of the cost to support each customer.
What if instead, they could see the exact margin of every one of their customers?
They could change their pricing and renewal guidelines. They could adjust the way they incentivize their sales teams. Or maybe, they might even decide to “fire” a few customers if they’re harming the bottom line and won’t pay more.
Example 2: Prioritizing market segmentation
In addition to looking at individual customers, finance teams can also measure patterns across segments.
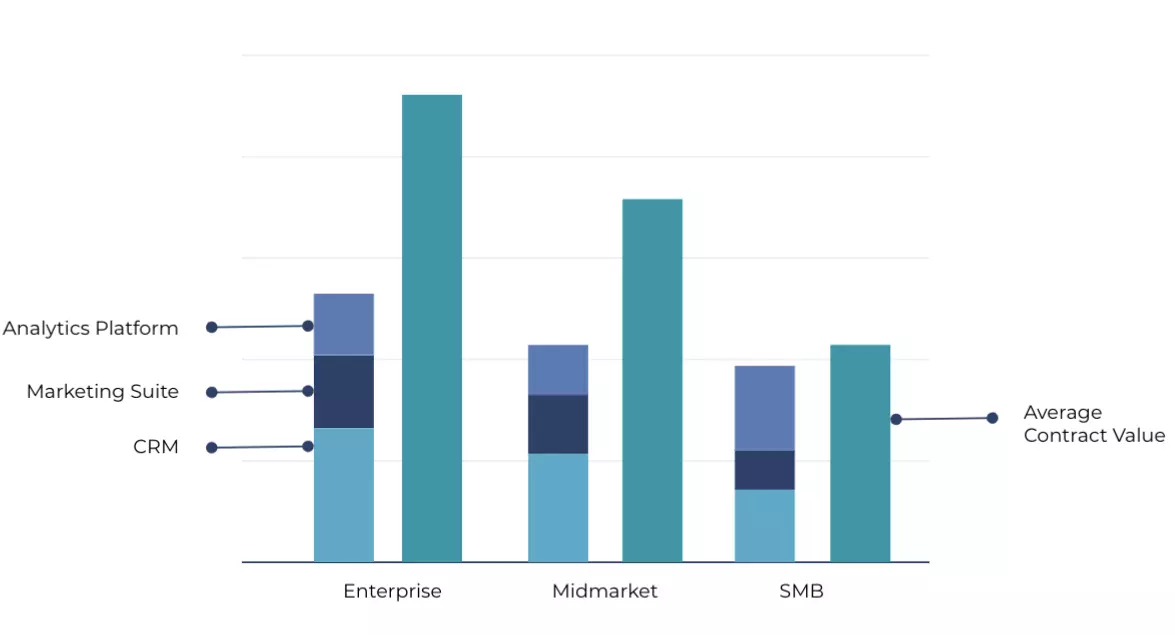
For example, let’s say a marketing technology company sells a product with three major features. They know all their customers love them for their CRM and marketing tools — and they just released a new analytics platform last year.
However, they’ve noticed that larger customers haven’t been using it much, because they’ve already invested time in configuring other third-party tools, while small customers are thrilled to have access to it and have adopted it wholeheartedly.
By only reporting on high-level, approximate COGS, they might not notice that their smallest customers are costing them the most — and that their analytics feature is driving the majority of that cost.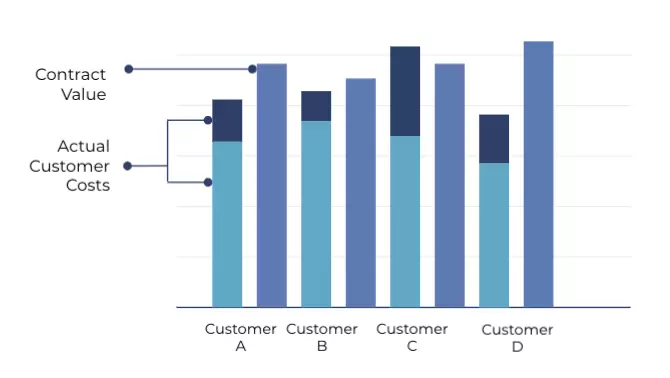 With this new information, they might decide to change their packaging, so the analytics feature is a premium for customers with low contracts. Or, they may decide to ask the engineering team to scope out an optimization project to see if they can reduce the cost. Alternatively, they may decide to no longer focus on SMB — especially if their customer acquisition costs (CAC) are comparable.
Whichever path they choose, it would be challenging to make those decisions without visibility into their COGS.
Ready To See Your Cost In New Dimensions?
Whether you’re taking the peanut butter approach or not, CloudZero can help you gain visibility into your cloud cost across new dimensions. Without tagging, CloudZero can transform your cost, enabling you to measure cost per customer, cost per segment, cost per product feature, and more. With CloudZero, you’ll get an accurate, granular understanding of your costs — so you’ll never have to take your best guess again.  .
.