
01 Introduction
Welcome to CloudZero’s crash course on cloud unit economics (CUE)! It’s an exciting world, full of profit and revenue and other very cool economics terms, so we hope your seatbelt is securely fastened.
At its core, CUE connects your cloud spend to the business value it delivers. It goes beyond tracking total costs to reveal unit economics — spend per unit of value delivered. This empowers teams and P&L owners to focus on margins, profitability, and informed, growth-driven decisions.
Knowing that you spent $650,000 on compute last month doesn’t tell you much about the economics of the service you’re delivering. Even seeing that costs went up or down by $25,000 provides little insight. The real value of CUE is context — tying those numbers to demand, revenue, and business outcomes.
For AI workloads, this is especially important. Total spend might rise, but unit costs — such as cost per 1 million tokens — can drop as usage scales. This is why CUE matters: it shows whether your spend is supporting healthy growth and improved economics.
Even for finance or product teams without deep infrastructure knowledge, CUE breaks down cloud costs into understandable, actionable business metrics.
CUE breaks down the costs of the cloud resources needed to deliver value — tied to the unit of value your service provides. That “unit” varies by business.
For example, imagine a service offering email backup solutions charged per mailbox. CUE assigns a dollar amount to backing up each mailbox. If the price customers pay exceeds that cost, you’re profitable. As the service scales, the cost per mailbox ideally drops, improving margins.
Customers also use CUE to refine pricing in usage-based SaaS and AI products. Shared dashboards make it valuable for engineering, finance, and product teams alike.
To hammer this point home, here are the three types of data most commonly used when getting started with CUE:
Cloud cost data
This is the source of all spend information, typically from cloud vendor billing statements. On its own, it’s just numbers. To make it actionable, you need attribution — linking spend to the responsible technology, service, or owner — and allocation — assigning costs to business entities such as teams, initiatives, or P&L centers. These steps turn raw data into insights that drive ownership and informed business decisions.
Demand data
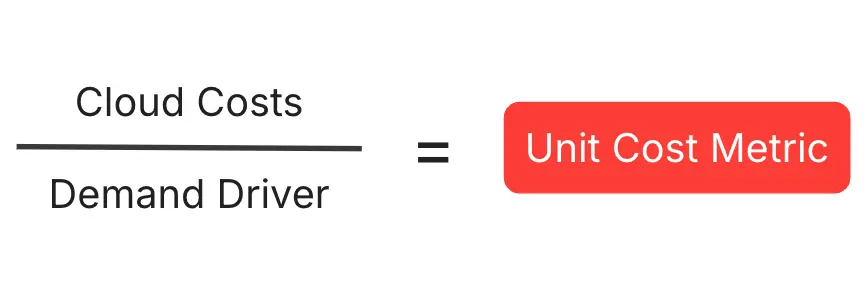
Data that shows how much your end users are consuming your products/features. The demand data you choose to track depends on your business’s core value offering. You will combine this data with cloud cost data to obtain unit cost metrics, which represent your incremental cloud costs in terms of your central demand driver.
Examples
- A digital workout app might track # of workouts
- A food delivery app, # of orders
- A logistics company, # of shipments
- A company providing AI/LLM services might track the number of tokens processed — often measured in 1 million tokens — or the cost per 1 million tokens.
- Demand data usually comes from internal applications or tools like Amplitude, Snowflake, Datadog, and Sumo Logic.
Revenue data
Data that shows how much revenue individual products/features generate. You will combine this data with cloud cost data to calculate efficiency metrics, such as the Cloud Efficiency Rate (CER).
That’s it. Once you’ve identified the best sources of this data and fed them into CloudZero, you’re all set.
02 Unit Cost Metrics: The Engine Of CUE
The central engine of CUE is the unit cost metric — your incremental cloud costs tied to a specific driver of business value. This driver could be demand, usage, or revenue, depending on what best represents value for your service.
For example, a delivery app might use cost per order, while a SaaS company might prefer cost per daily active user. The right driver depends on the context of your business and the outcomes you want to measure.
Unit cost metrics are much easier to understand in practice than in theory, so let’s dive into an example.
Ex. 1: EatIn, A Food Delivery App
Imaginary food delivery app EatIn has a substantial cloud footprint ($300M/year), and they process two billion orders per year. As orders are at the heart of their business value, their unit cost metric looks like this:
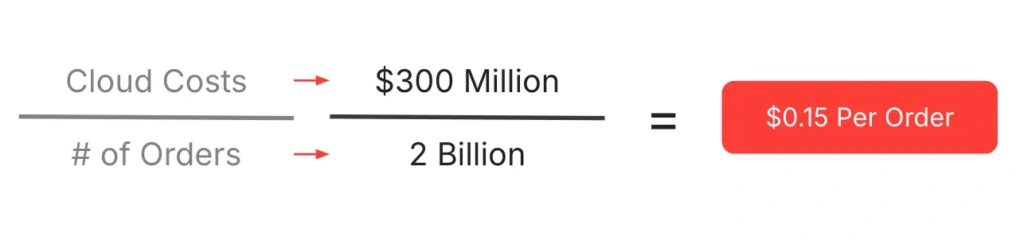
When companies process this many units of demand, they often raise the denominator by several powers of 10 to get a more useful end figure. So, EatIn’s leadership team would likely prefer to track cost per 1,000 orders, thus:
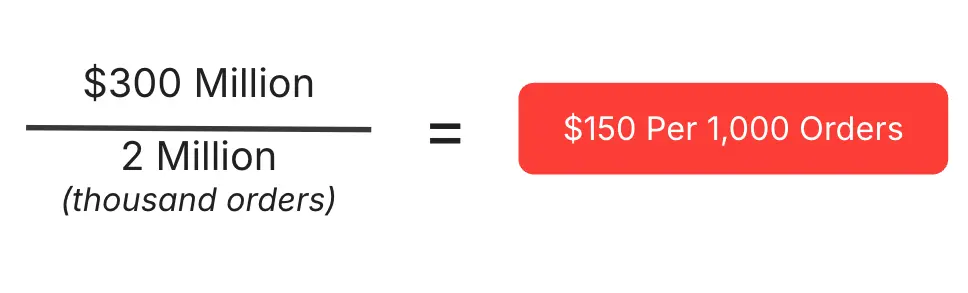
$150 per 1,000 orders is EatIn’s unit cost metric, viewed at a level of yearly granularity. “Granularity” refers to the level of detail in your data — CloudZero can present cloud cost data at hourly, daily, weekly, monthly, or yearly granularity. Typically, unit cost metrics yield the most useful data on somewhat larger timescales. So, for standard reporting purposes, EatIn would probably want to see Cost Per 1,000 Orders Per Month in a neat dashboard:
| Jan | Feb | Mar | Apr | May | Jun | Jul | Aug | Sep | Oct | Nov | Dec | |
| Cloud cost | $25M | $25.01M | $25.02M | $25.03M | $25.04M | $25.05M | $25.06M | $25.07M | $25.08M | $25.09M | $25.1M | $25.11M |
| # of orders | 160M | 180M | 200M | 220M | 240M | 260M | 280M | 300M | 320M | 340M | 360M | 380M |
| Cost per 1k orders | $156.25 | $138.94 | $125.10 | $113.77 | $104.33 | $96.35 | $89.50 | $83.57 | $78.38 | $73.79 | $69.72 | $66.08 |
As you can see in this chart, EatIn’s cloud costs increase steadily throughout the year, but this doesn’t stop their Cost Per 1,000 Orders from decreasing throughout the year. This means that EatIn’s demand is scaling at a higher rate than their cloud costs — a very happy state of affairs.
We’ve simplified the numbers to further illustrate the important point made earlier in this guide: When your cloud costs increase, it doesn’t necessarily mean your cloud efficiency decreases. If your cloud infrastructure was built efficiently — as EatIn’s clearly was — your unit costs can decrease even as your cloud costs increase. You may not scale at such an unbelievably efficient rate as EatIn, but this is how CloudZero customers measure their cloud efficiency.
When cloud costs increase but unit costs decrease, it means healthy growth, efficient scaling, and more profit for you.
03 Combining Unit Cost Metrics With Cost Allocations
It’s important to understand the difference — and the relationship — between unit cost metrics and cost allocations. As we’ve seen, unit cost metrics divide a unit of consumption (in our case, cloud costs) by a unit of demand (in EatIn’s case, # of orders), and a string of unit cost metrics indicates how cloud-efficiently a company is scaling.
Cost allocations, on the other hand, divide an absolute cost into custom business buckets for showback/chargeback. So, if cloud cost is a pie, cost allocations would divide the pie into appropriately sized slices, based on a particular business lens. Allocating costs is a key step in calculating unit cost metrics, so the more accurate your allocation, the more accurate your unit cost reporting will ultimately be.
Time for another example — this time, with EatIn’s engineering teams.
Ex. 2: EatIn’s Cost Per Engineering Team
Let’s home in on EatIn’s January cloud costs, which the table above tells us were a flat $25M. Unallocated, the costs would look like this:
… a pretty useless chart. By “useless,” we mean “completely devoid of business insight.” On its own, a raw number representing cloud cost doesn’t tell you anything meaningful. And as we learned above, even a sequence of monthly cloud cost numbers wouldn’t be helpful. Only when cloud costs are put in a business context do they deliver meaningful insight about the state of the business.
Cost allocations provide that essential business context. One common way to allocate costs is by engineering team, which shows you who’s consuming what portions of your overall cloud costs.
If EatIn were using some extremely sophisticated CCM platform — CloudZero, say — which could allocate 100% of their cloud costs — costs spanning IaaS, PaaS, SaaS, and shared, containerized, and multi-tenant architectures — this is what their January Cost Per Engineering Team (teams whimsically named after the Teenage Mutant Ninja Turtles) would look like:
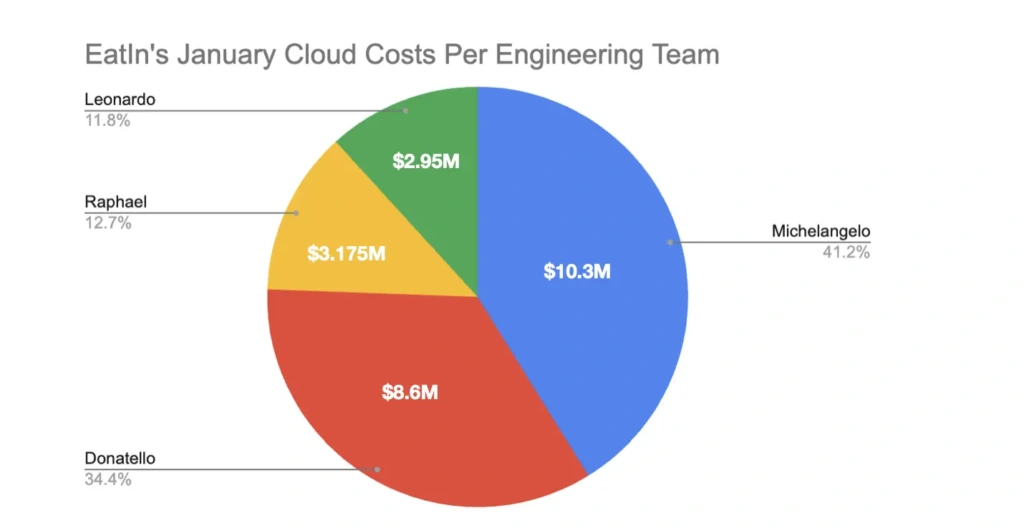
Now we’re getting somewhere. From this chart, we see that Team Michelangelo is responsible for the highest portion of EatIn’s January cloud costs — way more than Teams Raphael and Leonardo.
This data leads us down the pathway to more informed, business-relevant questions. Questions like:
- Why is Team Michelangelo incurring such high costs? Does the answer justify their costs (e.g., are they working on EatIn’s flagship product/feature)?
- Is Team Donatello building in some cost-efficient way that Team Michelangelo could employ to lower their costs?
- Has Team Leonardo achieved cloud efficiency nirvana?
The coup de grâce is combining cost allocations with unit cost metrics. If EatIn had a year’s worth of Cost Per Engineering Team data, and they’d been calculating Cost Per 1,000 Orders during the same timeframe, they could combine these two data sources to get Cost Per 1,000 Orders Per Engineering Team — an extremely sophisticated view of how their engineering teams’ cloud efficiency is trending over time.
With the right platform, EatIn could get the same level of analytical sophistication for any business lens that was important to them. They can view the cost per product, cost per feature, cost per customer, and cost per microservice, all within the context of Cost Per 1,000 Orders.
In other words: They could get a high-level sense of their business efficiency, tease it apart by any portion of their business making a meaningful impact on it, investigate what’s driving efficiencies/inefficiencies, make more informed, cost-efficient engineering decisions, uncover unprofitable customers, have internal discussions about adjusting pricing models, and track the impact of all of it over time.
This is exactly how the world’s most sophisticated cloud-driven companies use CloudZero. One company — a neobank valued in the tens of billions of dollars — tracks over 40 unit cost metrics and more than 45 cost allocations to gain a clear understanding of how to drive greater cloud efficiency. Upstart used cost per product and cost per organization to drive engineering accountability and reduce its costs by $20M. Neon grew engineering engagement by 700% through allocations like cost per team and cost per customer.
Another example highlights allocation by feature. A global SaaS platform serving over 40 million users runs more than 50 large language models (LLMs). They allocated costs per model, per region, and per customer segment. This feature-level allocation revealed cost per token and cost per user, driving over $1M in savings, including a 50%+ reduction in compute spend.
04 Cloud Efficiency Rate (CER): The Crown Jewel Of CUE
All of the manipulations of cloud cost and demand data we’ve outlined so far are excellent for making detailed investigations into your business. Take an unallocated lump sum of cloud spend, allocate it in a business-relevant framework, assess its unit cost efficiency, and remediate areas of inefficiency.
The last piece of this puzzle is revenue. At the end of the day, we invest in the cloud because we believe it’s the best way to make the most money. However, since AWS 1.0 emerged in 2006, there have been no unifying benchmarks by which companies can measure the efficiency of their cloud spending.
Yes, cloud spending is factored into other SaaS metrics, such as COGS and gross margin. But given the outsized sums of money companies spend on cloud resources — it’s often a top two or three expense category for technology companies — we need a metric that isolates cloud costs and assesses them in the context of revenue.
CloudZero created the Cloud Efficiency Rate (CER) metric to do just this. At its most basic, here’s how you calculate CER:
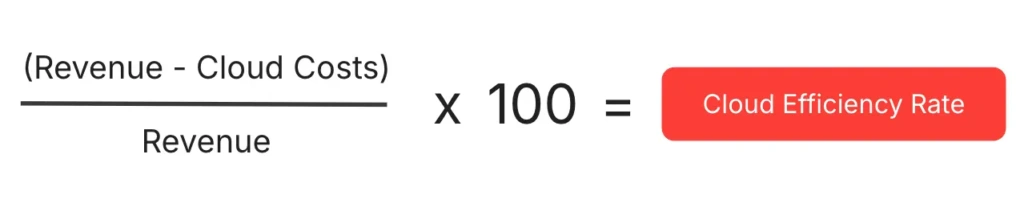
Like gross margin, the formula yields a percentage that tells you how much of your revenue is going to and not going to your cloud providers.
Ex. 3: EatIn’s Cloud Efficiency Rate
Let’s again look at some pretty simple numbers for our old friends, EatIn. Let’s suppose their annual revenue is $1 billion and their cloud costs are $200 million.
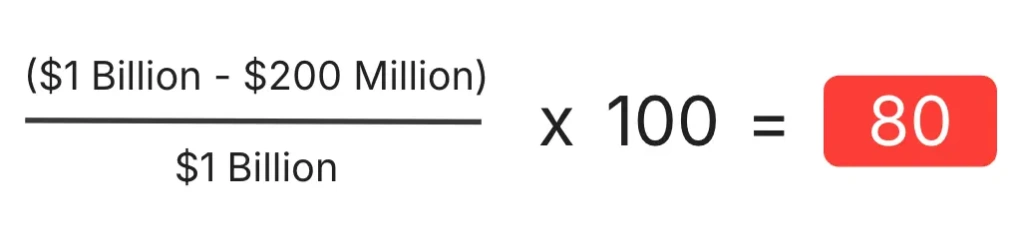
In this situation, EatIn would have a CER of 80% — far from elite (we’ll go over benchmarks in a moment). This means that for every $1.00 of revenue they generate, they send $0.20 to their cloud provider(s).
Now, let’s say that the next year, they start using CloudZero, find a slew of incredible efficiency opportunities, reduce their cloud costs by 30% (average year-one CloudZero customer savings), and continue raising their revenue.
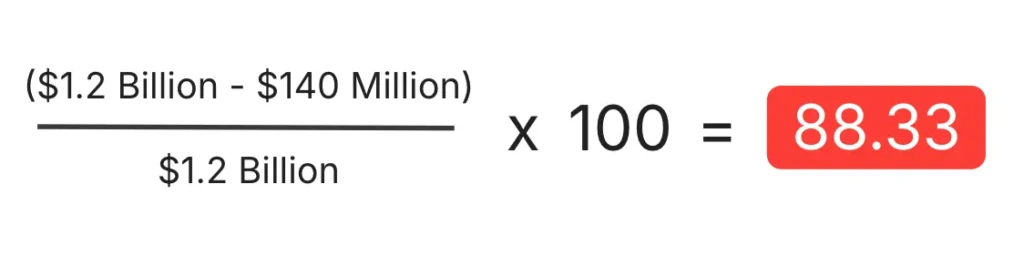
Now we’re talking. A CER of 88.33% is still not quite elite, but it’s in much more rarefied company than 80%. An improvement like this doesn’t just look good in a board deck; like any meaningful SaaS metric uptick, it can whet investors’ appetites, boost valuations, and position companies well for public offerings.
05 So What’s A Good CER?
Naturally, you’d want to understand where companies fall along the spectrum of CER. In 2024, CloudZero partnered with BenchmarkIt, a B2B SaaS research firm, to develop this spectrum.
Here it is:
- 25th Percentile: 75% CER
- Median: 80% CER
- 75th Percentile: 92% CER
Want to see how you stack up? Use CloudZero’s CER widget.
Generally speaking, anyone in the top quartile of a SaaS metric like this is in elite territory. So, companies aiming for the top of the CER mountain should set a goal of 92% or above.
For reference, an analysis of CloudZero’s publicly traded customers (i.e., those whose revenue data is publicly available) showed a 95% median CER. This means that overwhelmingly, public CloudZero customers are in elite CER territory.
06 Going Deeper: Dimensionally Enriched CER And Layered CER
Understanding your overall CER is a great first step. But alone, overall CER is about as useful to engineering initiatives as gross margin is to finance initiatives — it can give you a sense of your overall efficiency. Still, it won’t highlight the most impactful savings opportunities.
So, it’s necessary to go one or several steps further. Similar to how we used unit cost metrics, we can combine CER with cost allocations (the cloud cost pie divided into appropriately sized slices) to obtain dimensionally enriched CER and layered CER calculations.
Dimensionally Enriched CER
In CloudZero parlance, cost allocation buckets — including cost per team, per product, per feature, per microservice, and per customer — are also referred to as “Dimensions.” A Dimension is a business lens you can apply to your overall cloud spend. “Customer” is a common Dimension; when you apply it to your cloud spend, you see that spend in terms of cost per customer.
For AI-heavy businesses, Dimensions might include:
- Cost per inference
- Cost per 1,000 tokens
- Cost per model training hour
These views help answer questions like:
- Which customers or use cases are driving the highest AI costs?
- Are GPU investments paying off in terms of revenue efficiency?
- Should we adjust our pricing tiers for API calls or generative AI subscriptions?
When CloudZero customers apply these Dimensions, they often uncover surprising insights — such as high-volume API users driving disproportionately high costs or certain model types consuming far more GPU hours than others. These insights enable better decisions around infrastructure investments, customer pricing, and margin optimization.
Layered CER
You can take CER to an additional level of depth by leveraging another of CloudZero’s core differentiators: the ability to layer different allocations on top of one another for extremely nuanced understandings of business value drivers.
Real-world example
One of our customers, Beamable, is a video game platform company. In the same way AWS provides cloud infrastructure for software companies to build and run their apps, Beamable provides video game infrastructure for game designers to build and run their games.
Beamable wanted a very sophisticated layered Dimension that required layering three individual Dimensions: cost per service per game per customer. In other words, how much each of a particular customer’s games’ individual services cost. Our customer success team developed some sophisticated allocation logic to deliver this.
With CER, they could connect these Dimensions to revenue at each stage of the calculation. Beamable could see their CER per service per game per customer, and understand exactly how much business value each of their customers’ individual games’ services were driving.
Of course, as every business has a unique business value framework, the layering potential for Dimensions and for CER is endless. Develop as many CER views as you want, and view your cloud-driven business value through any lens, at any time.
07 Conclusion
To recap, the foundations of CUE are:
- Unit Cost Metrics, which show your cloud costs as a function of demand.
- Cost Allocations (a.k.a. Dimensions), which divide your cloud spend into business-relevant buckets.
- Cloud Efficiency Rate (CER), which shows your cloud costs as a function of revenue.
- Dimensional Enrichment, where you combine unit cost metrics and/or CER with allocations for deeper insights.
A few CUE truths to remember:
- Rising cloud costs don’t always mean declining efficiency — your unit costs tell the real story.
- Cloud cost data only becomes valuable when viewed in a business context.
- A CER of 92%+ puts you in elite company; CloudZero’s public customers average 95%.
In the AI era, CloudZero is a force multiplier for FinOps. It doesn’t just track cloud costs — it helps predict cloud efficiency, justify GPU investments, and support pricing strategies for AI products. For teams building with AI, CUE isn’t optional — it’s a competitive advantage.
Ready to embark on your CUE journey? Read the rest of this guide, and schedule a CloudZero demo today.
