Quick Answer
Application monitoring tools track your application's health, speed, errors, and resource usage in real time. Also called APM tools or application performance monitoring software, these tools are essential for any team running production workloads. The leading options in 2026 are Datadog, New Relic, Dynatrace, Grafana, and Elastic APM for traditional workloads, plus Arize AI, LangSmith, and Weights & Biases for AI observability. According to Gartner's application performance monitoring Magic Quadrant, the APM and observability market will exceed $9 billion in 2026, driven primarily by the need to monitor AI inference workloads that did not exist three years ago.
Every application generates data. Response times, error rates, throughput, resource consumption, user sessions. The purpose of application performance monitoring is to turn that data into answers: is the application fast enough? Is it breaking? Where? Why?
The market for application performance monitoring tools has grown alongside cloud adoption because more distributed architectures create more places for things to go wrong. And increasingly in 2026: how much does the infrastructure serving this application cost, and is that cost producing business value? If you are evaluating performance monitoring tools for a startup or replacing legacy application performance management software at an enterprise, that last question shapes the buying decision.
That last question is where most app monitoring tools stop and where finance teams start asking for help. Traditional application monitoring software tells you the application is slow. It does not tell you that the slowness is costing $14,000/month in over-provisioned compute that serves 200 users who generate $3,000 in revenue.
Application performance management tools can identify the bottleneck. What they cannot do is connect it to the revenue impact. For that, you need monitoring data connected to business context, which is what CloudZero provides alongside your APM stack.
What is application performance monitoring?
Application performance monitoring (APM) is the practice of tracking, diagnosing, and optimizing the performance of software applications. APM monitoring tools collect metrics (CPU, memory, latency, error rates), traces (the path a request takes through your system), and logs (what happened and when) to give engineering teams visibility into application behavior.
The term application performance management is sometimes used interchangeably with APM, though management implies a broader scope: not just monitoring what is happening, but actively managing performance through alerting, auto-remediation, and capacity planning. In practice, most teams say “APM” and mean both.
If you are asking “what is application performance monitoring” for the first time: it is the equivalent of a car’s dashboard, but for software. Speed, fuel level, engine temperature, tire pressure. Except the car has 400 microservices, runs across three cloud service providers, and the dashboard needs to show you which specific bolt is causing the rattling noise at scale. That is APM. And like a car dashboard, the information is only useful if someone actually looks at it.
APM is the original category. But in 2026, there are three distinct categories of monitoring tools, and mixing them up leads to buying decisions you will regret.
Report
Finance needs to prove AI’s return: CloudZero report
260 senior finance leaders (more than half CFOs) told us why the speed of seeing AI spend, not the size of it, separates who pulls ahead on AI from who gets burned.
APM vs observability vs. AI monitoring: how they differ
These three terms get used interchangeably. They should not. Each solves a different problem, costs different money, and requires different tooling.
|
Dimension |
APM |
Observability |
AI monitoring |
|
What it tracks |
Application metrics, traces, logs |
System-wide signals across infrastructure + applications |
Model performance, prompt quality, token usage, hallucination rates |
|
Primary user |
Engineering/DevOps |
Platform engineering/SRE |
ML engineers, AI product teams, finance |
|
Key question answered |
“Is the app fast and reliable?” |
“Why is the system behaving this way?” |
“Is the AI model producing good outputs at acceptable cost?” |
|
Example tools |
Datadog APM, New Relic, Dynatrace |
Grafana + Tempo, Honeycomb, Chronosphere |
Arize AI, LangSmith, Helicone, W&B |
|
Average cost |
$15-$50/host/month |
$10-$40/host/month |
$0.01-$0.05/1K traces |
The distinction matters for budgeting. Observability tools tend to be broader and cheaper per unit. APM tools are deeper on application-specific metrics but more expensive. AI observability tools are the newest category and price by trace volume, which means costs scale directly with AI usage. For cloud cost optimization strategies that account for monitoring spend itself, see our dedicated guide.
The trend in 2026: observability vs. monitoring is becoming less of a debate and more of a spectrum. Most teams need elements of all three. The question is which tools handle which layer, and how the data connects.
Best APM tools
Here are the leading application monitoring tools:
1. Datadog
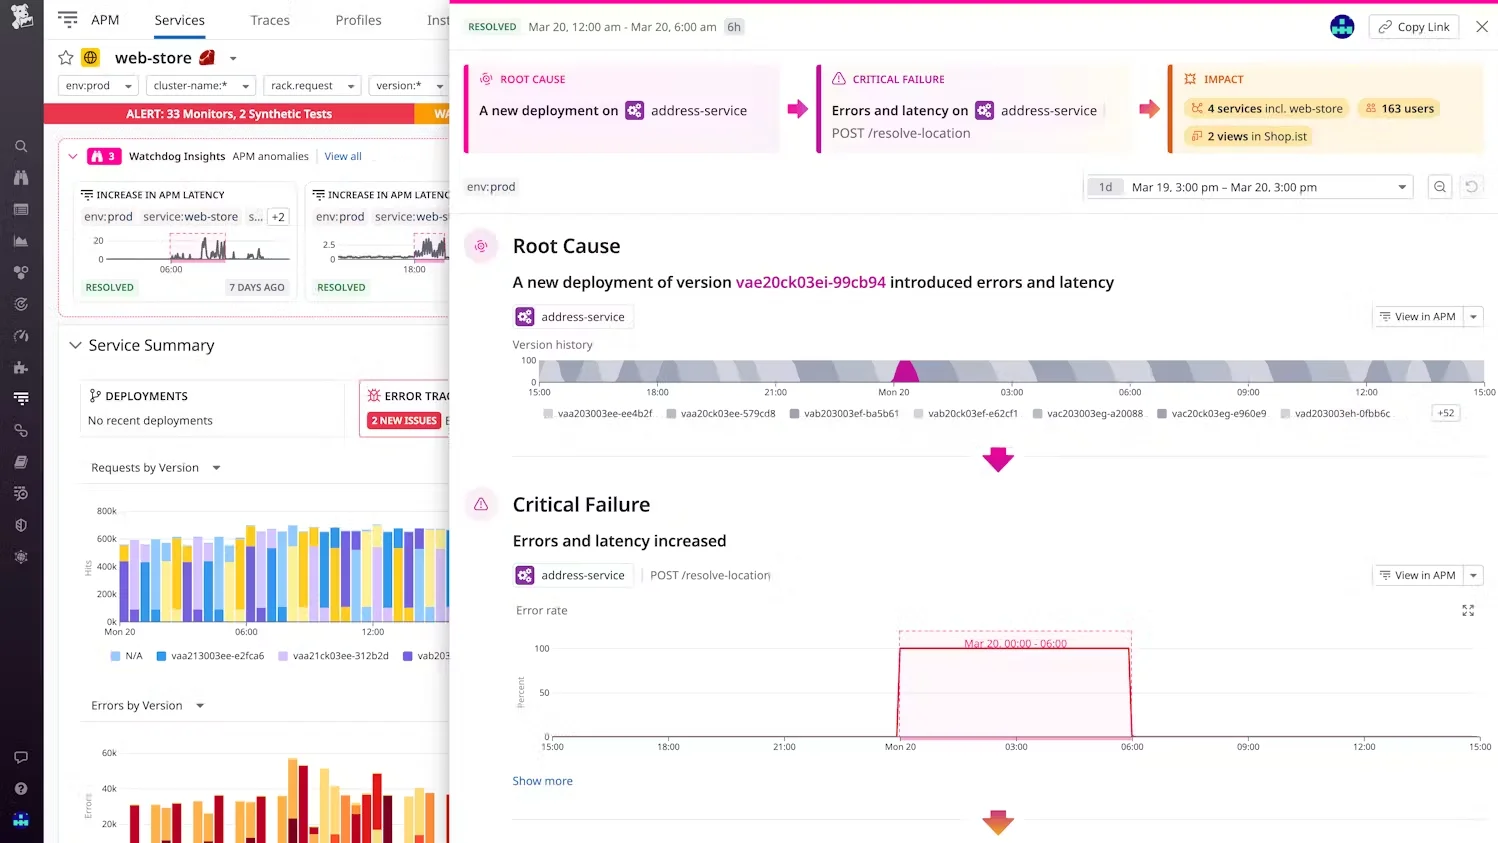
Datadog is the most widely adopted APM tool for cloud-native applications. It combines infrastructure monitoring, APM, log management, and real user monitoring in a single platform. Datadog’s distributed tracing tracks requests across microservices, and its AI-powered anomaly detection flags performance regressions before users notice.
Datadog pricing adds up fast. The APM module runs $31-$40/host/month, but most teams also need infrastructure monitoring ($15-$23/host), log management ($0.10/GB ingested), and custom metrics ($0.05/metric). A 50-host deployment with full APM, logs, and infrastructure easily reaches $3,000-$5,000/month. That is a line item worth tracking at the team and product level, not just in aggregate. (More on that in the cost section below.)
2. New Relic
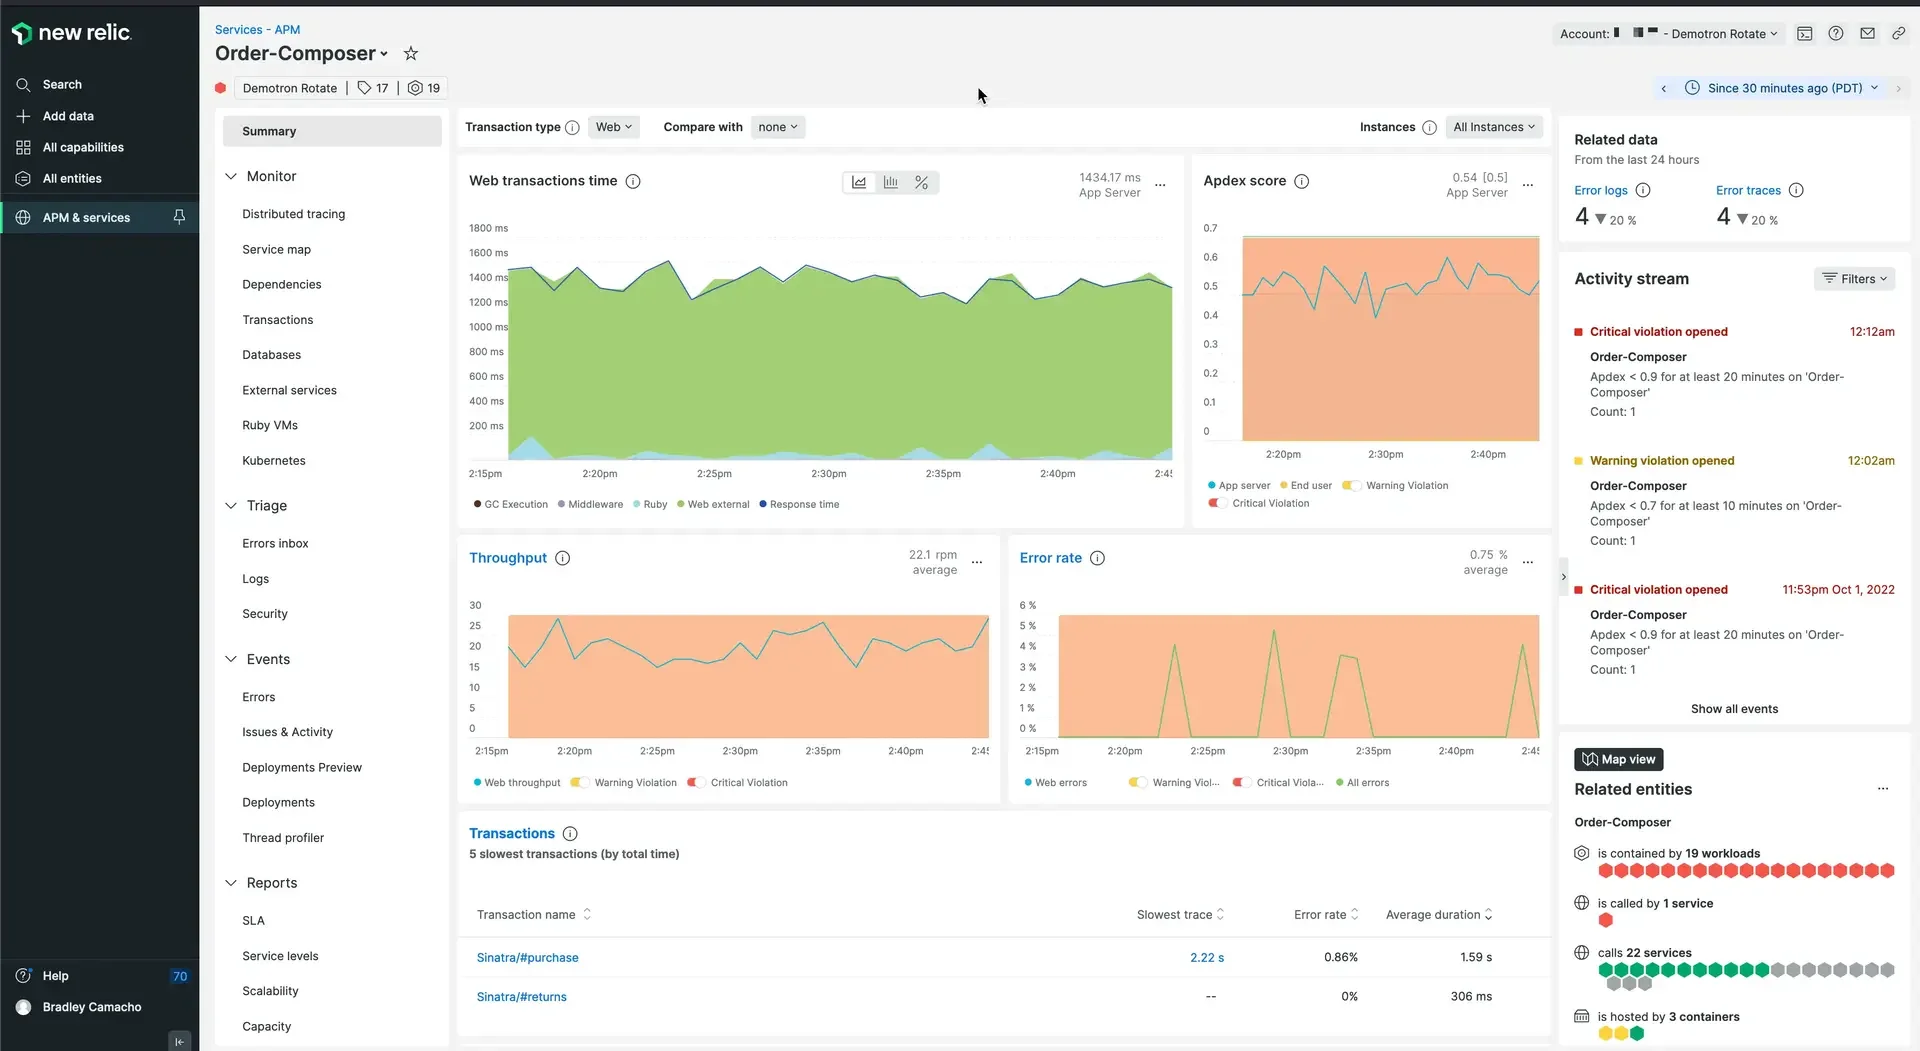
New Relic shifted to a consumption-based pricing model in 2023 and now charges per user plus data ingest (starting at 100GB/month free). New Relic APM 360 provides code-level visibility, distributed tracing, and AI-powered root cause analysis.
Its strength: a single platform covering APM, infrastructure, browser, mobile, and synthetics.
New Relic’s free tier is genuinely useful for small teams. The pricing gets complex at enterprise scale where data ingest volumes can generate surprise invoices. If your team has ever opened a New Relic bill and said “wait, how much did we ingest?”, you are not alone.
3. Dynatrace
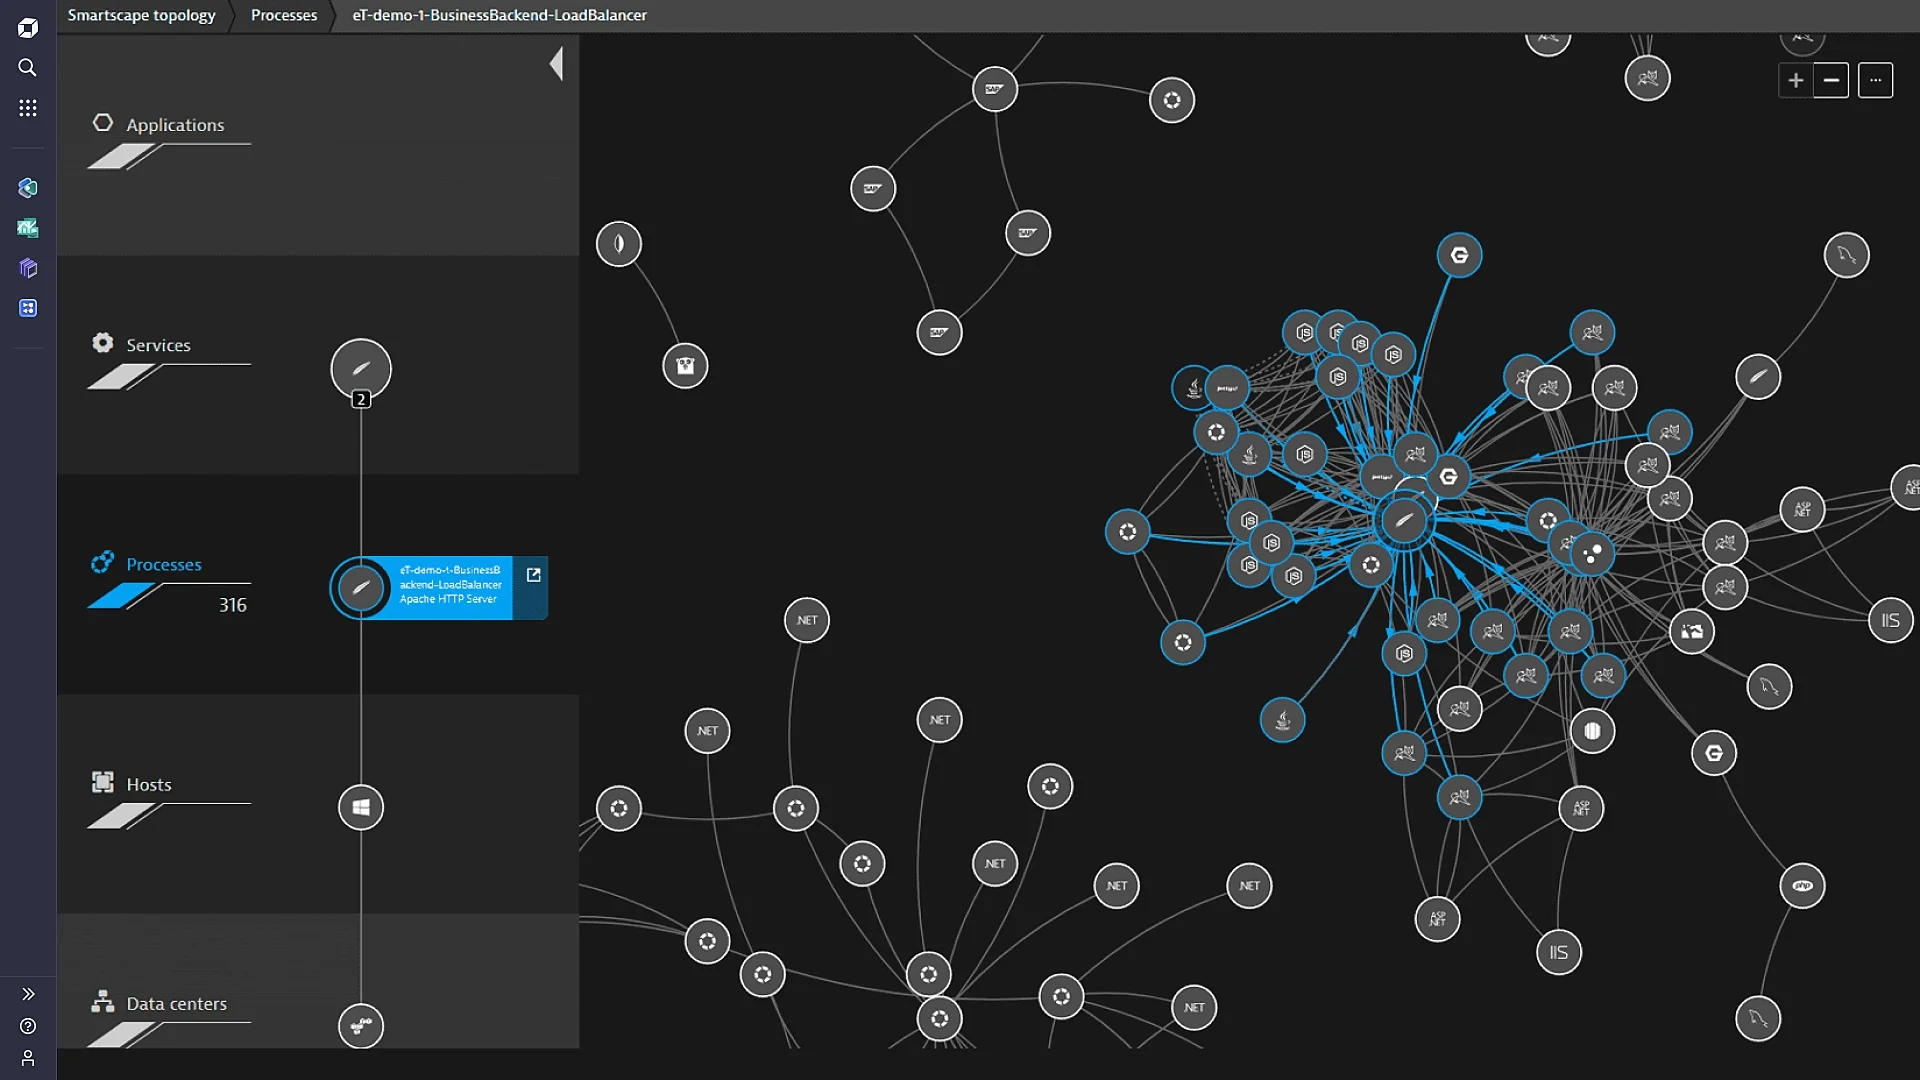
Dynatrace differentiates with automatic, full-stack instrumentation: deploy an agent and it discovers your entire application topology without manual configuration. Its Davis AI engine performs automated root cause analysis. Dynatrace is popular with large enterprises that need zero-touch setup.
Pricing is per GiB of data ingested, which can be hard to predict. Dynatrace is usually the most expensive application performance monitoring software on this list, but enterprises with 500+ hosts and complex distributed architectures often find the automated discovery justifies the premium.
4. Elastic APM
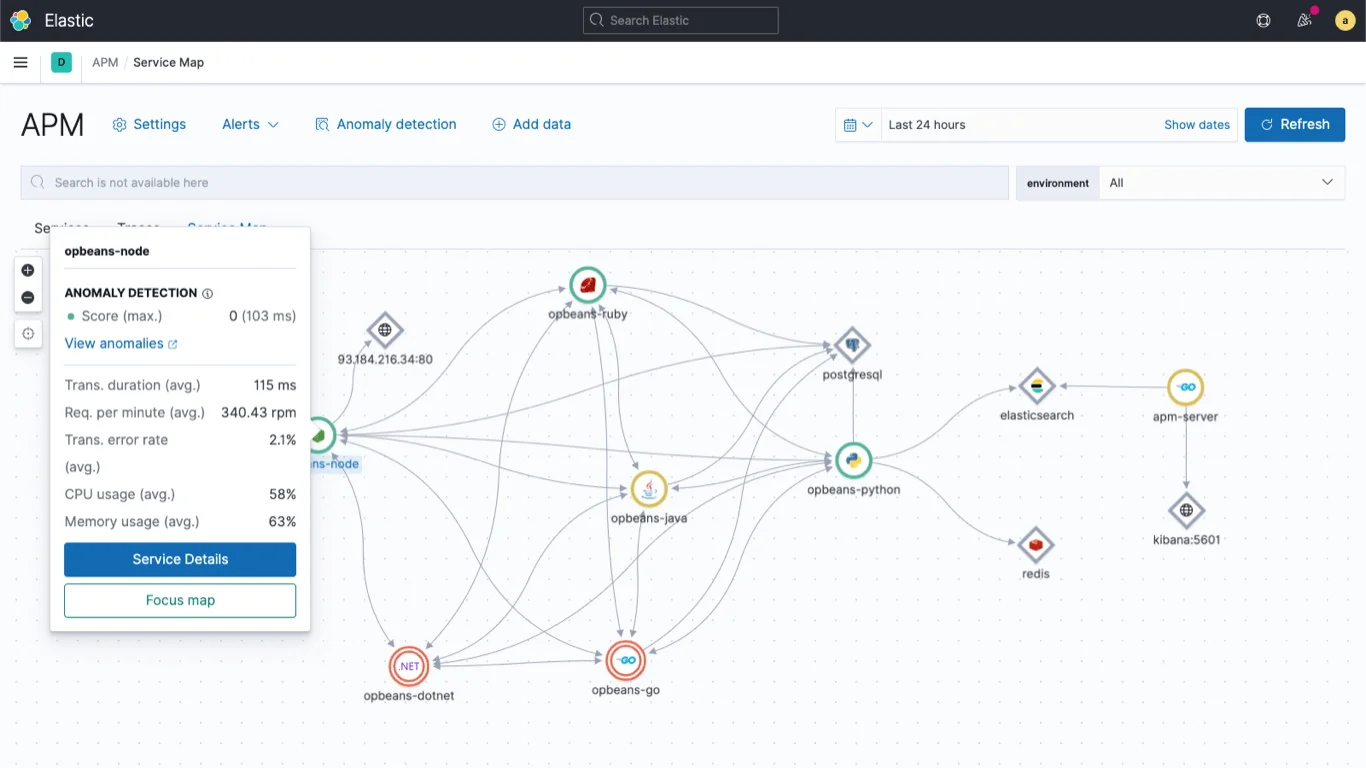
Elastic APM runs on the Elastic Stack (Elasticsearch, Kibana) and is fully open source. Teams already running Elastic for log management can add APM without a new vendor. The trade-off: Elastic APM requires more operational effort than managed alternatives. You are running the infrastructure, not renting it.
5. Splunk APM
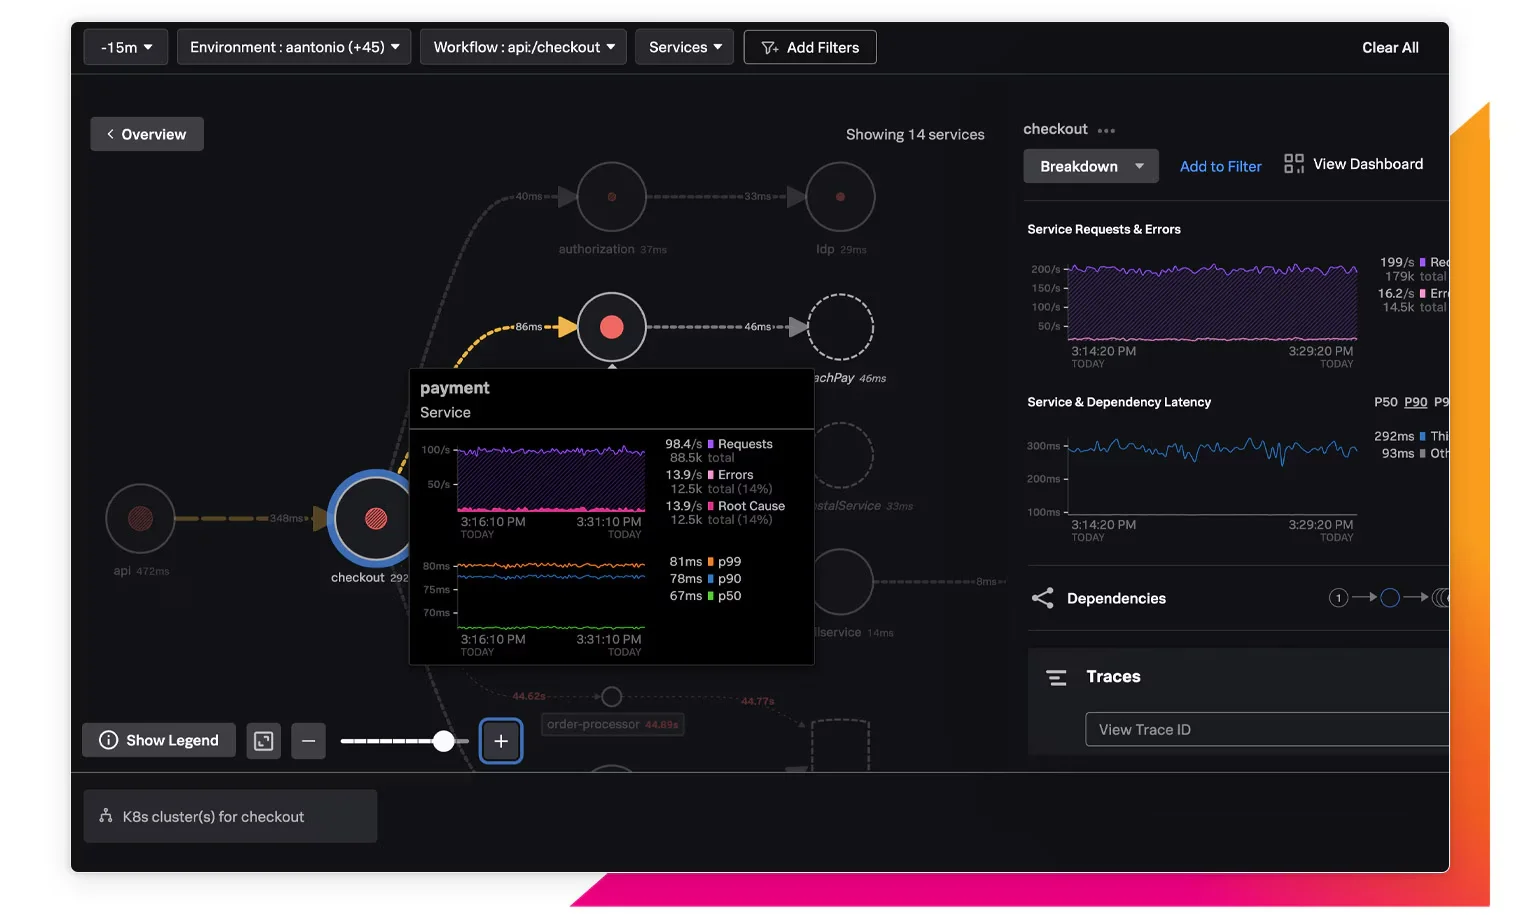
Splunk APM (part of the Splunk Observability Cloud) combines performance monitoring with Splunk’s SIEM capabilities, making it a natural fit for teams that want security and performance data in one place. After the Cisco acquisition, Splunk’s enterprise integration story has strengthened.
Each of these tools tells you what the application is doing. They answer the “is it fast?” and “is it breaking?” questions well. The cost question and the business value question are a different problem entirely. But before getting to cost, there is a broader category of tools worth understanding.
Best observability platforms
Observability tools go beyond APM by correlating metrics, traces, and logs across the entire system, not just individual applications.
- Grafana + Tempo + Loki is the open-source observability stack of choice for cost-conscious teams. Grafana handles visualization, Tempo handles traces, Loki handles logs, and Prometheus handles metrics. The components are free and self-hosted. Grafana Cloud offers a managed version with a generous free tier.
- Honeycomb pioneered high-cardinality observability: the ability to query across millions of unique attribute combinations without pre-defining dashboards. It is the tool engineers reach for when they need to answer questions they did not know to ask in advance.
- Chronosphere is built for Kubernetes-native environments and focuses on controlling observability data volume (and therefore cost). Its aggregation engine reduces the amount of data stored while preserving the ability to drill down when needed.
The observability market is consolidating. Datadog, New Relic, and Dynatrace all offer observability capabilities alongside APM. The standalone observability vendors differentiate on cost (Grafana), query flexibility (Honeycomb), or scale efficiency (Chronosphere). For teams evaluating the broader cloud management software landscape, monitoring is one piece of the puzzle.
AI and LLM observability tools
As Charity Majors, CTO of Honeycomb, has argued: “Observability is about being able to ask new questions of your systems without having to ship new code or predict in advance what you need to know.” That principle now extends to AI workloads, where the questions are newer and the costs are higher.
AI observability is the practice of monitoring AI model performance, cost, quality, and safety in production. Traditional APM tools track latency and errors. AI observability tools track prompt quality, hallucination rates, token usage, model drift, and cost per inference. These metrics matter because AI workloads are expensive, variable, and directly user-facing.
LLM observability tools specifically monitor large language model deployments: what prompts are being sent, what responses come back, how much each response costs, and how users react to the output. If your product has a chat interface, a search feature powered by AI, or any workflow that calls a foundation model, you need LLM observability.
The key AI observability tools in 2026:
- Arize AI provides model monitoring, evaluation, and troubleshooting for LLMs and traditional ML models. Its tracing shows the full chain from prompt to response, including retrieval steps in RAG architectures. Arize integrates with OpenAI, Anthropic, and most open-source models.
- LangSmith (by LangChain) is the native debugging and monitoring tool for LangChain-based applications. If your AI stack is built on LangChain, LangSmith provides the tightest integration for tracing agent workflows, evaluating outputs, and tracking costs per chain.
- Weights & Biases started in ML experiment tracking and has expanded into LLM monitoring. Its strength is tracking model training runs, comparing model versions, and monitoring production inference. Particularly strong for teams that train custom models instead of calling APIs.
- Helicone is an open-source LLM proxy that logs every API call to OpenAI, Anthropic, or any LLM provider. It tracks latency, cost per request, and cache hit rates. For teams that want LLM observability without a new vendor contract, Helicone is the lightweight option.
- Patronus AI focuses on AI safety and quality: hallucination detection, toxicity screening, and factual grounding evaluation. If your compliance team needs assurance that the AI is not making things up, Patronus provides the guardrails.
The AI agent observability and agentic AI observability subcategory is emerging as agentic workflows (multi-step AI processes that make decisions autonomously) become production workloads.
Monitoring an agent is harder than monitoring a single LLM call because agents make sequential decisions where each step depends on the last. Generative AI observability tools are evolving to handle this complexity. Each major vendor is building toward a full AI observability platform that handles models, agents, and inference pipelines in one view.
For finance teams, the AI observability question is straightforward: what is the return on your AI spend? Every LLM call costs money. Every model training run costs money. AI observability tools track the performance side. The spend side needs a different lens: connecting per-token costs to per-customer value. That is where AI spend management becomes critical, and why platforms with native Anthropic and OpenAI integrations can attribute inference costs to the products and customers that generated them.
AI monitoring also raises a practical question for engineering teams choosing tools: do you add AI observability to your existing APM vendor, or adopt a purpose-built tool?
Open-source monitoring tools
For teams that want full control (and do not mind managing infrastructure), open-source options are mature and production-ready.
- Prometheus + Grafana is the standard for infrastructure metrics. Prometheus scrapes metrics from your applications and infrastructure. Grafana visualizes them. Together they handle 90% of what most teams need for infrastructure monitoring at zero licensing cost.
- Jaeger provides distributed tracing, originally built by Uber. It tracks requests across microservices and shows where latency accumulates. Jaeger is a CNCF graduated project, which means the community support and ecosystem integrations are strong.
- SigNoz is the open-source alternative to Datadog: metrics, traces, and logs in one platform. It runs on ClickHouse for fast queries and provides a single-pane-of-glass experience without vendor lock-in. For teams where monitoring cost is a concern (and it should be), SigNoz eliminates the per-host licensing model entirely.
The trade-off with all open-source options: you own the infrastructure. Upgrades, scaling, storage, and reliability are your team’s responsibility. For a 10-person engineering team, self-hosting Prometheus and Grafana is manageable. For a 200-person organization, the operational overhead can exceed the cost of a managed vendor. That math is worth doing before committing.
The monitoring considerations extend beyond application code. Services like AWS Glue and AWS Athena generate query costs that spike without visibility. For more on how monitoring fits into the broader cloud stack, see our guide to cloud computing examples.
With the tools covered, the harder question: how do you pick?
How to choose an application monitoring tool
Choosing an application monitoring tool is a technology decision and a finance decision. Here is a framework for teams evaluating options.
- Start with your architecture. Monolith on a single cloud provider? Datadog or New Relic covers you. Kubernetes-native microservices across multiple clouds? Consider Grafana + Tempo or Chronosphere. AI-heavy product with LLM calls? Add an AI observability tool (Arize, LangSmith, or Helicone) on top of your APM stack.
- Evaluate total cost, not per-host price. The per-host price is the number vendors put on the pricing page. The total cost includes data ingest fees, custom metrics surcharges, user licenses, retention costs, and the engineering time to manage the tooling. Most APM vendors use some form of tiered pricing where costs jump at usage thresholds. A “free” open-source stack that takes 0.5 FTE to manage costs $80,000-$100,000/year in engineer time. A $5,000/month SaaS tool that runs itself might be cheaper. For teams building DevOps pipelines, monitoring is typically the last stage added and the first line item questioned.
- Check AI monitoring capabilities. If your application calls LLM APIs (and in 2026, most applications will), your monitoring stack needs to handle AI-specific telemetry: token counts, model latency, prompt/response pairs, and cost per inference. Not every APM tool does this yet. Datadog, New Relic, and Splunk have added AI monitoring modules. Dynatrace and AppDynamics are catching up. For a complete apm tools list with AI capabilities, see the comparison table above.
- Match your deployment model. Cloud application monitoring tools (Datadog, New Relic) work best for SaaS and cloud-native workloads. Web application performance monitoring tools add real user monitoring and synthetic testing for customer-facing web apps. On-premises and hybrid deployments may need agents that work behind firewalls (Dynatrace, AppDynamics). The application performance tools you pick should match where your applications actually run, not where you wish they ran.
- Follow application monitoring best practices. Instrument production first (not staging). Set meaningful SLOs before configuring alerts. Track the four golden signals (latency, traffic, errors, saturation). And treat monitoring as an ongoing investment, not a one-time setup. For the DevOps best practices that make monitoring effective, see our guide. For DevOps metrics that pair with your monitoring data, see our DORA metrics breakdown.
- Demand cost attribution. Most monitoring tools show you total monitoring spend. Very few show you monitoring spend per team, per product, or per customer. Cloud cost management tools like CloudZero fill this gap by connecting monitoring spend (and all cloud spend) to business dimensions. See also our guide to cloud cost optimization for reducing waste in your monitoring stack.
For a broader decision framework on managing spend across tools and providers, see our guide to multi-cloud management tools. For related infrastructure decisions, see horizontal vs. vertical scaling and SaaS architecture patterns.
What application monitoring actually costs
Finance teams rarely ask “which APM tool should we buy?” They ask “why is our monitoring bill $40,000/month and is it worth it?” Fair question.
Here is what the numbers look like.
|
Team size |
Standard APM spend |
AI monitoring add-on |
Total monitoring |
|
Startup (5-15 engineers) |
$500-$2,000/mo |
$100-$500/mo |
$600-$2,500/mo |
|
Mid-market (15-50 engineers) |
$3,000-$15,000/mo |
$500-$3,000/mo |
$3,500-$18,000/mo |
|
Enterprise (50-200+ engineers) |
$15,000-$60,000/mo |
$3,000-$15,000/mo |
$18,000-$75,000/mo |
These numbers add up. A mid-market company spending $10,000/month on Datadog is spending $120,000/year on monitoring, which is roughly the cost of one engineer. The question is not “is monitoring worth it?” (it is).
The question is “is every dollar of monitoring spend producing proportional value?” If your staging environment is generating the same telemetry volume as production but serving zero users, you are paying for monitoring data nobody reads.
That is the kind of insight CloudZero provides. Not “your Datadog bill was $12,000 last month” but “your Datadog bill was $12,000, and $3,400 of it came from monitoring a development cluster that three engineers use, while $8,600 monitored the production environment serving 50,000 paying customers.” One of those is a reasonable investment. The other is a conversation worth having.
The missing layer: connecting monitoring data to business outcomes
Every application monitoring tool on this list answers the same question: “how is the application performing?” None of them answer the question finance leaders actually need answered: “is the infrastructure serving this application worth what it costs?”
APM tools show latency. CloudZero shows that the latency improvement from scaling your API tier horizontally cost $4,200/month in additional compute and reduced p99 response time by 40ms for enterprise customers generating $180,000/month in revenue. The APM tool told you the application got faster. CloudZero told you the investment returned 42:1.
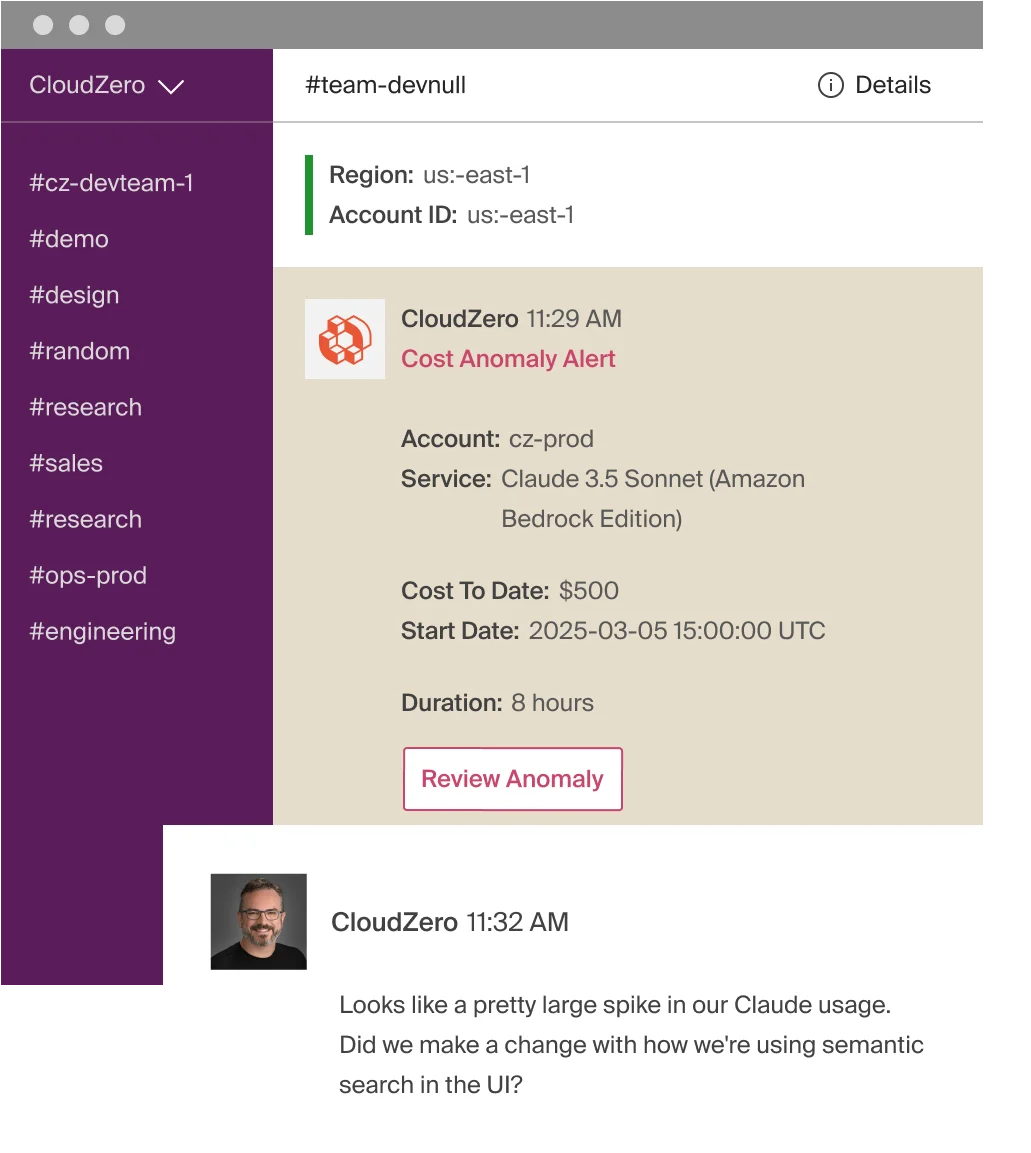
Anomaly detection catches monitoring spend anomalies alongside infrastructure anomalies: a Datadog integration that flags when custom metrics volume spikes 300% because a new deployment started emitting metrics nobody intended, or when AI inference monitoring costs tripled because a prompt engineering experiment generated 10x the normal trace volume.
Unit economics connect the full picture: cost per customer including infrastructure, monitoring, AI inference, and all the supporting tooling. That is the number a CFO needs to evaluate margins. That is the number most SaaS companies do not have.
Your monitoring tools tell you how the application is performing. CloudZero tells you what that performance is costing and producing in business value, across every provider, every tool, and every AI model. Take a product tour, get a free cloud cost assessment, or  .
.
FAQs about application monitoring tools