Quick Answer
AI observability is the practice of instrumenting AI systems — LLMs, models, agents, and AI-powered applications — to provide continuous visibility into performance, output quality, reliability, safety, and cost in production. Most tools cover the first four pillars. Cost observability — knowing what each AI request costs, which team drove it, and which customer it served — is the dimension most organizations skip until the invoice arrives.
Your observability stack can tell you the P99 latency of any microservice. Can it tell you what your AI agents cost per customer last week? For most organizations, the answer is no. That’s a blind spot growing at $2.52 trillion per year in worldwide AI spending, and Gartner predicts that 50% of GenAI deployments will invest in LLM observability by 2028, up from just 15% today.
The market for AI observability platforms has already reached $2.69 billion, on pace for $9.26 billion by 2030 at a 36.2% CAGR, according to Research and Markets.
CloudZero approaches AI observability from the cost dimension; the pillar that performance and quality tools skip. This guide covers what is AI observability, the five pillars every organization should instrument, which tools handle which dimensions, and why cost observability is the one that keeps showing up as a surprise on the monthly invoice. For the engineering deep-dive on LLM-specific observability (traces, spans, OTel instrumentation, cost-per-request implementation), see CloudZero’s LLM observability guide.
What Is AI Observability?
What is AI observability? It’s the discipline of instrumenting AI systems to provide continuous visibility across five dimensions: performance, output quality, reliability, safety, and cost. The scope covers LLMs, ML models, AI agents (autonomous and agentic), RAG pipelines, fine-tuned models, and embedded AI features across SaaS products. AI observability is broader than LLM observability, which focuses specifically on large language model applications, one layer within the full stack.
The distinction from traditional observability matters. Traditional APM tracks infrastructure health: latency, errors, uptime. When a server goes down, you know. Observability for AI workloads adds a behavioral layer that traditional APM was never designed for: prompt-completion quality, hallucination rates, model drift, safety violations, token economics, and agent decision paths. Your dashboards can be green from wall to wall while your AI confidently fabricates legal citations, leaks PII through a prompt injection, and racks up $4,000 in Opus tokens on a task that Haiku could have handled for $80. Traditional monitoring calls that system healthy. AI observability calls it a Tuesday.
The distinction from AI monitoring is equally important. Monitoring watches predefined metrics and fires alerts when thresholds cross. Observability in AI systems provides instrumentation that lets you ask questions you didn’t know to ask yet, because the failure mode that surfaces tomorrow is one nobody predicted. Monitoring tells you something broke. Observability helps you understand why, even when “why” turns out to be “a customer typed something nobody tested for and the agent decided to read the entire documentation site before answering.”
The five pillars that follow are the complete picture. Most organizations have invested in two or three. The question is which ones are missing, and which missing pillar will show up as a crisis first.
Research Report
FinOps In The AI Era: A Critical Recalibration
What 475 executives told us about AI and cloud efficiency.
The Five Pillars of AI Observability
AI observability operates across five dimensions. The first four are well-served by existing tools. The fifth — cost — is the one that arrives as a surprise invoice instead of a dashboard alert.
1. Performance observability
Latency (P50, P95, P99), throughput, token generation speed, time-to-first-token, error rates, retry patterns, and provider availability. These are the closest to traditional APM metrics and the dimension most AI observability tools handle well out of the box.
When your Claude API call takes eight seconds instead of 800 milliseconds, performance observability tells you. Tools like Datadog AI observability (via their LLM Observability module), Elastic Observability, and New Relic AI Monitoring all extend traditional APM into this layer. If your organization already runs Datadog or Elastic, performance observability AI coverage is often a configuration change, not a new vendor.
2. Quality observability
Output evaluation scores, hallucination rates, instruction-following accuracy, relevance, groundedness, and output drift over time. This is where AI observability splits from everything that came before it. A fast, error-free response can still be wrong. A 200 OK that confidently fabricates a contract clause is a quality failure that performance monitoring literally cannot see.
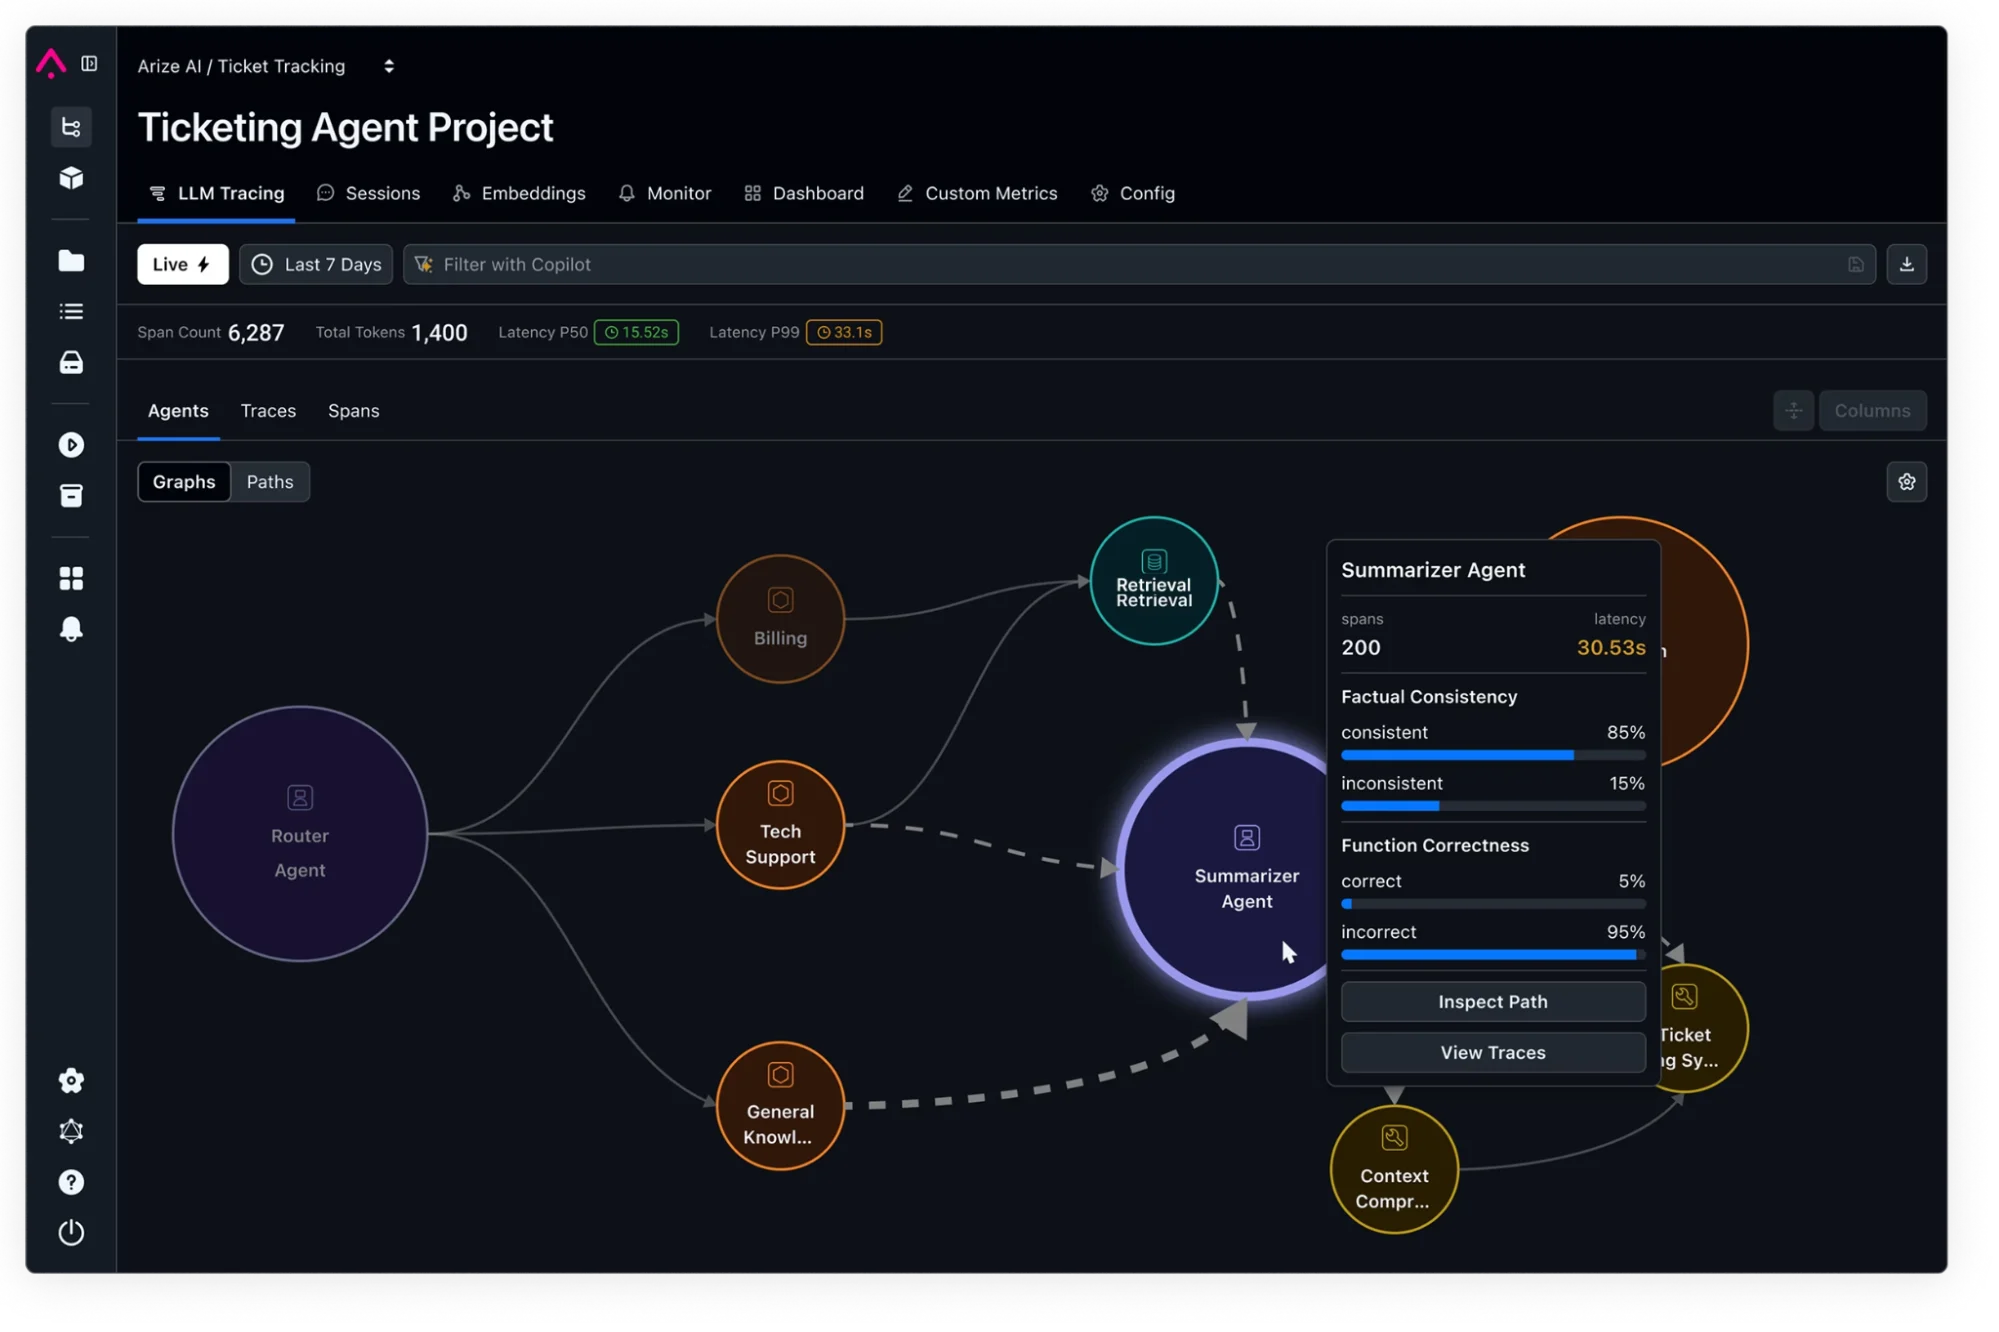
Quality evaluation requires continuous scoring of outputs against ground truth, not pass/fail on status codes. Tools like Arize AI (with their open-source Phoenix framework), LangSmith, Confident AI, and LangFuse were built specifically for this problem. Arize AI observability offers span-level tracing with embeddings analysis; LangFuse has 21,000+ GitHub stars and a self-hostable architecture that appeals to security-conscious teams.
3. Reliability observability
API errors, rate-limit hits, timeouts, provider outages, fallback behavior, retry patterns, and upstream dependency health. AI providers (OpenAI, Anthropic, Google) are third-party dependencies with all the failure modes that implies.
When Anthropic hits capacity on a Tuesday afternoon and your customer-facing chatbot starts returning 429s, reliability observability is what keeps your incident response from starting with “wait, what just happened?” Datadog, Elastic, and traditional APM with AI extensions cover this well.
4. Safety observability
Prompt injection detection, data leakage monitoring, PII exposure, harmful content generation, policy violations, and guardrail effectiveness. This is the security dimension of AI observability, and it becomes critical as agentic AI observability systems operate autonomously. An agent that decides to email customer data to an analytics endpoint is a safety failure invisible to performance dashboards. Fiddler AI handles explainability, bias detection, and guardrail monitoring.
Credo AI covers policy governance. Dynatrace AI observability also extends into this layer through their security analytics integration.
5. Cost observability
Token usage per request, per-model cost attribution, cost per feature, cost per team, cost per customer, budget alerts, anomaly detection on spend, model mix efficiency, and caching effectiveness. This is the pillar most AI observability tools skip entirely. They’ll show token counts in a dashboard. They won’t tell you that your recommendation engine spent $4,200 on Opus last month when Sonnet would have delivered identical results for $1,700. AI cost observability requires connecting AI telemetry to business context; which team, which feature, which customer drove this spend, and that’s a different data model than traces and spans.
CloudZero covers the cost pillar. For enterprise cost attribution across providers, teams, and customers, CloudZero’s CostFormation engine allocates 100% of costs without tags, including the AI workloads that other tools can’t categorize.
Why is cost the missing pillar? Performance, quality, reliability, and safety prevent user-facing failures. Cost prevents financial failures. The first four share a data model (traces, spans, metrics from the engineering layer). Cost observability connects to a different layer entirely (billing data, business context, budget allocations). Different data sources. Different consumers. Different urgency, until the invoice arrives, at which point it becomes everyone’s urgency simultaneously.
That five-pillar model is the complete framework. But to understand why you can’t just extend your existing APM and check the box, the differences between traditional and AI observability need to be concrete.
How Is AI Observability Different From Traditional Monitoring?
Here is a quick table:
|
Dimension |
Traditional observability |
AI observability |
|
What you watch |
Request/response cycles, infrastructure health |
Prompt-completion pairs, model behavior, agent decisions, token economics |
|
How things fail |
Binary: works or doesn’t |
Probabilistic: can be fast, available, and wrong |
|
Cost model |
Infrastructure-based (compute, storage) |
Per-request variable (model × tokens × complexity) |
|
Determinism |
Same input, same output |
Same input, different output every time |
|
Evaluation |
Pass/fail on status codes |
Continuous scoring on quality, relevance, safety |
|
Complexity |
Stateless request handling |
Multi-step reasoning, tool use, autonomous decisions |
The bottom line: gen AI observability and generative AI observability can’t be bolted onto traditional APM as an afterthought. Non-deterministic outputs, per-request variable costs, and multi-step agent reasoning require new instrumentation, new metrics, and new mental models. Traditional APM tells you the infrastructure is running. AI model observability tells you the intelligence is working, or more precisely, tells you when it isn’t, and why.
This gap widens further when AI agents enter the picture. Single model calls are traceable with extensions to existing tools. Autonomous agents that chain dozens of calls, select their own tools, and make decisions without human oversight, that’s a different order of complexity.
What Is AI Agent Observability?
AI agent observability is the fastest-growing subdimension within the field, and the one most likely to catch organizations off guard.
Agentic AI systems (Claude Code agents, Copilot Studio agents, custom LangChain agents) chain multi-step reasoning, make tool calls, and operate autonomously. A standard LLM call has one input and one output. An agent task can involve 5–50 LLM calls, each with different models and token counts, stitched together by autonomous decision logic that nobody reviewed before execution.
Agentic AI observability means tracing not just inputs and outputs but the entire decision path: which tools the agent selected, what it chose not to do, how many reasoning steps it took, and what each step cost.
Agent teams (multiple agents collaborating) can consume 7x more tokens than standard sessions. Without agent-level cost observability, a single runaway agent loop, one that keeps retrying a failed tool call, or decides to index your entire wiki before answering a simple question, can consume a team’s monthly budget in hours. It’s the AI equivalent of a while(true) loop, except instead of pegging a CPU core you’re draining a credit card.
AI agent observability best practices start with three things: trace every tool call and model invocation within the agent’s decision chain, tag each step with cost metadata, and set hard budget caps per agent task. AI agent observability tools like Arize AI and LangSmith handle the tracing layer.
CloudZero’s anomaly detection handles the cost layer, alerting owning teams when an agent’s per-task cost exceeds historical patterns before the spend compounds.
With the pillars defined and the agent dimension covered, the practical question becomes: which tools handle which dimensions today?
Which AI Observability Tools Cover Which Pillar?
No single AI observability platform covers all five pillars. Most enterprise teams assemble a stack, which is fine, you do the same for security, CI/CD, and infrastructure. Here’s how the major tools map to the framework, organized by what they actually do well — not what their marketing pages claim.
1. Performance and reliability (APM vendors extending into AI)
Datadog LLM Observability captures LLM calls as traces within Datadog’s APM platform, token counts, cost estimates, latency, and prompt-response pairs. Datadog AI observability features include consolidated AI telemetry alongside existing infrastructure monitoring.
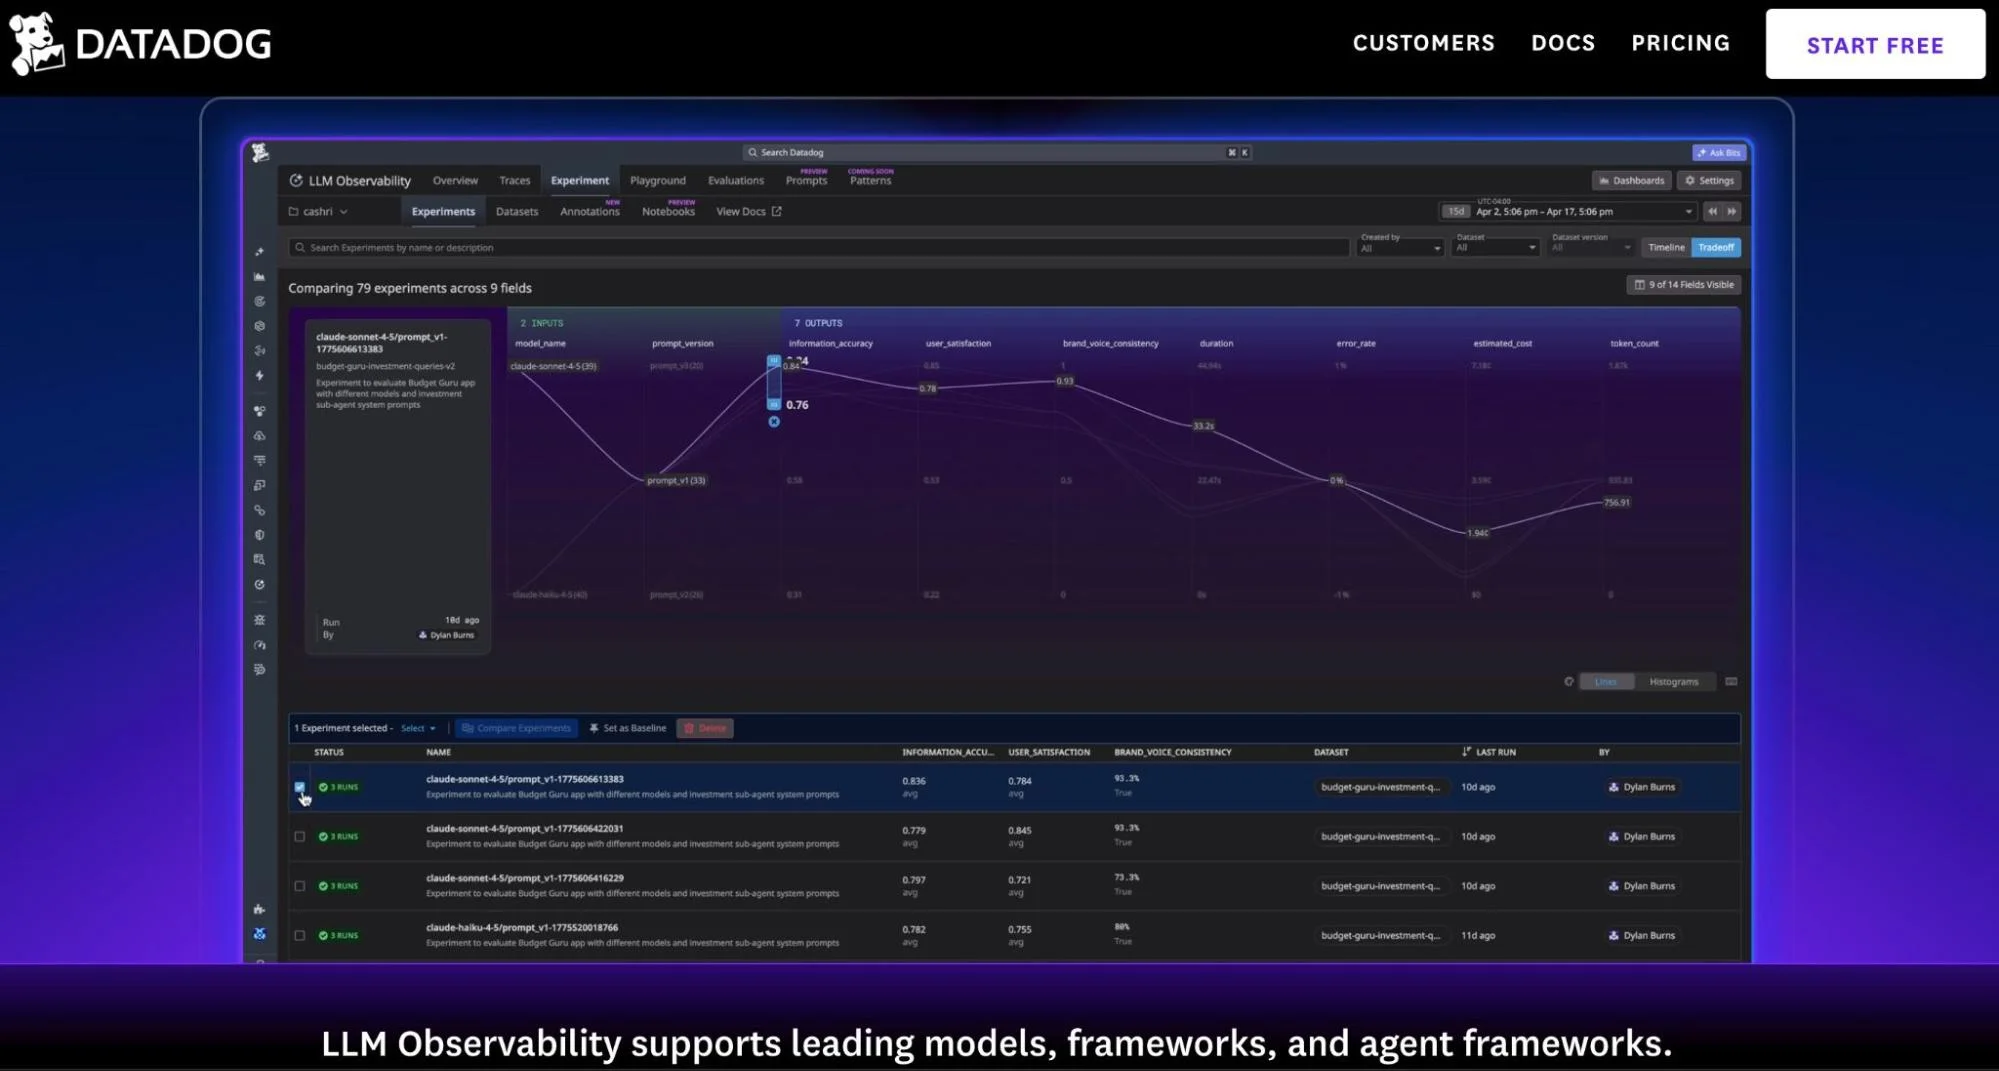
Practical upside: one vendor, one dashboard. Practical limit: quality evaluation is an add-on layer, not a core competency.
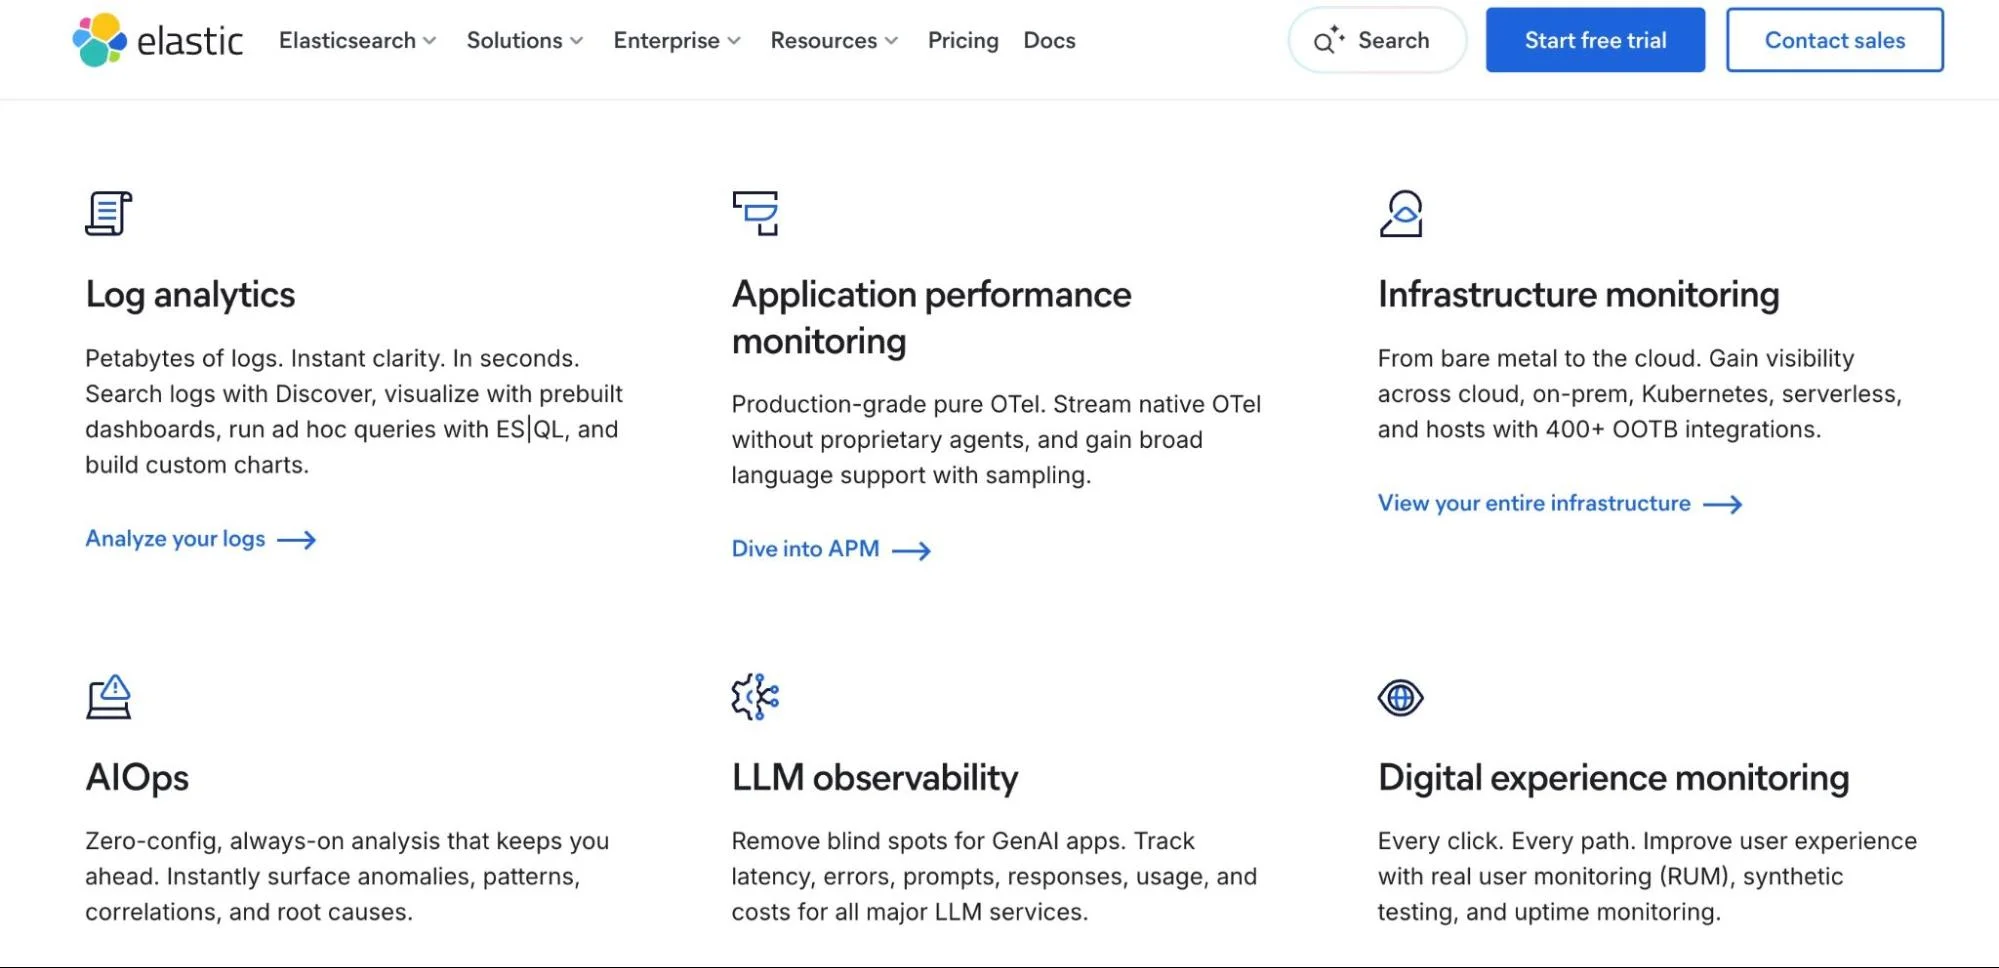
Elastic Observability offers prebuilt dashboards for Azure AI Foundry, OpenAI, Bedrock, and Vertex AI, plus guardrail monitoring. Broad provider coverage. Strong for teams already running the Elastic stack for log analysis. Application monitoring tools extending into AI is the dominant pattern here.
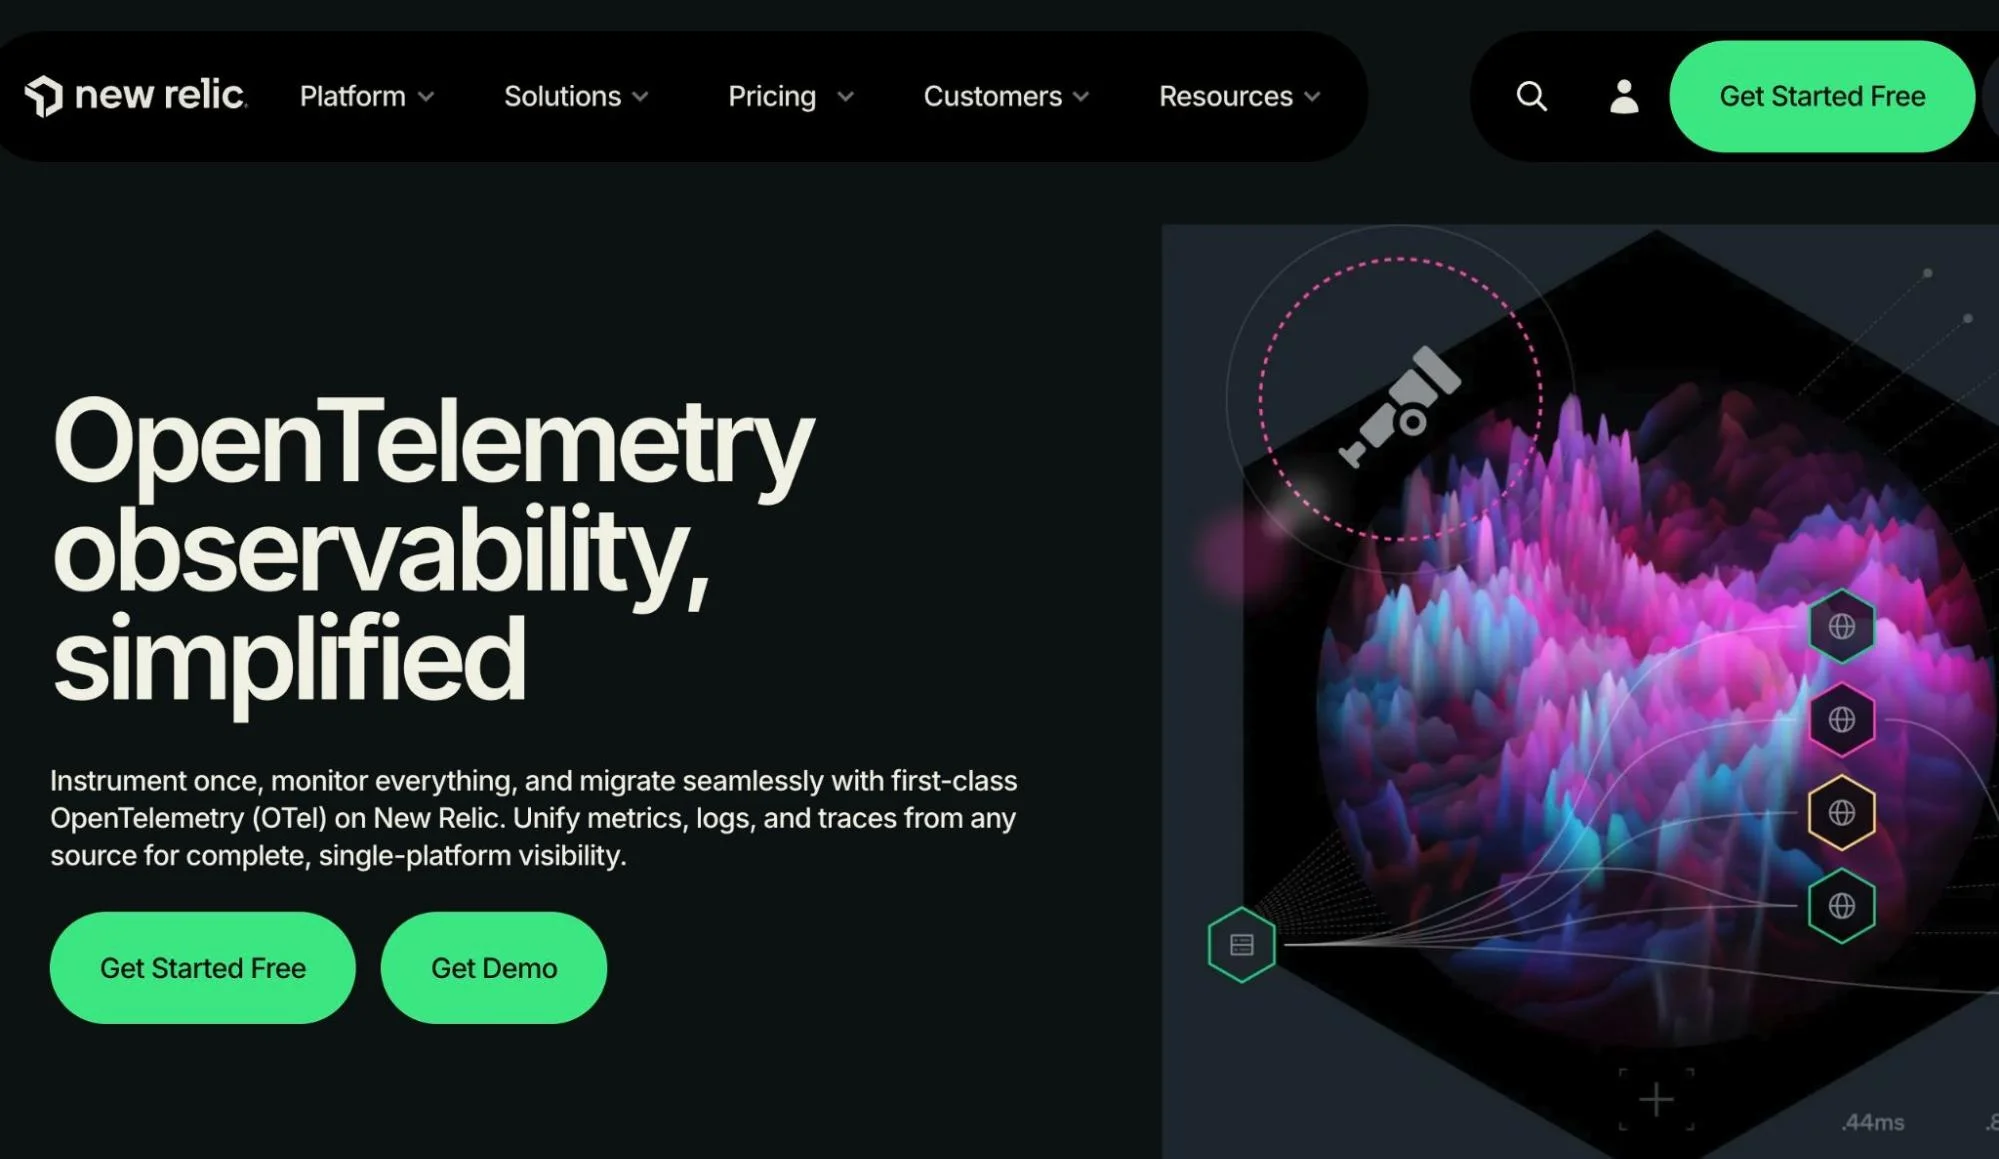
New Relic AI Monitoring takes the OpenTelemetry-based approach, AI tracing within New Relic’s existing platform. Same consolidation thesis as Datadog.
2. Quality and evaluation (AI-native tools)
Arize AI delivers span-level tracing, evaluation scoring, and embeddings analysis with the open-source Phoenix framework. Best for teams that need deep analysis of why a specific response went wrong, not just that it did.
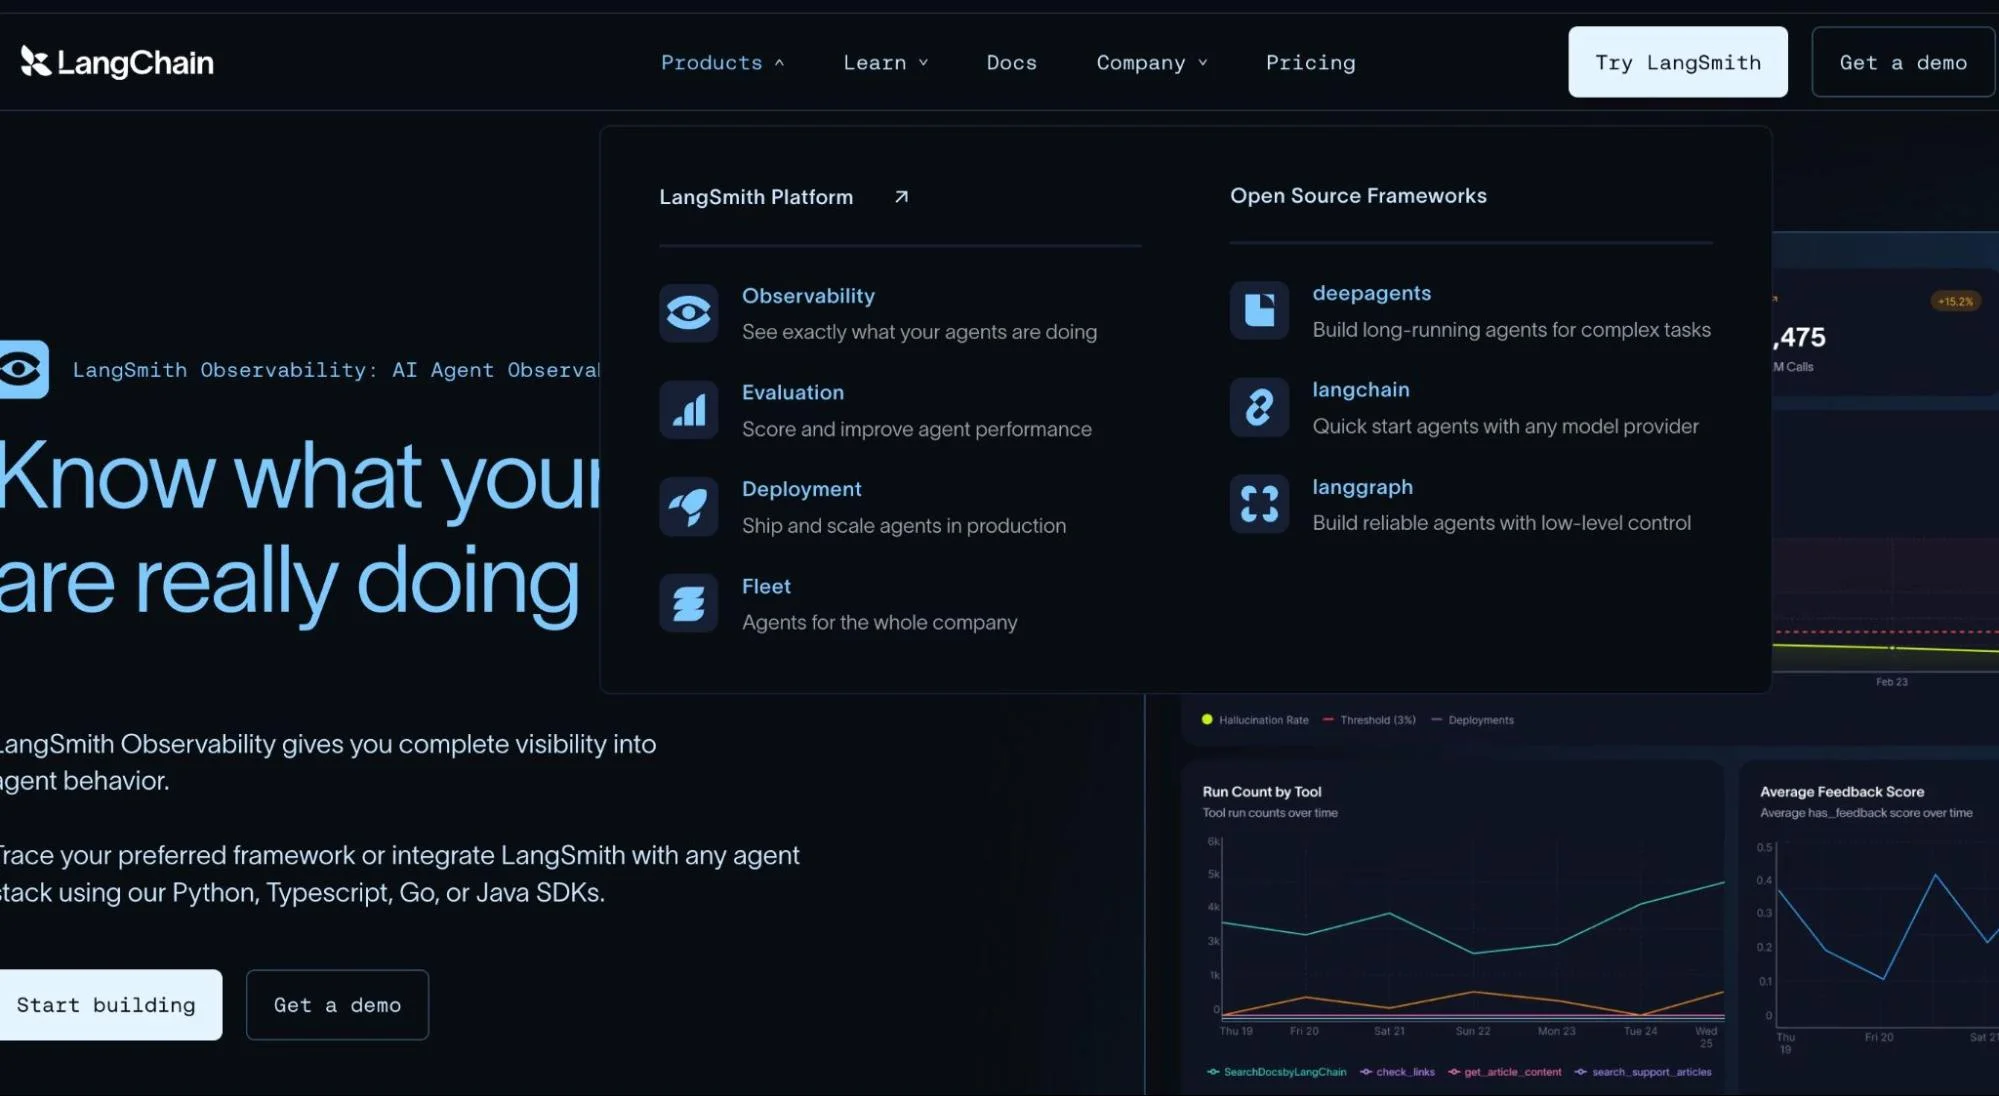
LangSmith from LangChain provides tracing, evaluation, and monitoring with the tightest LangChain integration. Less framework-agnostic than alternatives, strong if you’re a LangChain shop, a consideration if you’re not.
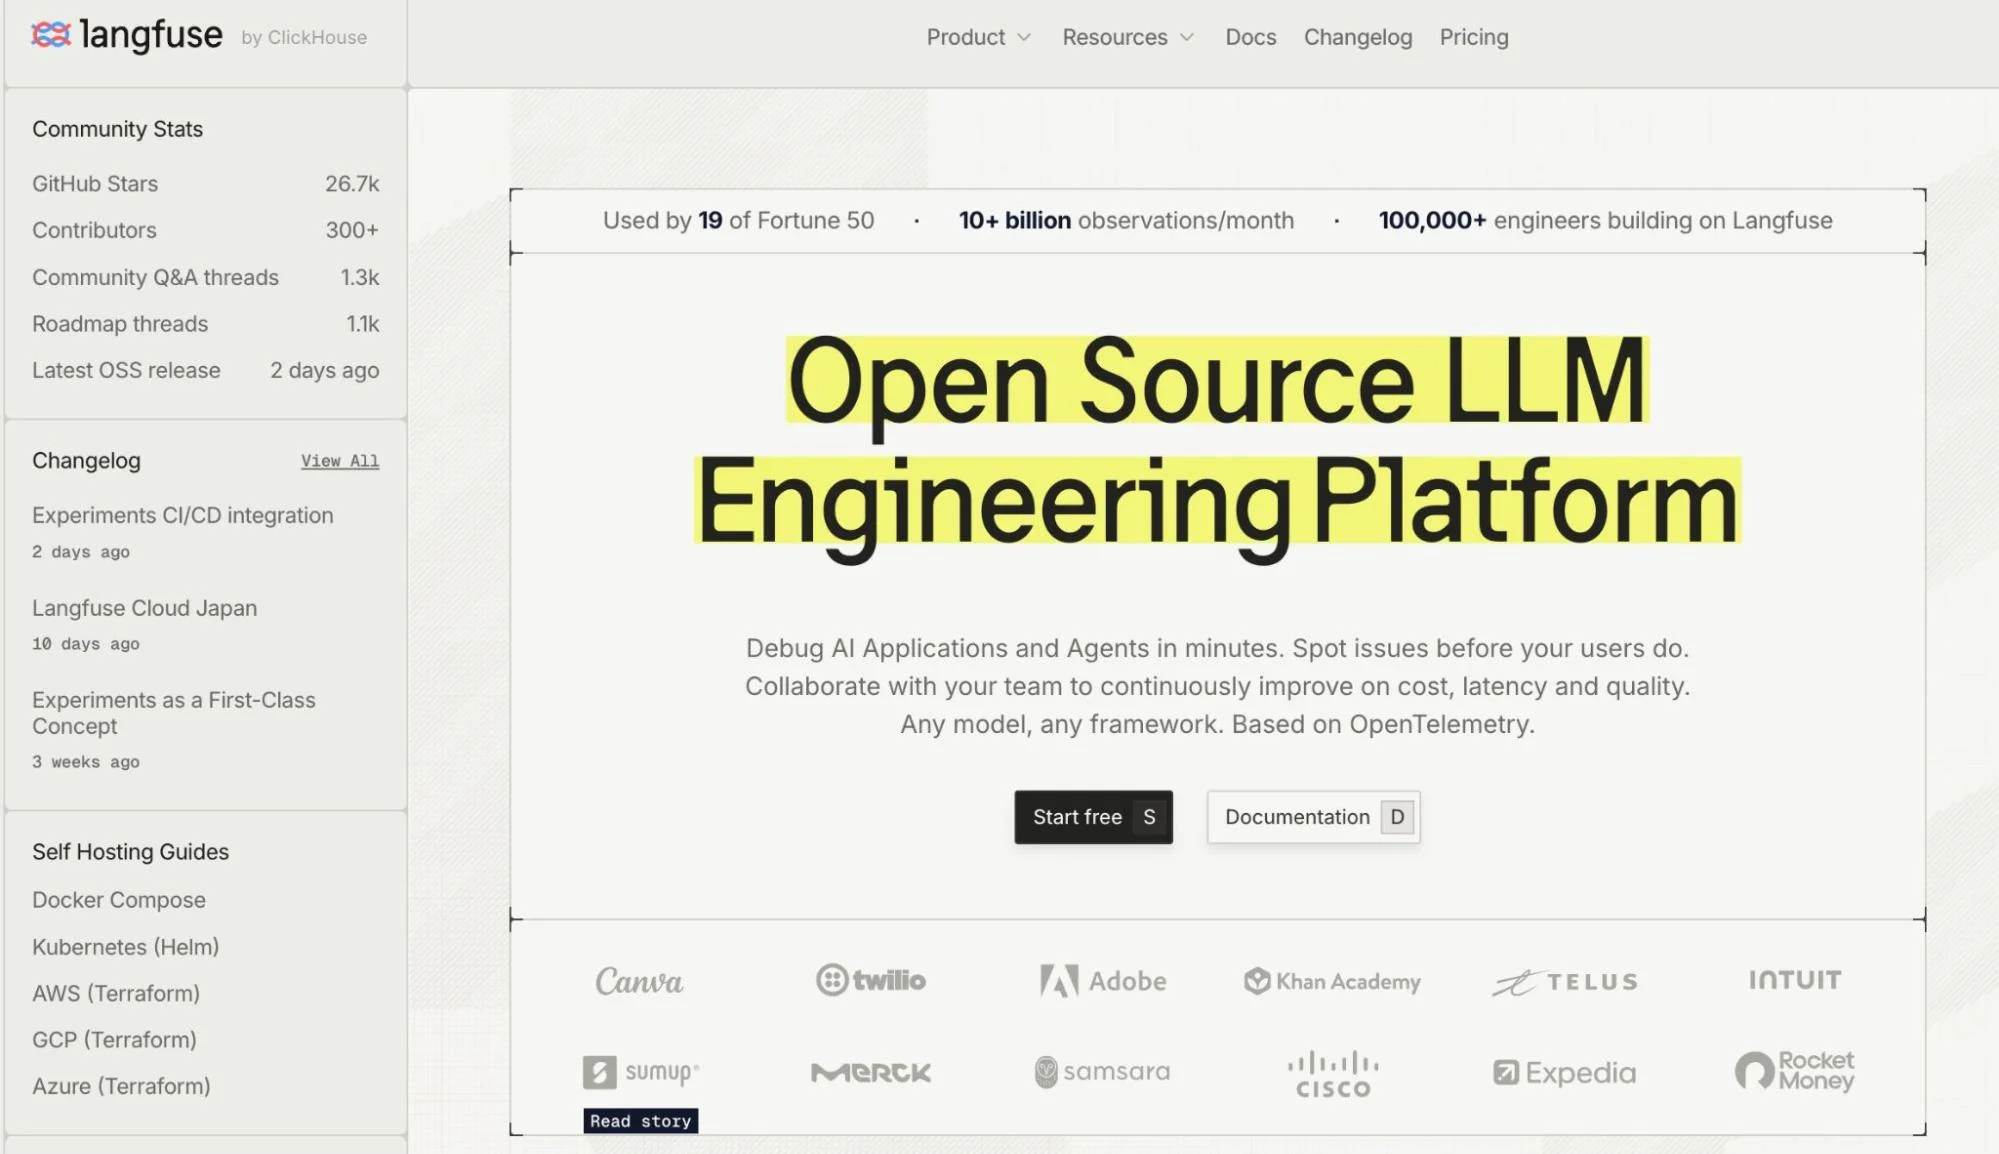
LangFuse is open-source AI observability with token dashboards, request-level cost attribution, and evaluation scoring. Self-hostable. Active community.
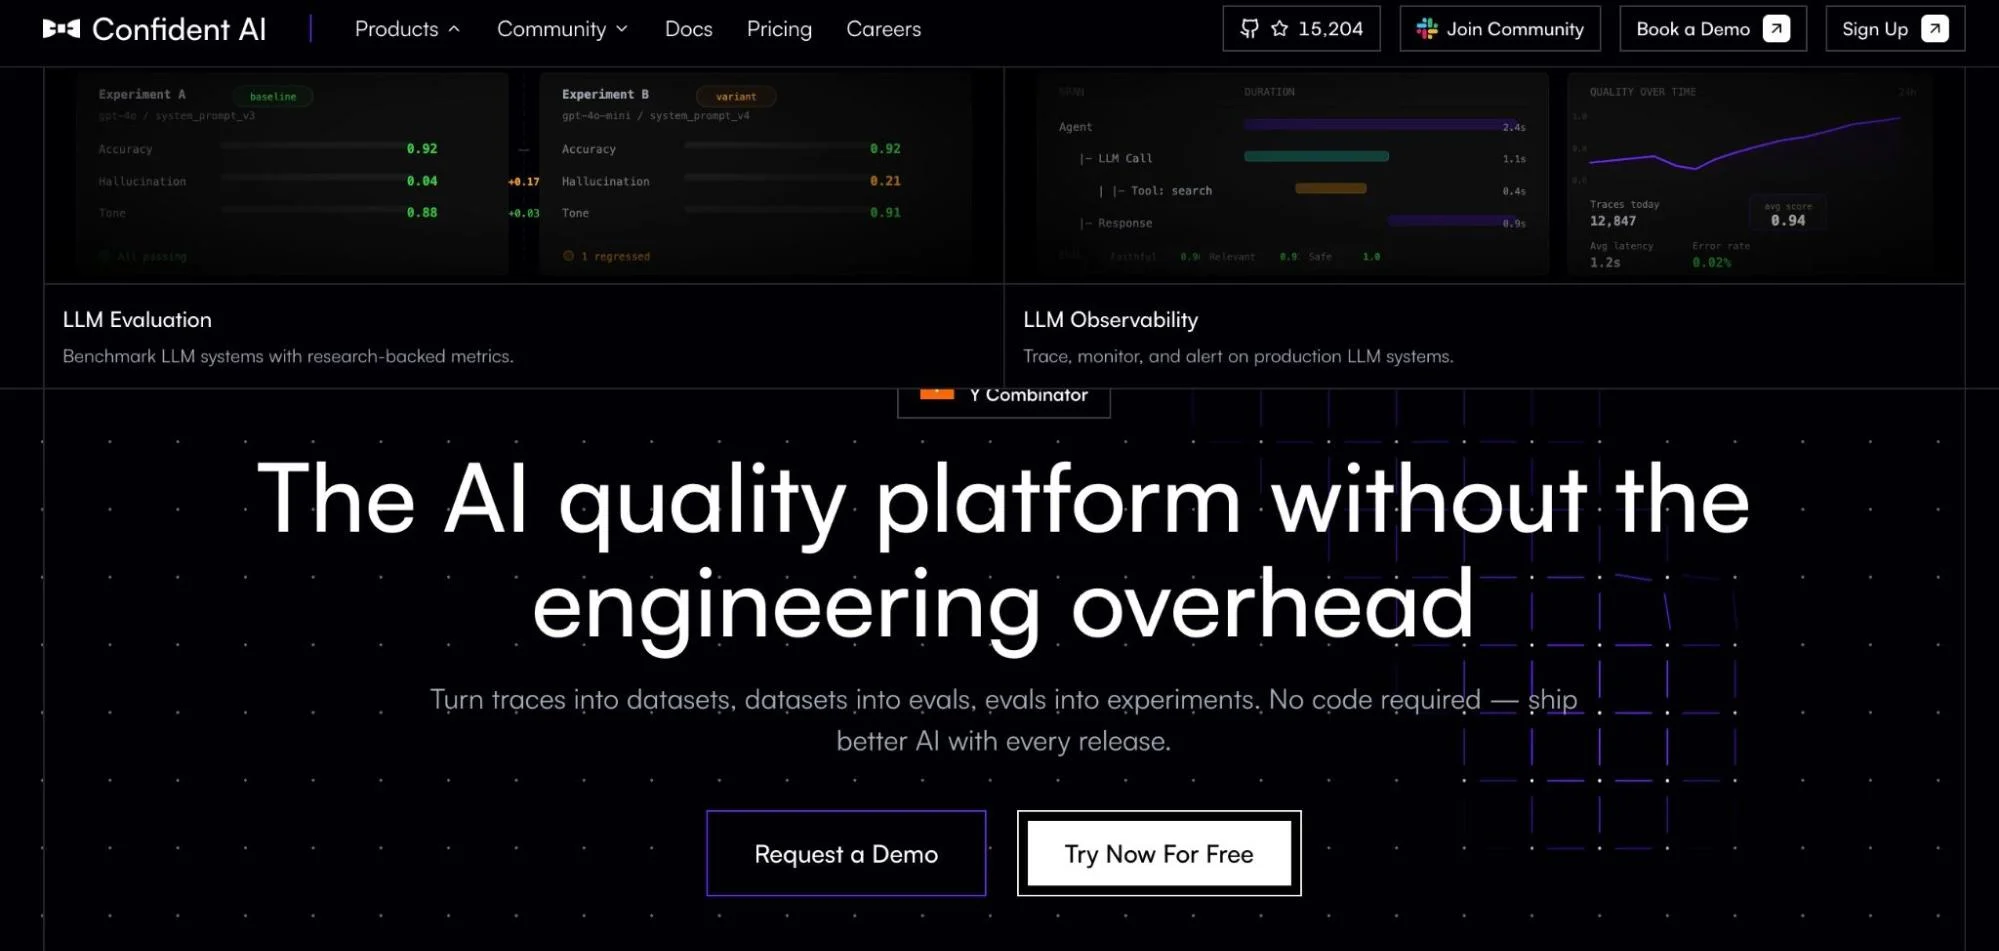
Confident AI takes an evaluation-first approach: 50+ research-backed metrics, quality alerts, and production-to-dataset pipelines. Closes the loop between observing quality problems and fixing them.
3. Safety and governance
Fiddler AI covers explainability, bias detection, drift monitoring, and guardrail effectiveness, the trust layer. Credo AI handles policy governance and compliance.
4. Cost observability
CloudZero covers cost observability across all AI providers, Anthropic (CloudZero was the first cloud cost platform to integrate directly with Anthropic), OpenAI, Azure OpenAI, Amazon Bedrock, and allocates costs by team, project, feature, and customer.

Budget alerts, anomaly detection, model mix optimization, and the CloudZero MCP Server that lets developers query cost data from inside their coding tools. CloudZero also manages over $15 billion in cloud and AI spend for global organizations such as Toyota, Duolingo, Coinbase, Drift, Grammarly, among others.
An AI monitoring observability checklist for any organization should cover at minimum: one performance/reliability tool, one quality/evaluation tool, safety monitoring proportional to your risk profile, and cost observability that connects AI spend to business dimensions. The best AI observability tools are the ones that cover the dimensions most relevant to your risk, and the most common mistake is assuming performance coverage handles everything.
The honest summary: start with the dimension that’s most urgent. Quality problems? Arize or Confident AI. Provider reliability issues? Extend Datadog or Elastic. AI costs growing faster than you can explain them? CloudZero.
Why Cost Observability Is the Pillar Everyone Skips
Here’s a specific example:
Your AI observability stack tells you a customer-facing request took 2.3 seconds and scored 0.87 on relevance. Good numbers. The same request cost $0.47 and served a customer whose plan allows $0.05 per AI interaction. That’s a 9.4x cost overrun, invisible to every tool in your stack except the monthly invoice.
This is not hypothetical. The FinOps Foundation’s 2026 State of FinOps survey — 1,192 practitioners representing $83 billion in annual cloud spend — named visibility into AI costs as the top challenge FinOps teams face. The single most requested tooling capability in the entire survey was granular monitoring of AI spend: tokens, LLM requests, and GPU utilization. The tooling hasn’t caught up to the billing complexity.
Flexera’s 2026 State of the Cloud Report confirms it from a different angle: after five years of decline, wasted cloud spend rose to 29%, driven by cost complexity from AI workloads where pricing is tied to abstract units like tokens and credits that resist traditional forecasting.
Meanwhile, according to CloudZero’s FinOps in the AI Era 2026 report, only 20% of organizations can forecast AI spend within ±10% accuracy and the median Cloud Efficiency Rate has collapsed from 80% to 65%. Organizations are building sophisticated performance and quality observability while essentially guessing at cost.
Cost observability requires five capabilities that performance tools don’t provide. First, per-request cost tagging — every AI call annotated with model, tokens in/out, and computed cost. The telemetry layer for dollars, not milliseconds.
Second, business dimension allocation — cost attributed to team, project, feature, and customer, not just API key. “Your org used 40 million tokens” is a vanity metric. “The recommendation engine costs $4,200/month and 60% is driven by three enterprise customers” is a decision tool.
Third, budget controls that alert before thresholds cross, not after.
Fourth, model mix visibility — which models run where, and is the expensive model actually necessary? Routing tasks from Opus ($25/MTok output) to Sonnet ($15/MTok) saves 40% per request, invisible without inference cost observability.
Fifth, anomaly detection that surfaces cost spikes in real time, not at month-end. One CloudZero customer running 50+ LLMs saved over $1 million by catching anomalies before they compounded.
Performance and quality tools don’t do this because they instrument from the engineering layer (traces, spans, metrics). Cost observability connects to the financial layer (billing data, business context, budget allocations). It’s the same reason your Datadog dashboard doesn’t show your AWS bill allocated by customer; different problem, different data model, different tool.
CloudZero connects AI telemetry to financial context through the CostFormation engine and integrations across Anthropic, OpenAI, cloud infrastructure, and Kubernetes workloads. Upstart saved $20 million through granular cost visibility. PicPay saved $18.6 million. These results came from understanding which spend created value and which didn’t, the “was it worth it?” question that cost observability exists to answer.  to complete your AI observability stack with CloudZero AI cost management.
Frequently Asked Questions About AI Observability


FinOps In The AI Era: A Critical Recalibration
What 475 executives told us about AI and cloud efficiency.