AWS is one of the most popular public cloud platforms, offering over 240 cloud services. Despite the cloud provider’s efforts to make its tools easy to use, managing the vast array of AWS resources and services can be challenging.
For example, AWS environments require continuous monitoring to determine what changes need to be made to reduce costs, improve performance, and secure your systems.
This is where AWS monitoring tools, services, and best practices can help.
In this guide, we’ll share how monitoring in AWS works, some AWS monitoring best practices to apply right away, and the best tools to help you automate continuous monitoring.
What Is AWS Monitoring?
Monitoring in AWS is the continuous process of collecting, visualizing, and tracking health and performance indicators of an AWS environment. Often, the process generates tracking data in real-time, helping you monitor costs, security, performance, and other key metrics and indicators.
Continuous monitoring is one of the key principles of the AWS Well-Architected framework for building a secure and efficient public cloud.
If you’re using CloudWatch, you’ll want to track the right metrics. Here’s a guide to the most important ones.
Modern observability stacks structure visibility around three data pillars:
- Metrics: Quantitative measurements over time — CPU utilization, memory usage, request latency, error rates. These are what CloudWatch collects natively.
- Logs: Timestamped records of discrete events — application errors, API calls, infrastructure state changes. CloudWatch Logs and CloudTrail cover this layer.
- Traces: End-to-end records of a request’s path through distributed services, used to isolate where latency or errors originate. AWS X-Ray handles tracing natively; many third-party tools offer richer trace analysis.
Teams that can correlate all three signals diagnose incidents significantly faster than those relying on metrics alone. If your current monitoring answers “is the system up?” but not “why is it slow?”, a distributed tracing layer is likely the missing piece.
What is the difference between AWS monitoring and observability?
While monitoring focuses on reporting health and performance indicators, observability is about performing a deeper system analysis to determine how issues are occurring.
Additionally, monitoring involves gathering metrics, logs, and events to analyze if an AWS system is functioning as expected. Meanwhile, observability extends beyond tracking.
Observability involves collecting and analyzing various data types from different sources, including traces, logs, and metrics, to identify the root cause of issues. It emphasizes exploring system interactions, identifying the causes and effects of the collected data, and determining how the collected data can be used to predict and influence future behavior and outcomes.
Moreover, monitoring focuses on predefined metrics and logs. This makes it a reactive approach, primarily used for identifying and addressing known issues and involves setting up alerts based on predefined thresholds.
On the other hand, observability aims to understand why systems behave as they do. For example, it uses log analysis to surface an issue’s root cause or predict what could happen next, which is a more proactive approach.
For more, here is our complete guide to the best cloud observability tools.
Report
Finance needs to prove AI’s return: CloudZero report
260 senior finance leaders (more than half CFOs) told us why the speed of seeing AI spend, not the size of it, separates who pulls ahead on AI from who gets burned.
Why Monitor AWS Resources?
The primary goal of monitoring AWS is to ensure your infrastructure and applications always work as expected. Monitoring AWS is beneficial for several reasons:
- Check that your AWS public cloud meets the demands of your workload. You can monitor your infrastructure configuration, application performance, regulatory compliance, and events.
- Easily manage your AWS services by tracking their health in a single platform.
- Detect anomalies in performance, security, and operational excellence.
- Collect, analyze, and implement data-backed insights that have solid business value.
- Maintain regulatory compliance in a cloud environment.
- Trigger automatic actions to correct abnormal situations before they get out of control or affect customer experiences.
- Monitor hybrid clouds and on-premises environments integrated with your AWS public cloud.
- Track the impact of scaling and other engineering decisions on your AWS budget to avoid overspending.
Ultimately, monitoring your AWS environments can help you determine what you need to improve to maximize ROI, performance, and costs.
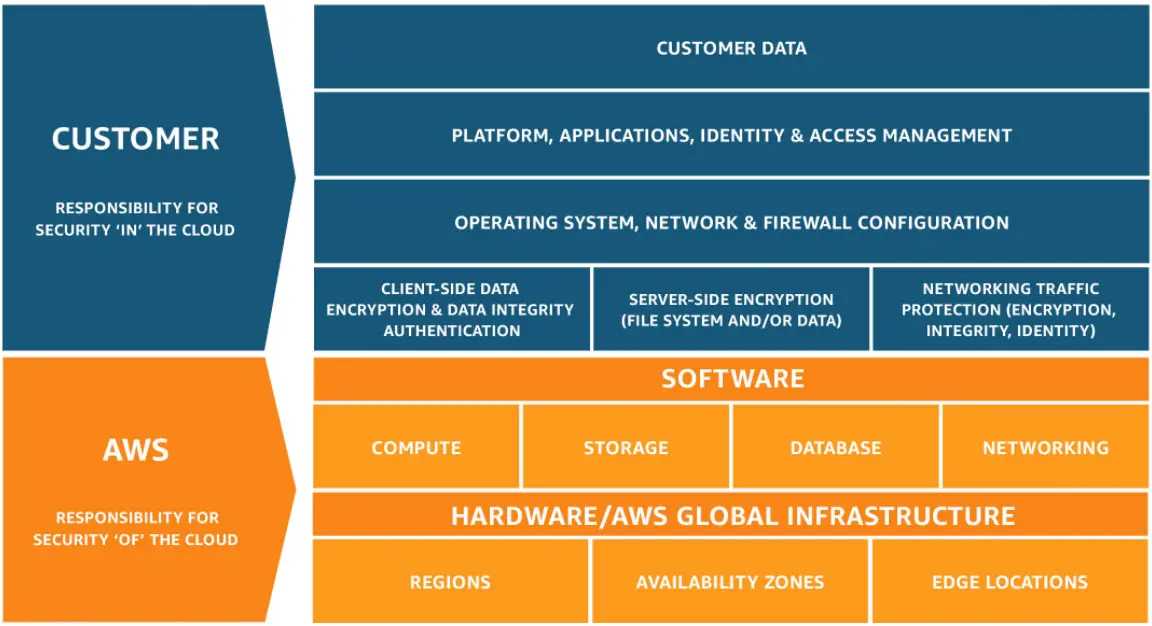
Credit: The AWS Shared Responsibility Model
Shared responsibility involves AWS handling some responsibilities, such as rolling out updates and performance optimization, while you handle others, such as providing additional applications and data security.
What Should Engineering Teams Monitor in AWS?
The AWS platform offers many services that you should and can monitor.
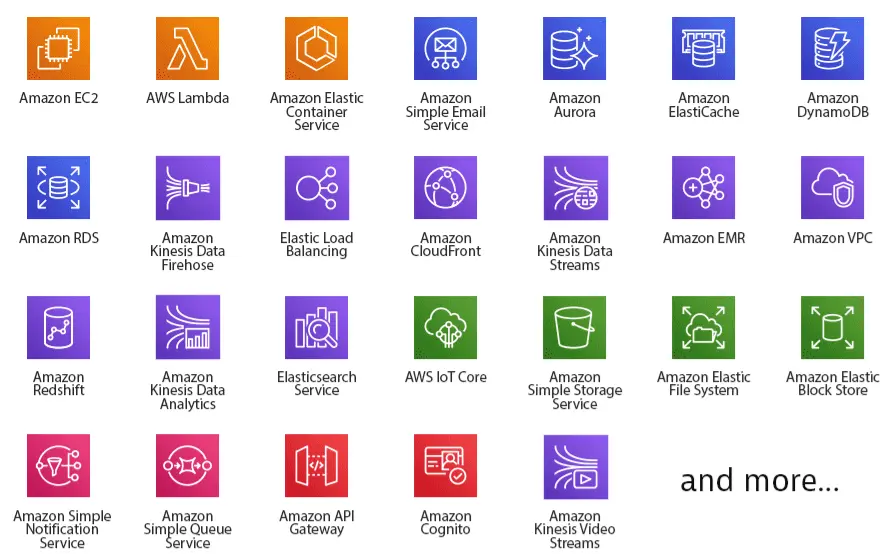
Credit: Dynatrace
To avoid being overwhelmed, you can follow the AWS Well-Architected Framework pillars to understand the right metrics to monitor. For pointers, those pillars include measuring metrics, logs, and traces to help optimize:
- Performance efficiency
- Security posture
- Cost optimization
- Reliability
- Operational excellence
In the following image, you can see some examples of key AWS performance metrics, such as CPU and memory utilization data:
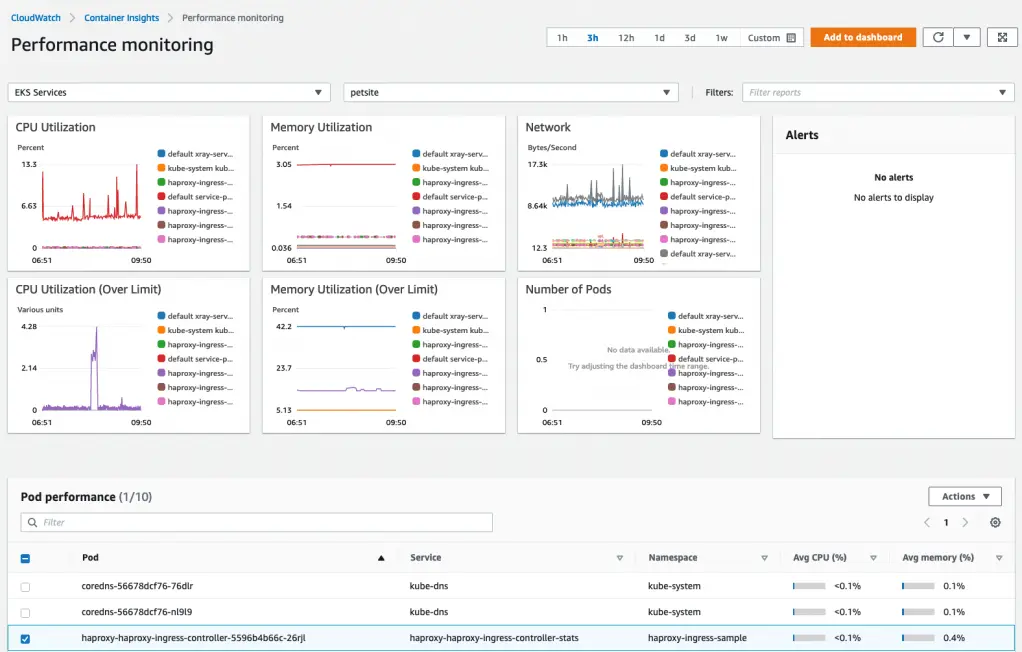
Credit: Amazon CloudWatch Container Insights on AWS console
Based on those guiding principles, here are some resources your engineers should monitor on AWS.
- Unit costs: AWS EC2 instance costs, usage coverage, monthly growth KPIs, daily estimated cost, and Amazon S3 costs by storage class.
- Status check: Reveals detailed information about issues that could affect each of your EC2 instances.
- CPU utilization: Refers to the percentage of allocated compute units you consume. It can help you determine when a CPU is under- or over-utilized, revealing if it’s a bottleneck to performance.
- Memory utilization: Measures memory usage across different AWS services. For example, consistently high memory usage may indicate needing to scale up your memory allocation to improve performance.
- Disk utilization: Helps you determine if the disk volume on your node’s storage capacity is sufficient for your workloads.
- Latency: It refers to the time it takes for a cloud provider to respond to a request from a customer. If you experience high latency, issues with network connectivity, web server dependencies, and backend servers may be the cause. Your application’s performance could suffer, and your AWS costs may increase as a result.
- Swap usage: Describes the disk capacity devoted to holding data that should be in memory. High swap usage degrades application performance, defeating the goal of in-memory caching. Monitor it to prevent that from happening.
- AWS Cost Anomaly Detection: Helps monitor unusual spend in real-time so you can minimize surprise costs.
- Security-related metrics: Some examples of potential security issues may include:
- Multiple instances that start and stop programmatically
- Temporary security credentials that have long lives
- Activity that erases CloudTrail logs
- A new user account that deletes multiple users
You can also use custom metrics for items not covered by native AWS monitoring tools. For example, CloudWatch does not display default memory utilization metrics. However, it supports additional AWS monitoring scripts for that.
Scripts let you report a combination of various metrics, such as memory used/available/utilization, disk used/available/utilization, and swap space used/utilization.
Service-specific monitoring to prioritize
As your AWS footprint grows, service-level monitoring becomes increasingly important:
- AWS Lambda: Track invocation count, error rate, throttles, and cold start duration. Lambda Insights — available through CloudWatch — provides enhanced function-level visibility without additional instrumentation.
- Amazon ECS/EKS: Use CloudWatch Container Insights to monitor cluster-level CPU and memory, task failure rates, and container restarts. At scale, third-party tools with native Kubernetes support provide additional depth that Container Insights alone may not surface.
- Amazon RDS: Watch CPU utilization, free storage space, read/write IOPS, and replica lag. Enable Enhanced Monitoring for OS-level metrics and Performance Insights for query-level analysis that ties slow queries to infrastructure load.
10 AWS Monitoring Best Practices To Apply Right Away
Now that you know what AWS monitoring metrics to watch, here are some key AWS monitoring best practices to help you mitigate risk and maintain optimal performance in the public cloud.
1. Define monitoring goals and set priorities
Identify the most important AWS components to monitor according to your business goals. Your plan will need to define:
- What resources to monitor and why
- Who in your organization will monitor your AWS cloud resources
- Which AWS accounts to monitor
- Any regulatory compliance you need to monitor
- What monitoring tools to use instead of legacy agents
- Metrics you want to monitor in AWS
- The steps to follow if something goes wrong
A clear monitoring plan helps your engineers have the information they need to make the right decisions.
2. Monitor everything you possibly can
Let nothing slip by. It is essential to have complete visibility of your AWS environment. The more data you collect from all your AWS services, the easier it will be to detect, troubleshoot, and debug issues before they become costly failures. CloudHealth and CloudWatch are two popular options for this — here’s how they compare.
How do you do that? This next best practice will make it easier for you.
3. Start with native AWS monitoring tools
Get started monitoring your AWS cloud by activating native AWS services like CloudWatch, CloudTrail, and VPC Flow Logs. This will give you time and space to digest how various data flows in and out of your AWS environments.
Afterward, you can adopt more advanced tools to measure more detailed AWS metrics, like cost per customer or feature.
4. Automate, automate, automate
Monitoring your AWS environment manually can be time-consuming, error-prone, and easy to overlook crucial metrics. Instead, you want to automate AWS monitoring to tools that do it programmatically with minimal errors.
5. Resolve issues before they become major problems
Most organizations set up AWS monitoring but cannot follow up when they should be continuously doing so. Don’t forget that your AWS environment is continuously changing, and you don’t want those changes to adversely affect customer experience or application performance when you can prevent it.
6. Add owner tags to instances
Tagging the users who create instances in your organization will increase accountability. One way to accomplish this is to write a Lambda script that attaches owner tags to all instances. The script will have the instance creator’s value as the IAM username and the key as the owner.
In the event of an incident, the setup will create a notification with the following details:
- Owner tag
- Name tag
- Resource ID
- Launch time
- Resource name
In addition, you can configure the setup to collect other metrics. For example, you can create a Responsible, Accountable, Consulted, Informed (RACI) Matrix to determine who is responsible for what and what requires troubleshooting.
If you’re unsure where to start, this AWS tagging strategy guide lays it all out.
7. Monitor costs
Companies that treat cost as a first-class metric are more likely to optimize their AWS cloud costs than those that don’t. Proactively monitoring costs also promotes a cost-conscious culture, encouraging engineers to develop cost-saving solutions without compromising system performance.
Unless you monitor your AWS costs, you risk receiving unexpected bills every billing cycle. Instead, consider using an AWS cost monitoring tool to track how your engineering choices lead to cloud waste so you can change that.
8. Map AWS monitoring metrics to people, products, and processes
Link metrics generated from your AWS environment to the people, products, and processes that generate them. This will help you pinpoint exactly who, what, or why you are experiencing performance, cost, or other issues.
The result? By identifying root causes quickly, you can reduce the time it takes to respond, repair, and optimize your AWS operations. In addition, you can work with those involved to prevent similar incidents from occurring in the future.
The tools section below shares some valuable services that will help you achieve this level of granularity in AWS.
9. Continuously monitor AWS resources
Monitoring in AWS isn’t something you want to set up once and then forget about. Instead, you’ll want to continually monitor what recent changes are occurring in your AWS public cloud and how they affect customer experiences and cloud costs.
For example, monitoring Amazon EC2 instances continuously can help you determine whether Auto-Scaling boosts performance at peak usage to boost performance and whether it scales down during off-peak periods to lower costs.
Revisit alert thresholds regularly and resist treating static percentage-based thresholds as permanent fixtures. A CPU spike that looks alarming at 80% in isolation may be entirely expected during peak load — static thresholds generate noise, and alert fatigue is how monitoring programs quietly fail.
CloudWatch Anomaly Detection uses machine learning to establish dynamic baselines, generating alarms that adapt to your workload’s historical patterns rather than fixed values. This approach dramatically reduces false positives while preserving sensitivity to genuine anomalies.
For alert routing, configure Amazon SNS to send high-severity notifications directly to on-call engineers while lower-priority signals queue in a shared Slack channel or team dashboard. This distinction keeps engineers responsive to critical pages rather than filtering through noise.
10. Capture logs
Logging refers to recording, tracking, and storing data about events and messages occurring in an operating system or between components and users to support application availability. It also shows how state transformations affect app performance. Capturing logs can help monitor compliance with regulations and troubleshoot performance issues.
CloudWatch and CloudTrail both let you capture and report logs for further analysis. However, if you want more robust search and aggregation capabilities, try a log analysis tool like Loggly by SolarWinds.
Now, speaking of tools.
What Are The Best AWS Monitoring Tools Right Now?
You can monitor AWS resources natively or with third-party tools. Automating monitoring can save your team time, money, and effort.
The best AWS monitoring tools harness Artificial Intelligence (AI) and Machine Learning (ML) models to monitor any app or stack at any scale from anywhere. Their visual, well-organized dashboards also allow you to visualize, analyze, and understand your AWS stack.
Consider the following.
1. Amazon CloudWatch – Native AWS monitoring service
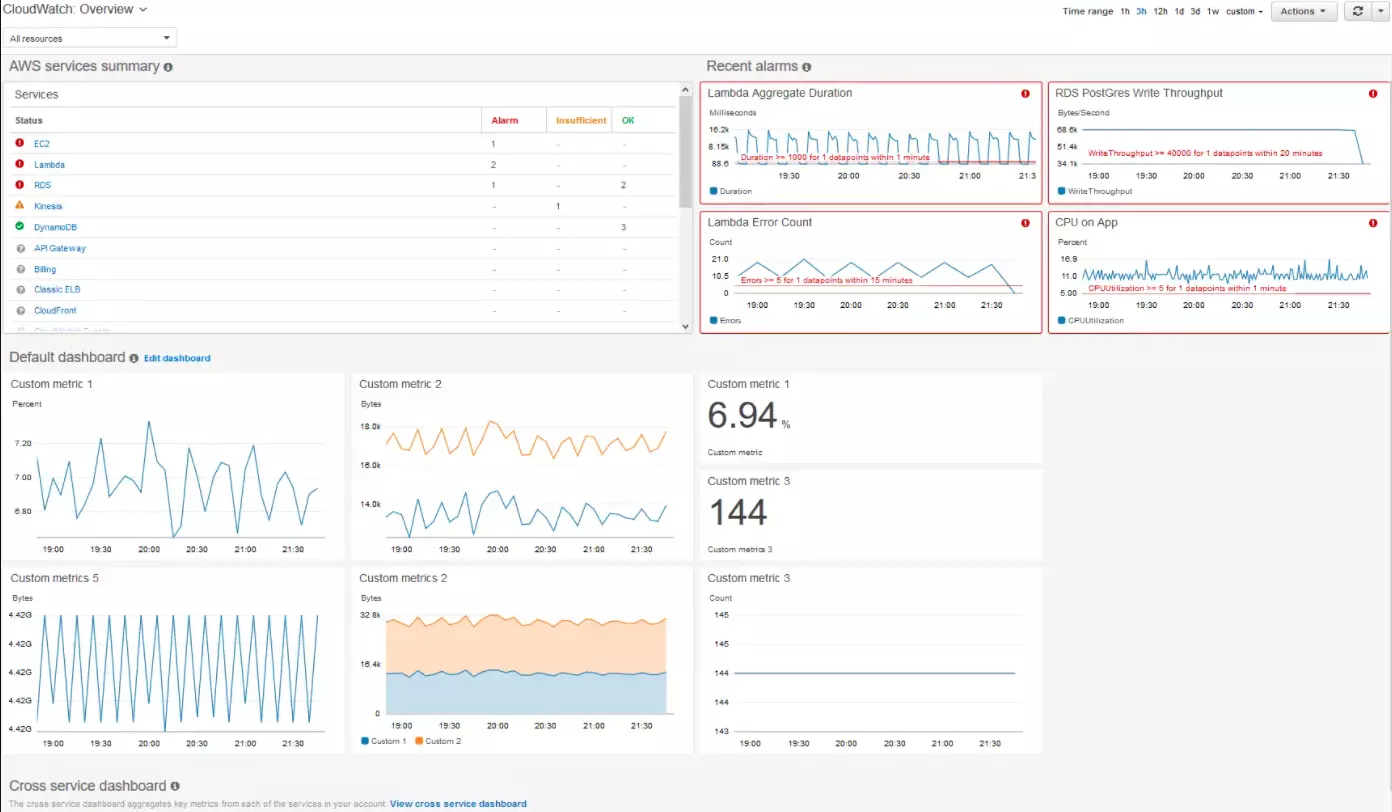
Amazon CloudWatch enables you to monitor and manage your AWS, on-premises, and hybrid cloud applications and architecture. CloudWatch is Amazon’s default observability service for developers, DevOps engineers, IT managers, and site reliability engineers (SREs).
It collects, visualizes, and reports metrics, logs, and events from services, applications, and other resources running on the AWS platform and on-premises servers.
CloudWatch lets you monitor anomalous behavior, understand metrics and logs side by side, set alarms, troubleshoot issues, and take automated actions without disrupting your workflow.
2. Amazon CloudTrail – Native AWS monitoring tool
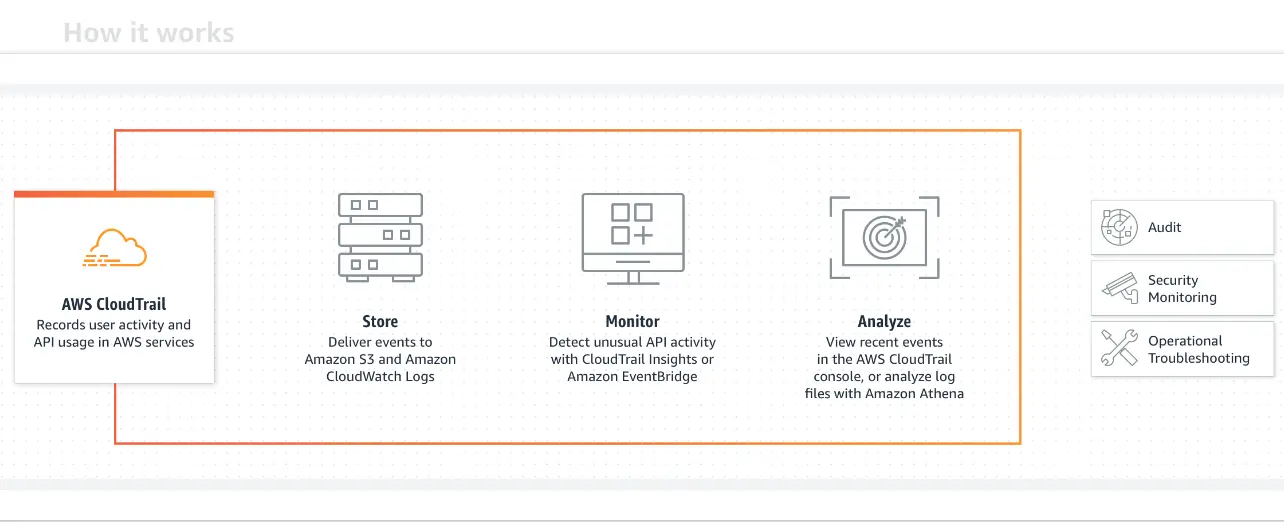
CloudTrail helps you track API calls and user activity across your AWS infrastructure. That includes actions that a user, role, or an AWS service takes. CloudTrail records the activity as events.
Actions taken via the AWS Management Console, AWS SDKs, AWS Command-Line Interface, and APIs are examples of CloudTrail Events.
Some CloudTrail uses include recording policy changes on Amazon S3 storage, providing audit reports for compliance management, revealing state changes in EC2 instances, and identifying changes to Identity and Access Management users and groups.
3. AWS Security Hub – AWS security monitoring tool
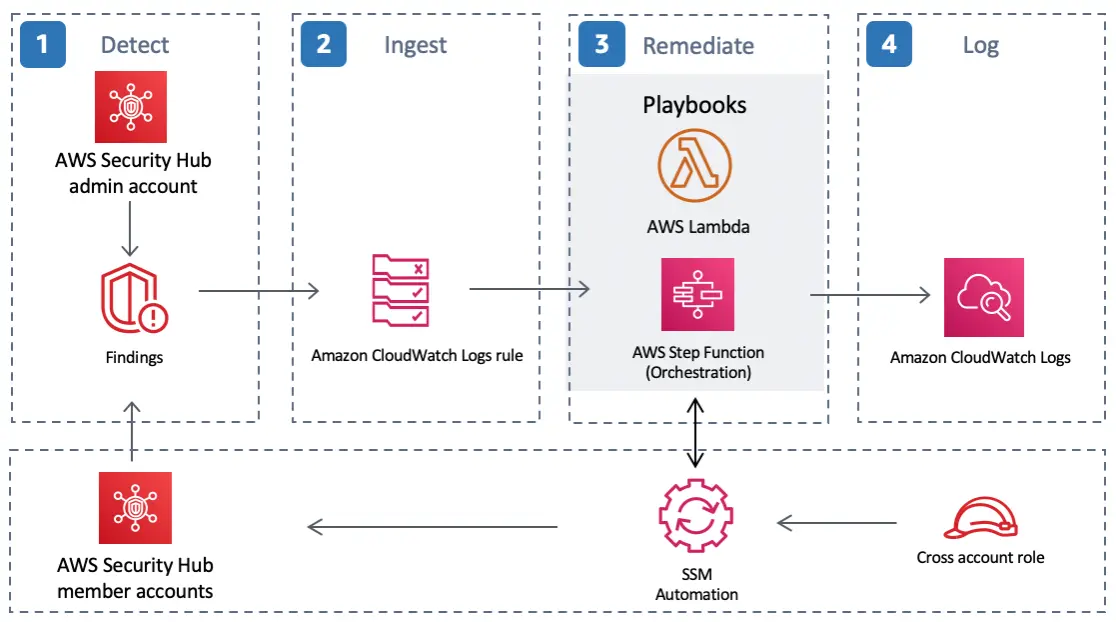
This AWS native service provides a central place for aggregating security alerts and data from the entire range of AWS security services and apps. For example, the AWS Security Hub can pull insights from AWS GuardDuty, Amazon Macie, and Amazon Inspector, inspect them, and automatically report suspicious behavior.
Then, you can use a custom dashboard to prioritize and organize the issues you find.
4. Amazon Inspector – AWS vulnerability management
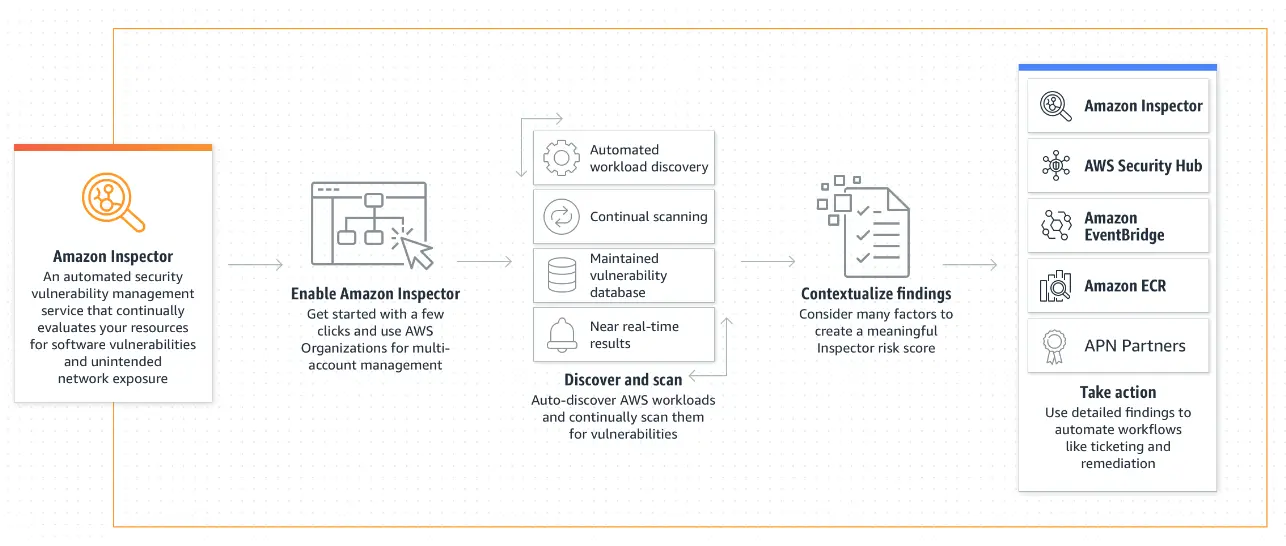
With AWS Inspector, you get a native AWS tool to help you detect, prioritize, and automate vulnerability management at any scale. The tool does this by continuously ingesting and analyzing data from over 50 sources and scanning your workloads.
Also, Amazon Inspector scans support compliance standards and best practices for industry standards, such as PCI DSS and NIST CSF.
5. AWS Certificate Manager
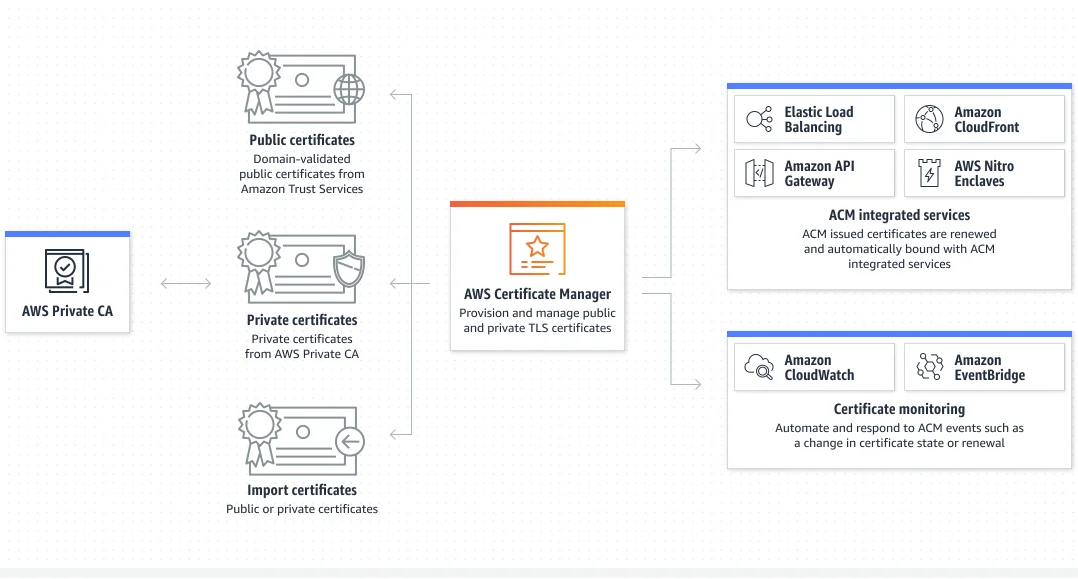
AWS Certificate Manager streamlines the provisioning, managing, and deploying of public and private Secure Sockets Layer/Transport Layer Security (SSL/TLS) certificates for your AWS-based websites and applications.
It tracks certificate expiration dates and can send notifications to ensure certificates are renewed in time. This helps prevent website or app downtime due to expired certificates.
The certificate manager also automates certificate renewals, reducing manual monitoring effort. For this, AWS Certificate Manager integrates with other AWS services like Elastic Load Balancing, Amazon CloudFront, and API Gateway.
6. Amazon EC2 Dashboard
The Amazon EC2 Dashboard is an essential component of the AWS Management Console. It offers detailed monitoring and management capabilities for EC2 instances. You can use it to view and manage instance states, performance metrics, and health statuses, which are essential for optimal operation.
The dashboard enables security oversight through virtual firewalls known as security groups. It also supports Elastic IP addresses for network monitoring. The Amazon EC2 Dashboard integrates with Amazon CloudWatch for detailed metrics like CPU utilization and network usage.
Additionally, the EC2 Dashboard helps with tagging resources, shows insights into storage usage with Amazon EBS volumes, and supports cost optimization and scalability through auto-scaling and load-balancing features.
11 Third-party Tools For AWS Monitoring And Observability
The tools in this section provide even deeper monitoring data, including per-unit and multi-cloud insights.
Software and pricing information last verified April 2026. Features, pricing, and availability may have changed. Please verify current details with vendors before making purchasing decisions.
1. CloudZero – Best for cloud cost monitoring and optimization
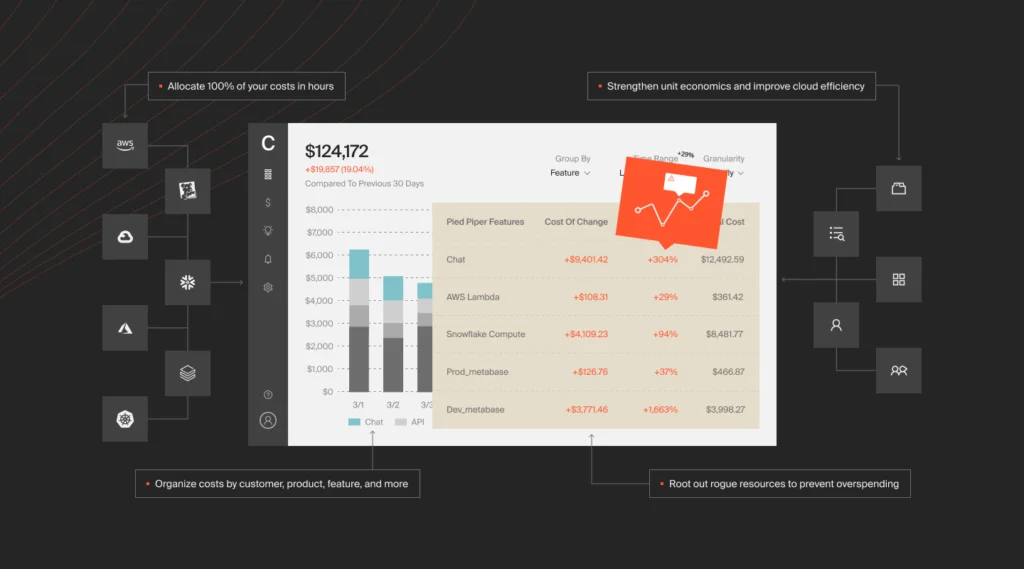
CloudZero’s cloud cost intelligence platform helps you understand why, who, and what drives your cloud costs. With CloudZero, you can view costs across all your services in real-time, including tagged, untagged, untaggable, and shared resources.
You get:
- Hourly cost insights — not once every 24 hours — so you’re always in control.
- Real-time cost anomaly detection with timely alerts so you can fix potential overspending.
- A single source of truth for your cloud costs, minimizing cost visibility gaps. View costs across clouds (AWS, Azure, GCP, Oracle Cloud) and platforms (Kubernetes, Snowflake, Datadog, MongoDB, New Relic, and more).
- Engineering-Led Optimization (ELO) that helps align your engineers with finance and FinOps to design and implement cost-effective solutions.
- Your very own Certified FinOps Practitioner to help you get started and make the most of your cloud investments in weeks, not years.
2. DataDog – AWS/Azure hybrid cloud monitoring
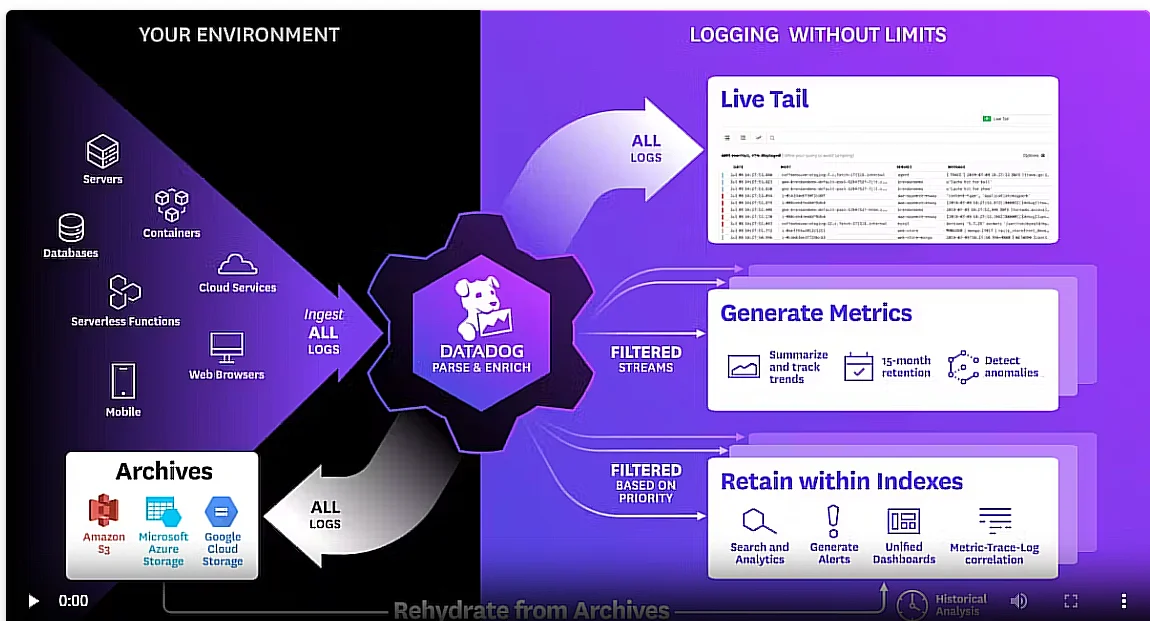
DataDog might be an ideal option if you are looking for a tracking tool that monitors AWS and Azure in a single place. It can monitor servers, apps, metrics, clouds, and even teams across full DevOps stacks. DataDog can also monitor security, network, performance, real users, and incidents in your AWS or hybrid environment.
Datadog offers over 600 integrations — including a deep AWS integration that pulls CloudWatch metrics in real time — alongside full-stack APM, log management, synthetics, and security monitoring in a single platform. Datadog Watchdog, its ML-powered anomaly detection engine, surfaces performance irregularities without requiring manual threshold configuration. Metric retention defaults to 15 months, which is useful for capacity planning and year-over-year trend analysis.
3. Grafana – Visualization layer for engineering teams on AWS
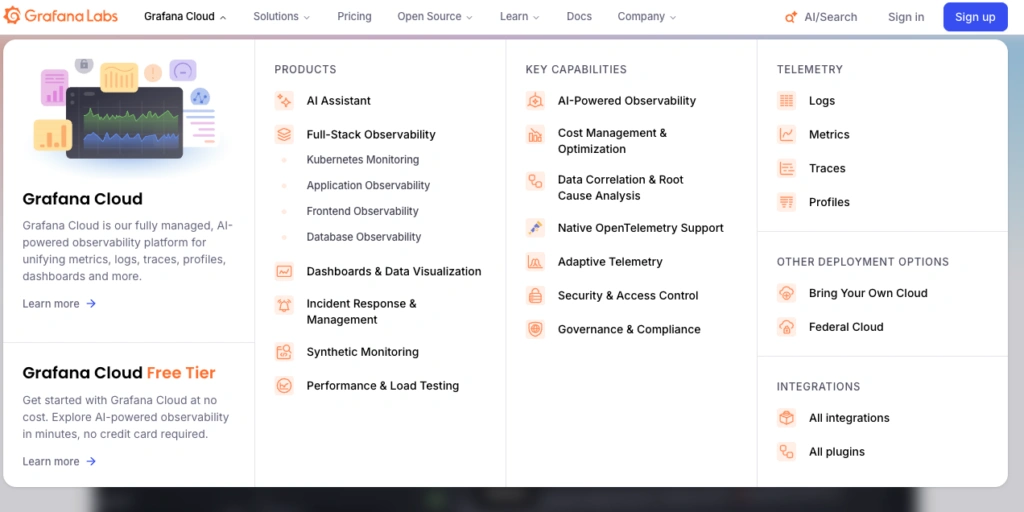
Grafana is the monitoring platform that has become the default visualization layer for engineering teams on AWS. Its open-source core is free and self-hostable; Grafana Cloud offers a managed SaaS option with a generous free tier. On AWS, Grafana connects directly to CloudWatch, Prometheus, and Loki — letting you consolidate metrics, logs, and traces into unified dashboards without replacing your existing data sources. Grafana Alerting supports multi-condition rules, PagerDuty and SNS routing, and silence policies for planned maintenance windows. For teams that want observability flexibility without vendor lock-in, Grafana is one of the strongest starting points available.
4. Paessler PRTG – Network monitoring
With PRTG Network Monitor, you can monitor any device, system, app, or traffic across all your IT infrastructure. You can also monitor your local network and all cloud services from anywhere, determine how much bandwidth the apps are using, and identify sources of bottlenecks.
It can integrate with various monitoring technologies and comes with great visuals to boost productivity.
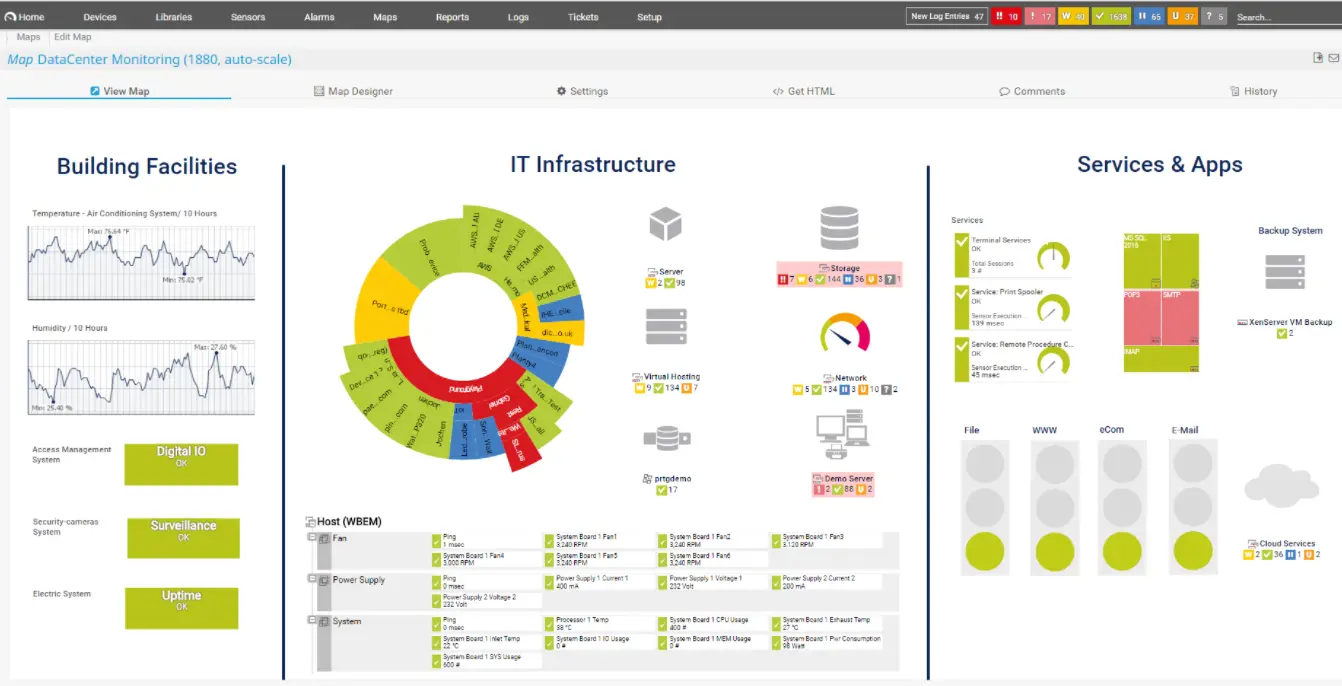
5. Opviews – Business service monitoring on AWS
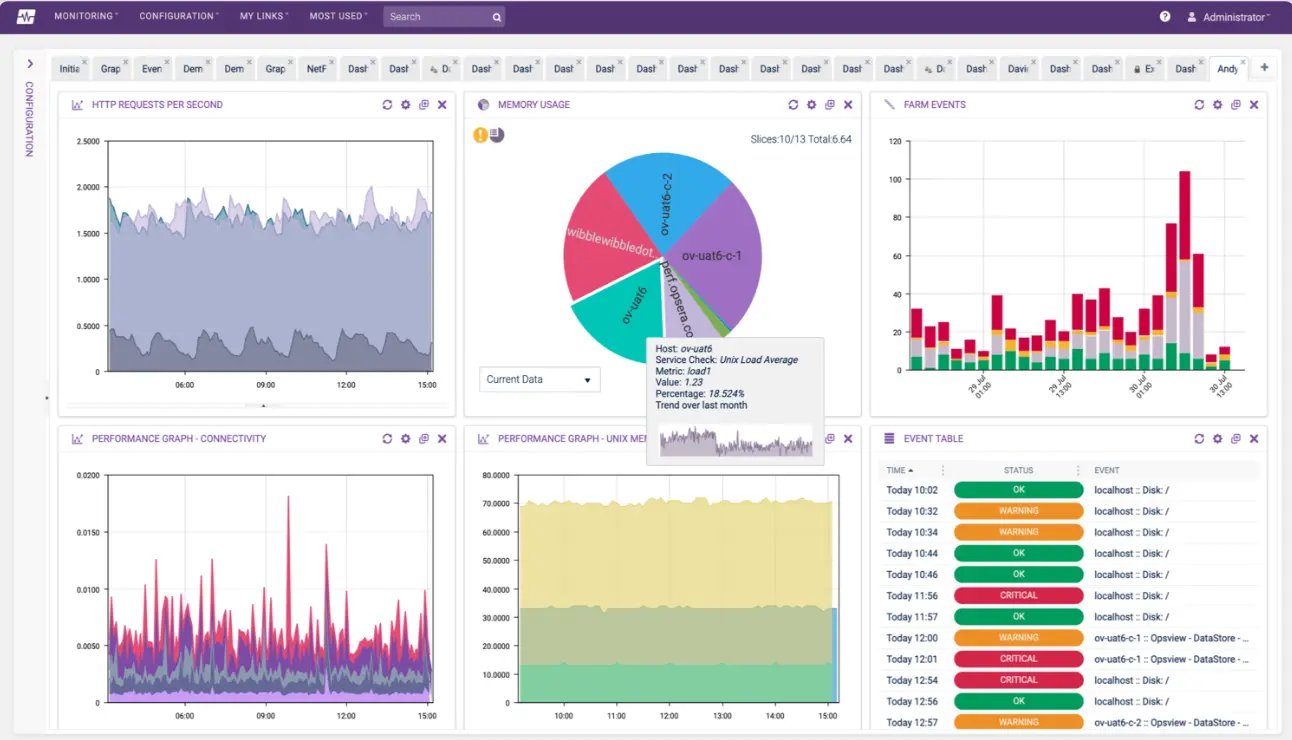
ITRS Groups’s Opsview monitors apps, operating systems, virtual machines, databases, and even containers in AWS and Azure deployments. For AWS specifically, Opsview helps monitor eight AWS services, including Amazon EC2, Amazon ELB, and Amazon S3 resources.
Also, Opsview offers over 4,500 plugins that you can integrate to increase your AWS monitoring scope and depth.
6. Dynatrace – Cloud-native and hybrid cloud monitoring service
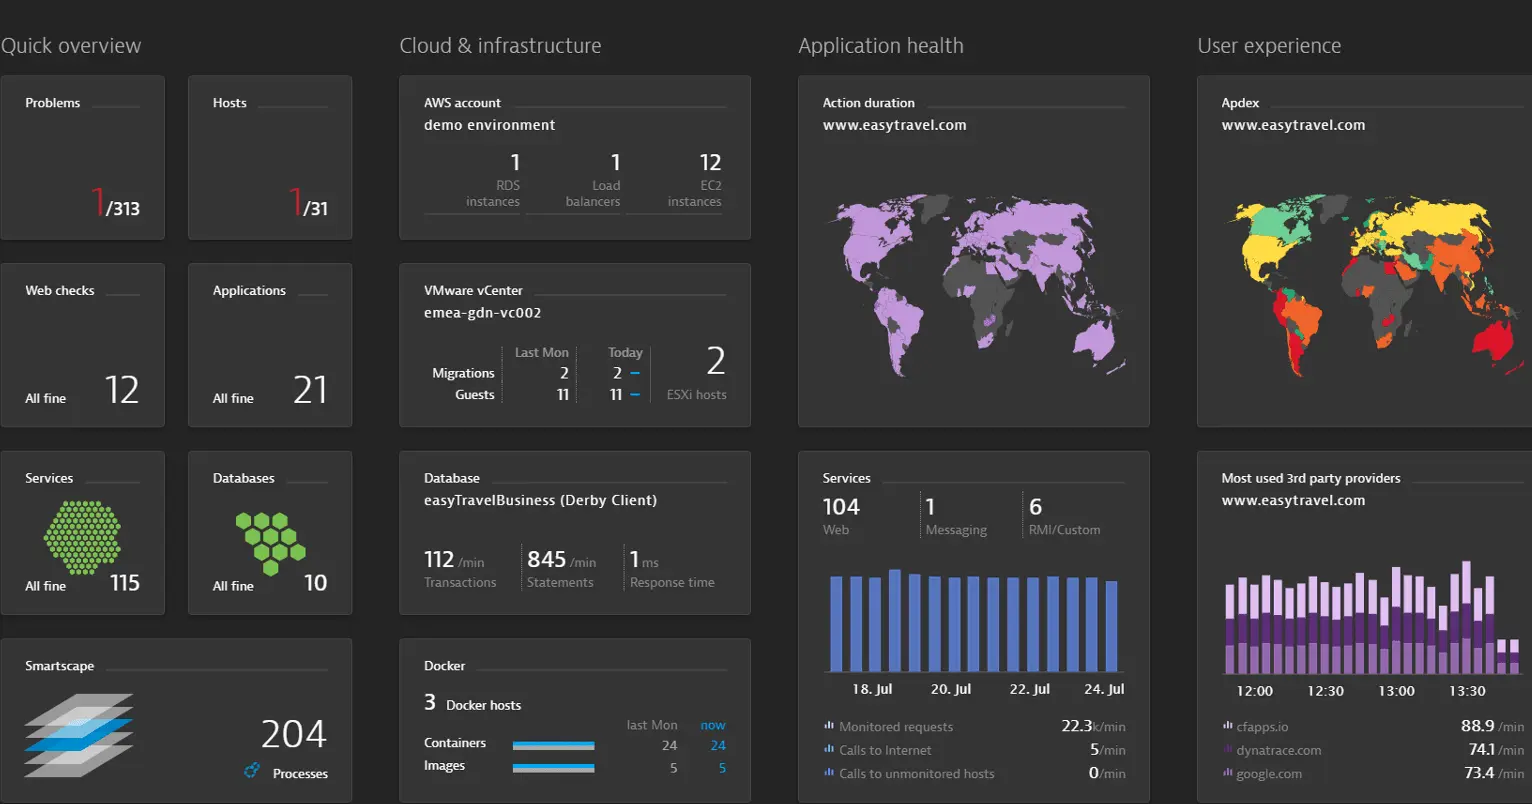
Dynatrace is a real-time, hybrid cloud monitoring platform with built-in support for multiple AWS services. With Dynatrace OneAgent, you get to use byte-code instrumentation for Amazon Elastic Compute Cloud (EC2), Amazon Elastic Container Service (ECS), AWS Lambda, Amazon Elastic Kubernetes Service (EKS), and AWS Fargate.
In addition to metrics, traces, and logs, Dynatrace captures user experience data and tracks microservices, networks, infrastructure, applications, and security indicators for full, end-to-end AWS visibility.
7. Sematext – Enterprise AWS monitoring platform
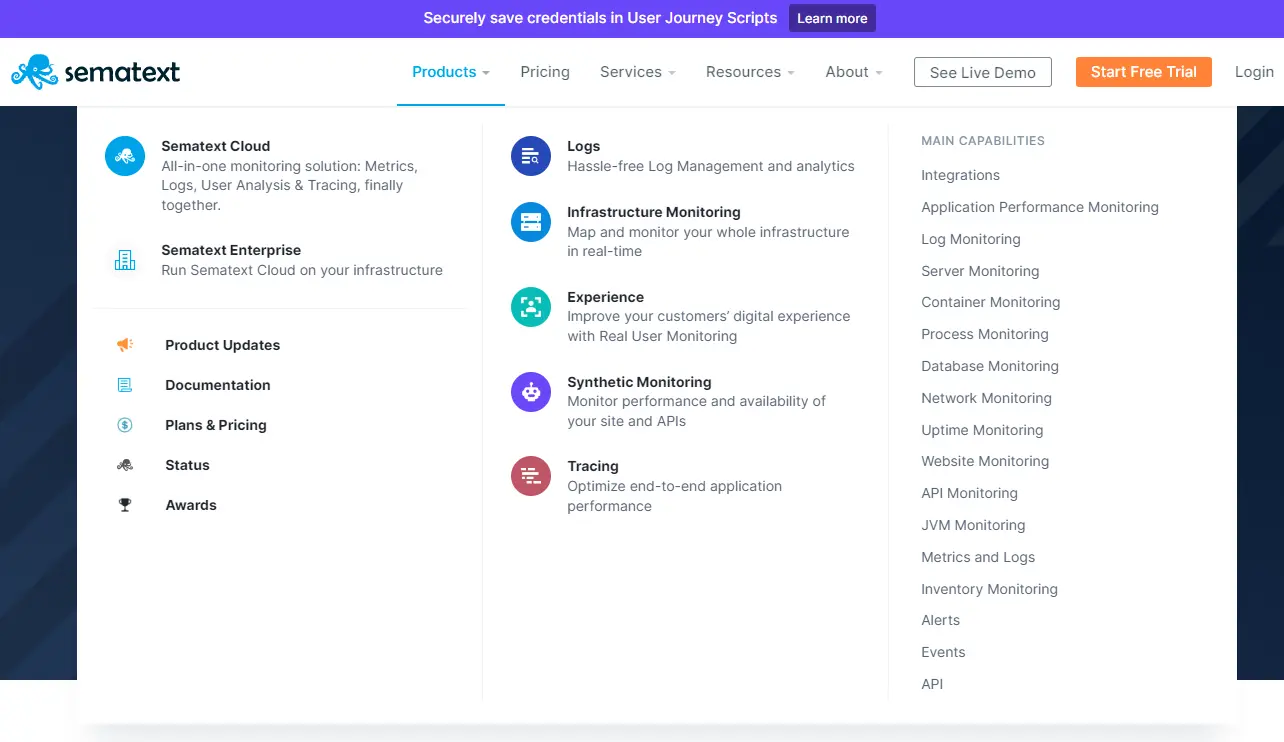
Sematext provides an all-in-one monitoring service for AWS customers. It includes tools to monitor your AWS infrastructure, applications, network, containers, database, and user activity.
It also combines metrics on your website’s user activity, process data, and events in one place for thorough analysis without leaving the Sematext platform.
If you employ a hybrid or multi-cloud strategy, Sematext Enterprise will let you seamlessly monitor your cloud and on-premises infrastructure.
8. AppDynamics – Application performance monitoring for AWS users
AppDynamics provides full-stack observability with code-level root cause analysis, helping teams trace performance degradation from the user experience layer down to individual database queries. It is available on-premises or hosted on AWS and Azure. In 2024, Cisco integrated AppDynamics into the Splunk Observability portfolio, broadening its capabilities with Splunk’s log analytics and SIEM tooling alongside AppDynamics’ established APM strengths.
9. Sumo Logic – AWS observability and security solution
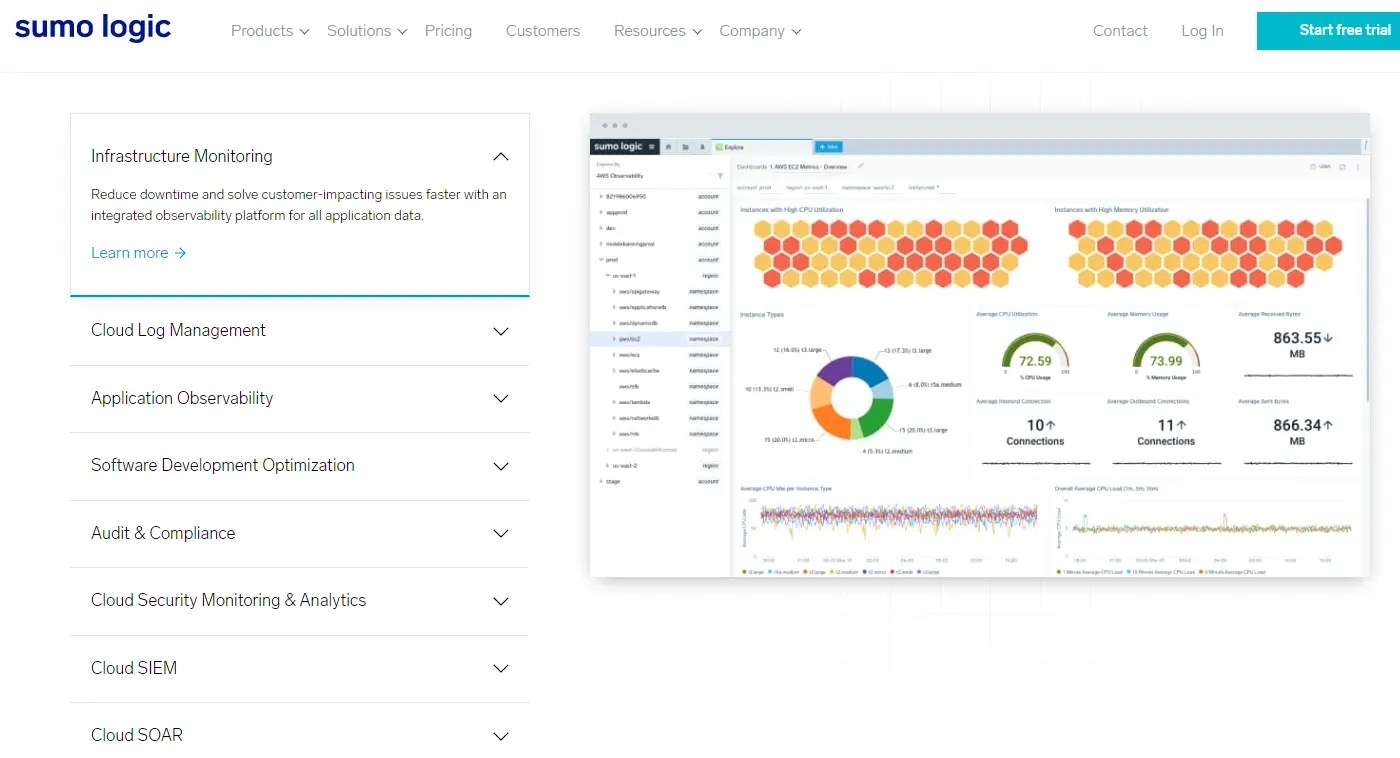
Sumo Logic offers deep AWS integration and real-time monitoring to help you improve visibility across services like EC2, ECS, RDS, ElastiCache, API Gateway, Lambda, DynamoDB, Application ELB, and Network ELB.
The platform’s Root Cause Explorer enables you to identify the root cause of application issues, fix them quickly, and reduce your Minimum Time To Resolve (MTTR).
10. Motadata – A monitoring solution for ServiceOps
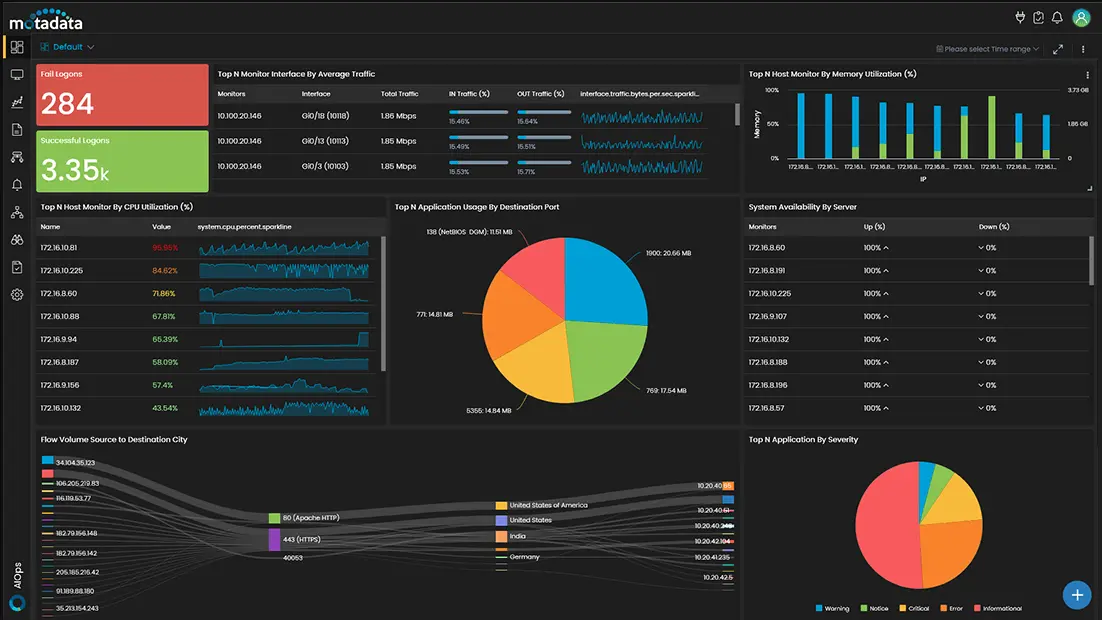
While Motadata provides real-time AWS cloud insights (metrics, logs, and traces), it may be ideal for users looking for a platform that monitors business processes.
For example, the tool automates patch management, offers ServiceOps, and provides an AI-powered conversational tool to identify root causes of network, infrastructure, and application issues.
11. EG Innovations AWS Monitoring – Cloud, SaaS, or on-premises monitoring tool
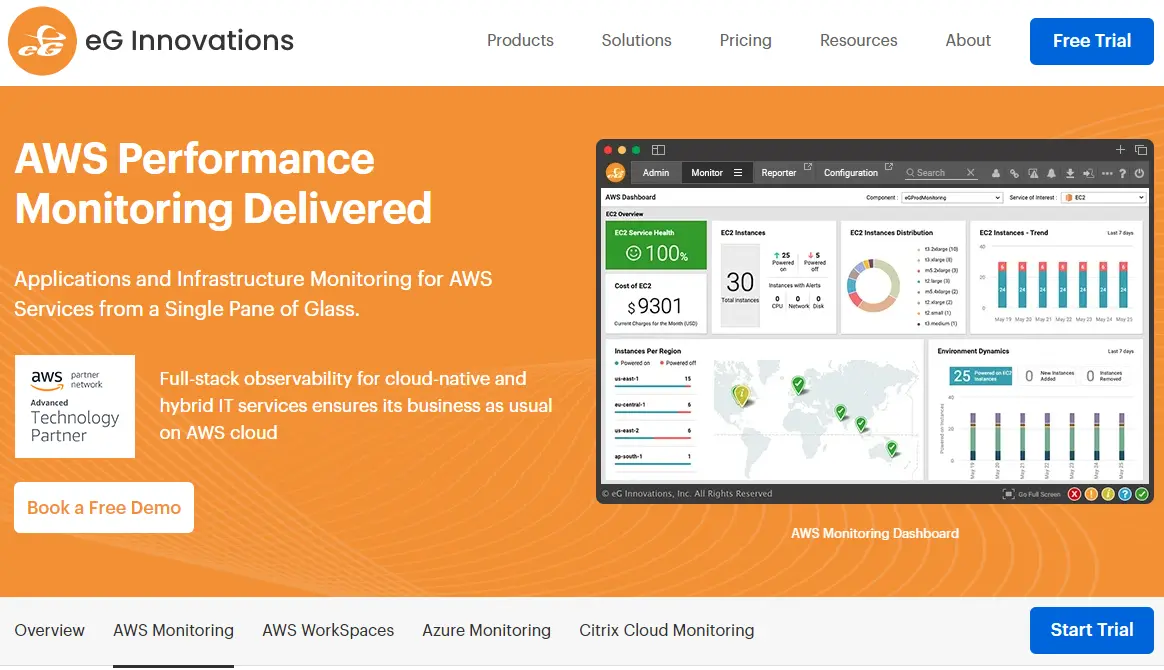
With EG Innovations‘ monitoring service, you can choose a SaaS, cloud-native, or on-premises option.
The tool’s AWS monitoring platform can also be useful if you need a SaaS solution, an on-premises tool, or unified monitoring across a hybrid cloud setup (AWS and Azure).
In addition, it provides right-sizing and optimization to help you manage your AWS resource consumption.
Looking for more tools? Here’s a list of the top cloud monitoring solutions.
What Next: Break Down Your AWS Cloud Bill Into Granular, Actionable Insights
With the right AWS monitoring tool, you can transform how you do business on the public cloud. Using it, you can spot cost anomalies sooner and allocate AWS costs more effectively and confidently rather than waiting weeks to see what shows up.
This AWS monitoring checklist is not exhaustive. Using these best practices and tools, you can prevent minor issues from becoming major, costly problems.
Yet, most AWS monitoring tools do not deliver granular, immediately actionable, and hourly insights. And that’s a big problem, considering how fast things change in the cloud. CloudZero’s approach is unique (and it helped us find $1.7 million in cloud savings ourselves).
Why CloudZero for AWS cost monitoring?
With CloudZero, engineers can understand how their architectural decisions affect cloud costs, and finance can understand the costs per customer.
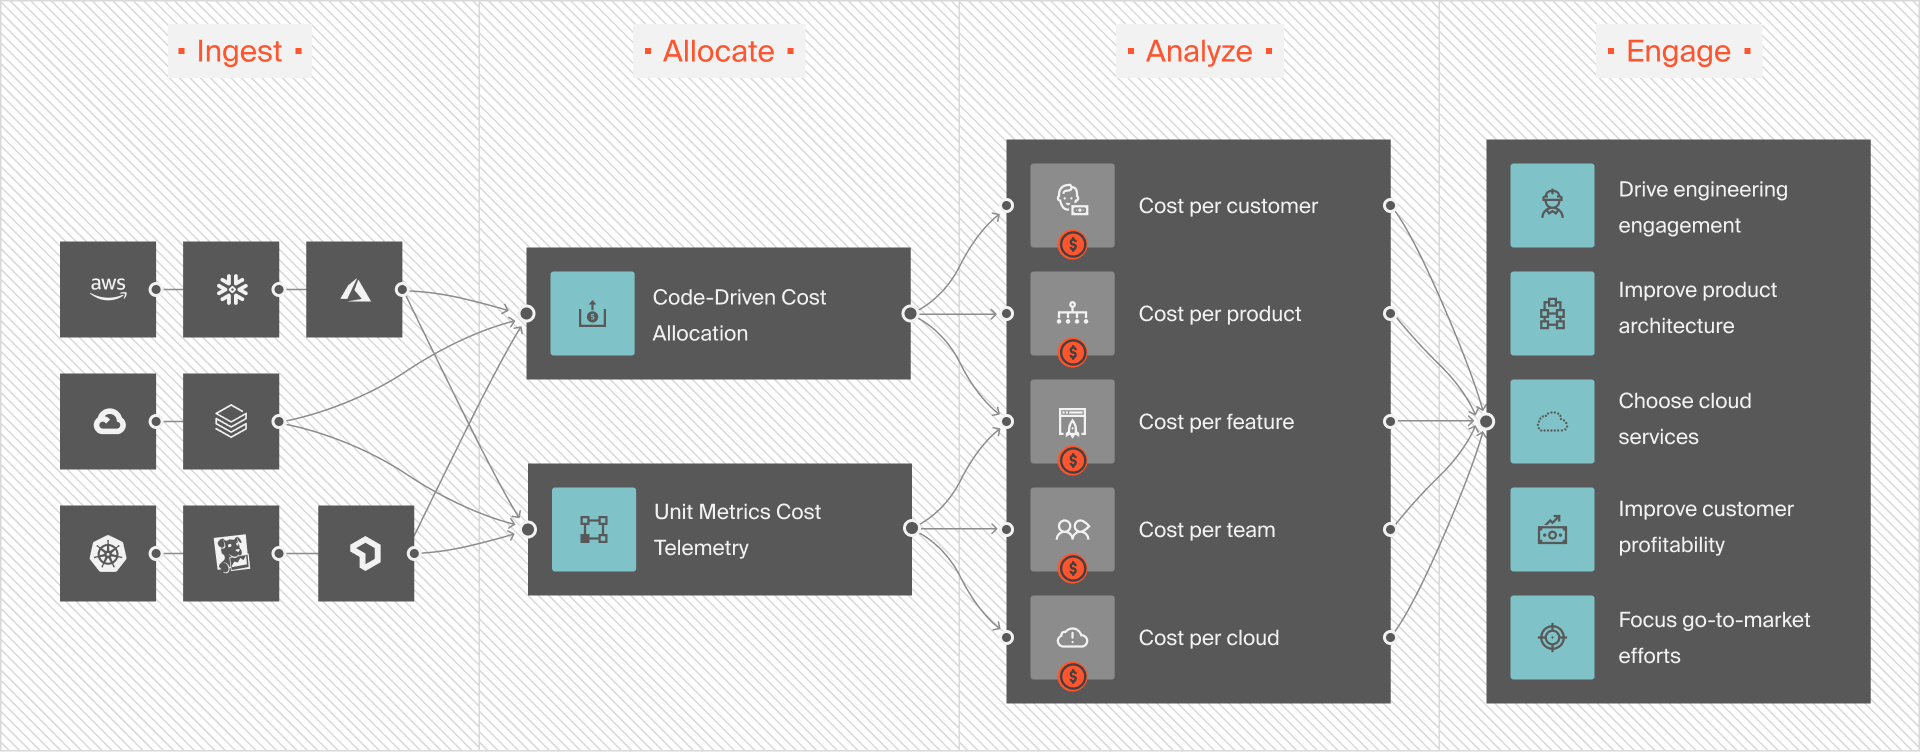
CloudZero’s cloud cost intelligence approach helps you collect, monitor, and understand your unit economics with granular, actionable intel, like cost per customer, project, feature, product, and environment.
CloudZero delivers actionable cost insights hourly — not once every 24 hours like most contemporary cost tools. This ensures you have the most up-to-date cost insights and detect potential cost overruns.
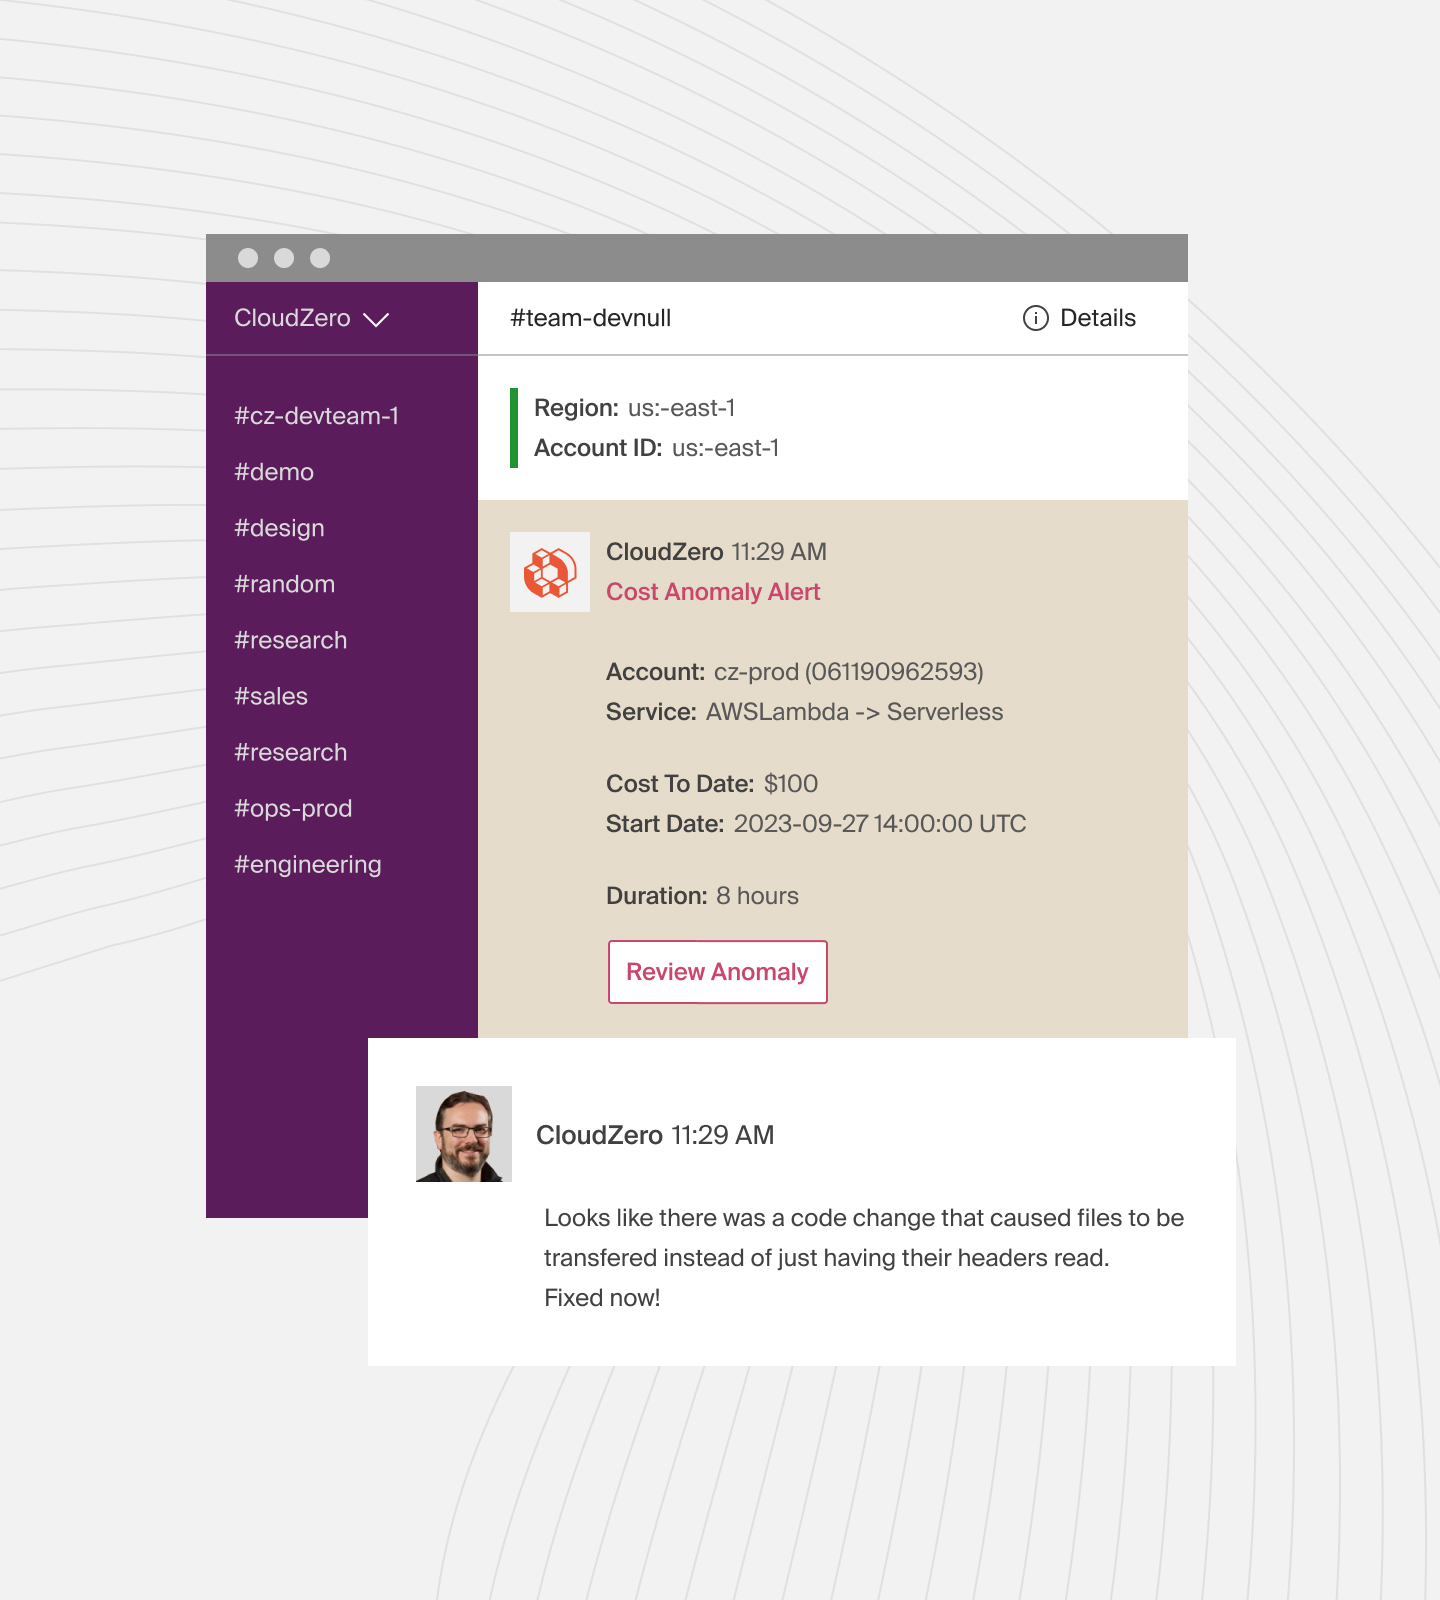
CloudZero offers real-time cost anomaly detection for this purpose. Expect noise-free, timely, contextual anomaly alerts in your inbox or Slack channel. This way, you can fix cost anomalies before overspending.
Better yet, CloudZero helps you map AWS costs to people, products, and processes. You can identify who and what is impacting your cloud costs and why, even with imperfect tags.
You can then easily tell where to adjust usage to optimize costs.
Identifying profitable customer segments is as important as finding new income streams. With CloudZero’s Cost per Customer insights, for example, you can identify your most profitable and most expensive customers. Your marketers can then use this discovery to target more profitable segments.
Ambitious brands like Upstart, MalwareBytes, and Remitly use CloudZero for that and more. Upstart recently saved $20 million in cloud spend, while MalwareBytes and Remitly now understand their Cost per Customer.
Here’s your chance.  to see how monitoring cloud costs with CloudZero helps you make smarter decisions, like pricing your products profitably, knowing which customer segments to target, and increasing your margins to attract investors.


