The DevOps philosophy strives to deliver high-quality software faster. Achieving this requires developers and operations teams to practice five key DevOps principles: Culture, Automation, Leanness, Measurement, and Sharing/Collaboration (the CALMS model).
Measurement is a crucial part of the DevOps approach for several reasons.
To begin with, measurements quantify situations, events, goals, etc. DevOps metrics are a powerful tool for tracking progress, collecting data-based feedback, and identifying inefficiencies — much like the metrics used in FinOps to track cloud financial performance.
Ultimately, if you don’t measure it, you can’t improve it.
Yet not all metrics matter in DevOps — nor are the ones that matter equally important. Here are some DevOps KPIs and metrics you might already be using or could benefit from measuring.
DevOps Metrics: An Overview
A DevOps metric is a data-based indicator or small data set you use to quantify, track, assess, and compare a process, performance, production, etc. A DevOps metric provides insight into the efficiency, effectiveness, and reliability of your software development pipeline. That way, you can quickly spot, isolate, and fix bottlenecks.
DevOps metrics provide insight into technical capability, team processes, and culture, among other things. You can also use DevOps key metrics to measure incremental improvements, including software quality, faster release cycles, and application performance.
Here are some of the most crucial DevOps metrics and Key Performance Indicators (KPIs) you’ll want to be tracking. Every organization is unique, of course. The key metrics you choose to measure and act upon will vary based on the challenges you want to overcome.
Report
Finance needs to prove AI’s return: CloudZero report
260 senior finance leaders (more than half CFOs) told us why the speed of seeing AI spend, not the size of it, separates who pulls ahead on AI from who gets burned.
Software Delivery Metrics — DevOps Velocity
These metrics are part of a set of DevOps KPIs that measure IT performance. They are also known as DORA metrics — named after Google’s DevOps Research and Assessment (DORA) team, which identified the first three as especially critical because they directly impact IT performance.
1. Deployment frequency
Deployment frequency refers to how often you successfully release code to production or end users. Exceptional DevOps teams release code multiple times a day or week.
Typically, DevOps teams use the term “delivery” to refer to code changes released into pre-production, and “deployment” to refer to code changes released into a live production environment.
The frequency of your deployments will, of course, vary depending on the project you’re working on. The point is to update, upgrade, or patch your product as frequently as possible to satisfy users’ needs.
Ideally, this metric should indicate consistency — small but regular improvements support sustainable growth and development.
2. Lead Time For Changes
This metric helps you measure the time it takes to get a code commit to code deploy (successfully running in production).
Measuring lead time requires recording all changes in a deployment, including the commit date and deployment date. If you map triggers with SHAs back to commits, you can achieve this. Using that information, you can calculate your mean change lead time.
Ideally, you want your mean lead time to be in hours, not days or weeks. Otherwise, you’ll want to assess which bottlenecks are causing delays when your code is already in a deployed state.
3. Change failure rate
The Change Failure Rate (CFR) refers to the number of attempted deployments that lead to a failure in production. Those failures can manifest as service interruptions or full-blown outages.
The CFR excludes defects you caught prior to deployment, so teams can use it to gauge how well their testing works.
To calculate CFR in DevOps, divide the number of deployments that led to failure by the total number of deployment attempts you made, and multiply by 100.
Most of these fails require remediation or hotfixes to correct, so your engineers have to take time away from developing new solutions to fix and stabilize them. DORA considers CFR rates of 15% or lower as elite-level performance, while 30% is the lowest acceptable rate.
4. Deployment speed
While deployment frequency is about how often you release code to production or users, deployment speed is about the time it takes to actually deploy code changes after they are approved to go.
You can measure deployment speed to see if faster deployments lead to more errors, for example. In such a case, teams can often switch from automatically releasing code to production (deployment) to ensuring a human engineer approves changes before they go live (delivery).
You’d then measure how long it takes your engineers to assess and approve code changes. On the other hand, experienced DevOps teams often use CI/CD tools like Jenkins and CircleCI to automate releases and expedite deployments, provided the code passes all necessary tests. Tracking deployment speed alongside other velocity metrics is also a key part of a strong DevOps dashboard strategy.
5. Deployment success rate
This DevOps key metric is the opposite of the Change Failure Rate.
It is a measure of how many deployments your organization has made to production or to end users that were successful, not just because they didn’t fail, but also because they satisfied the software customer and other stakeholders.
The goal should be to achieve a deployment success rate of at least 80% (as opposed to a change failure rate of 0-30%).
Rather than measuring productivity by work hours, deployment frequency, or the volume of code changes your team makes, you can use this metric to determine how much of your work actually generates usable results.
6. Cycle time
Your cycle time measures how long it takes from when you start working on a task to when it is delivered – from your first commit to release to when it runs in production.
A more granular method for measuring cycle time is to calculate the time for each of the four phases separately: coding, pickup, review, and deployment.
Deployment frequency and speed are closely related to cycle time. When cycle times are shorter, you are more likely to deliver quality code more often. It may also mean you can deliver more features more quickly.
7. Change volume
Rather than simply changing random bits of code, you want most deployments to improve the product and your customers’ lives.
Change volume is thus a measure of progress or continuous improvement to your entire software product.
It’s about balance here.
On the one hand, you want each deployment to make the most improvements possible. On the other hand, too much disruption may require you to retrain your users on how to use the product. Others may run into compatibility issues that lead them to switch products.
DevOps Metrics To Measure Stability And Reliability
This section contains key DevOps metrics that impact the stability of your software product. Among other things, you can use them to gauge the quality of your code changes and how fast you resolve issues after outages.
8. Mean time to detection (MTTD)
Your mean time to detection indicates the amount of time it takes you to detect an anomaly from the time it started. MTTD can help you gauge how quickly your DevOps team pinpoints the root cause of an issue so they can begin fixing it.
The time from when you learn about the issue to when you begin applying a fix reflects your mean time to respond.
The lower your mean time to detection, the better. Elite DevOps teams use real-time monitoring and alerting tools to reduce their MTTD.
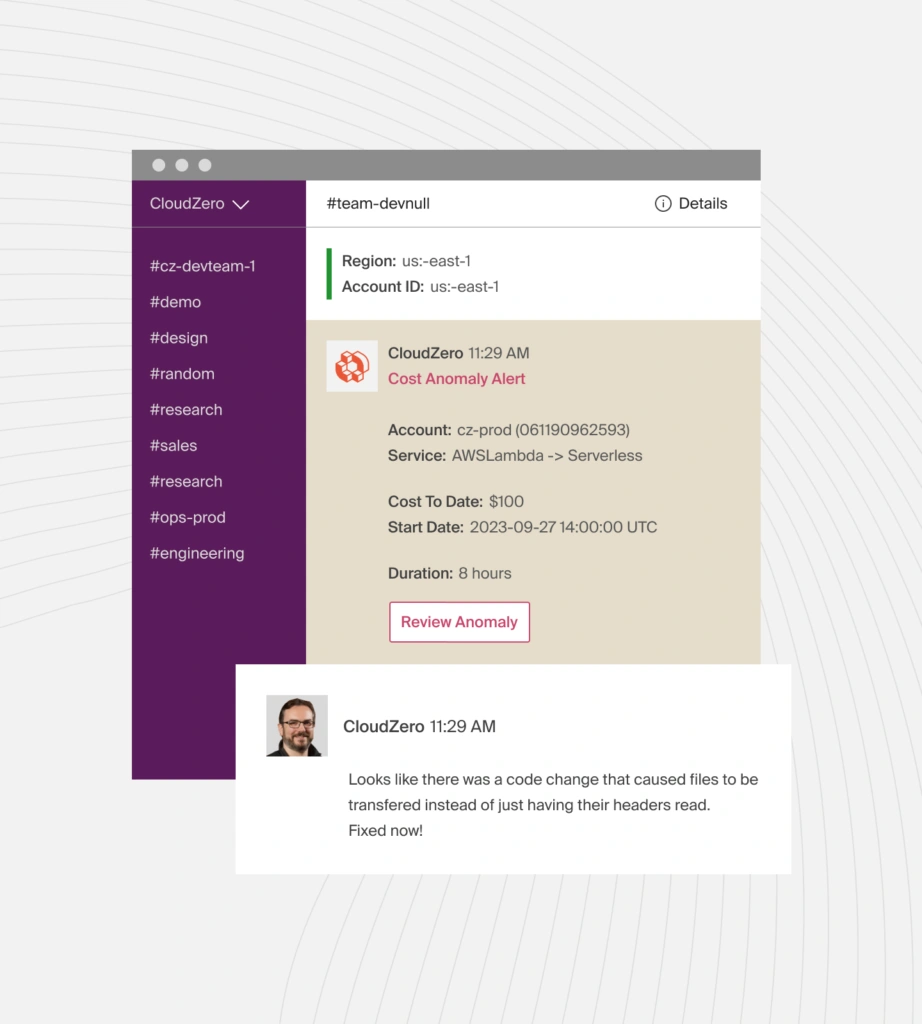
CloudZero, for example, uses real-time anomaly detection to flag cost data that deviates from historical trends or predefined parameters (such as your budget or spending limit).
Then, depending on the severity of the cost data, CloudZero sends a high-priority alert to individual engineers or an entire team via Slack, email, text, or your favorite incident management tool so you can review the issue before it becomes a costly problem.
9. Mean time to recovery (MTTR)
An all-out outage may occur when it takes a long time to analyze the root cause of an issue, develop a possible solution, test the patch, and deploy it. In some cases, you may not detect a problem until after a service outage occurs.
In either case, the mean time to recover metric measures how long it takes to restore normal operations following a partial or total failure in production.
The difference between the mean time to restore and the mean time to repair is that the former calculates the average total time from the outage through to operating normally again, while the latter accounts only for the average repair and testing time.
Moreover, the mean time to resolve includes the time it takes you to ensure the failure won’t happen again (a long-term fix).
MTTR is a DevOps KPI because it indicates the average time customers have gone without service, which can impact customer retention.
10. Mean time to failure (MTTF)
Mean time to failure is a DevOps metric that indicates how long it takes for irreparable hardware or software failures to occur. The MTTF tells you how long your system’s components tend to last on average before they break down and need to be replaced.
You can use this metric to estimate a feature’s lifespan, determine when to prepare a new stable version to replace it, and identify when to recommend system updates to customers.
Operational Performance Metrics — DevOps Reliability
Reliability is a system’s ability to operate at optimal performance while maintaining high availability. Yet reliability is a complex KPI, so here are some key performance indicators to help you measure it.
See our DevOps Monitoring Tools guide for platforms that make tracking these metrics easier.
11. Mean time between failure (MTBF)
Unlike mean time to failure (MTTF), the mean time between failure (MTBF) measures the amount of time between repairable failures that occur within your system.
Also, while MTTF is ideal for measuring the average lifetime of a feature or product, the MTBF metric provides information on the reliability of a system (including availability or uptime).
A system that experiences fewer failures is more reliable. The farther apart those failures occur, the better. Furthermore, a long MTBF suggests that your product is of high quality, as it has fewer bugs and minimizes disruptions to customer service.
12. Service level agreements (SLAs)
The service-level agreement (SLA) specifies the type and standard of services a service provider will provide to a specific customer. An SLA can be a legally binding contract that guarantees a particular level of service delivery to the customer at all times.
In contrast, a service-level commitment (SLC) is often a service provider’s general assurance to one or more customers about the level of service to expect — rather than a bi-directional contract.
SLAs help service providers manage their clients’ expectations and define when they are not responsible for service interruptions or performance issues.
And since an SLA details a service’s performance characteristics and what happens during a disruption, customers can use it to compare vendors’ offerings.
13. Service level objectives (SLOs)
A service-level objective refers to the specifics you promise your customer within an SLA. Those details can include your guaranteed uptime, response time, and liability. These SLOs also specify the targets your DevOps teams must meet to satisfy that customer.
SLOs are different from service-level indicators (SLIs), in that SLOs describe the service level you promise a customer, while SLIs reflect the actual service level you are hitting.
For example, you may promise a customer 99.95% uptime, but maintain a 99.98% uptime over the course of their subscription.
Meeting your SLOs is crucial to customer retention. Still, you’ll want to account for customer-side delays or issues to avoid making up for problems you didn’t cause.
14. Defect escape rate
The defect escape ratio quantifies the rate at which faulty code “escapes” past code review and quality assurance (QA) to enter production. Although these issues may not cause service outages, they may reduce customer satisfaction.
The metric that measures the actual number of issues that occur (not the frequency), is the defect volume. Additionally, while the defect escape rate measures the number of releases with bugs or poor code, the change failure rate measures the proportion of these that require immediate remediation.
However, all three DevOps metrics provide deeper analysis into areas where QA can improve, enabling earlier bug detection in the DevOps pipeline and reducing the impact on end-user experiences.
Some DevOps teams have an error budget for these sorts of issues.
15. DevOps error budget
An error budget specifies the maximum length of time a technical system can be out of service without the service provider needing to compensate customers.
For example, if you promise 99.95% uptime for a year, you’ll have a wiggle room of four hours, 22 minutes, and 48 seconds.
This allowance enables DevOps teams to develop, test, and deploy new features without worrying too much about the risk of not meeting SLAs.
When a DevOps team reaches or exceeds the error budget, and is performing at or below an SLA’s terms, this is often an indicator that it needs to freeze all new releases until it can reduce the number of errors to a sustainable level — operating above the error budget again.
16. Application performance index (Apdex)
You can use this metric to assess how satisfied your customers are with your service, website, or application response times. The Apdex compares the proportion of satisfactory response times versus unsatisfactory ones.
The response time is calculated from when the customer makes a request and terminates after the request has been processed. The average response time refers to the mean time it takes your system to process a transaction or request.
To measure Apdex for a service, you must first define a response-time target you want to maintain as your application’s baseline.
You can then track apdex at three levels: satisfactory (short response time, like 1-2 seconds), tolerating (medium response time, like 3-5 seconds), and frustrated (long response time, like more than 5 seconds).
It is also possible to assess your Apdex by examining the volume of customer tickets received regarding an issue.
17. Observability metrics
High-performing teams use observability metrics to gain deeper system visibility and detect issues faster.
Key metrics include:
- Anomaly Detection – Spot unusual spikes in errors, latency, or costs.
- Resource Utilization – Track CPU, memory, and network usage.
- Latency and Throughput – Monitor response times and request volumes to find bottlenecks.
- Error Volumes – Measure alert trends to prioritize fixes.
By combining observability with reliability metrics such as MTTR and Apdex, teams can detect issues earlier, respond more quickly, and maintain a smooth user experience.
DevOps Security Metrics — DevSecOps Metrics
Vulnerabilities in the cloud and on-premises continue to be a big threat to DevOps success — not to mention adoption. DevOps monitoring tools play a critical role in catching these issues early.
In addition to being costly, breaches can lead to a loss of credibility, customer churn, and legal issues, hindering a company’s future growth. Tracking these and more DevSecOps metrics can help you prevent costly surprises.
18. Software security coverage (SSC)
The SSC refers to the total number of system components you have covered under your DevSecOps program. These components can be applications, services, microservices, containers, etc. You’ll want to have covered your mission-critical components 100%.
19. Vulnerability open rate (VOR)
You can use the VOR to keep track of how many vulnerabilities you identify when releasing code into production. You can then organize the issues according to their severity; critical, high, medium, or low-risk.
The goal is for this metric to register a smaller and smaller figure over time, indicating that your team is improving at creating bug-free code and that your security team is catching issues before they are deployed live.
20. Security technical debt (STD)
This DevOps security KPI indicates the total number of unresolved issues in production. You can think of it as the defect volume or defect escape rate, but for security risks. The faster you patch the issues, the more secure your system will be.
Something else. The mean vulnerability age (MVA) measures the duration of a vulnerability since its discovery, but it remains unresolved. Together, the STD and MVA metrics reveal your security risk exposure (SRE).
Cost KPIs For DevOps Teams — DevOps Cost Effectiveness And Efficiency
With more companies seeking ways to reduce cloud waste, exceptional DevOps teams will be the ones that treat cost as a primary metric — and apply cloud FinOps principles to do it. But rather than cut costs indiscriminately, the goal is to optimize costs without hindering engineering velocity or innovation.
In 2026, leading FinOps teams rely on real-time telemetry to track spend as it happens and event-driven allocation to instantly tie costs to workloads or user actions. This level of precision ensures faster decision-making and tighter alignment between engineering performance and financial outcomes.
Yet, unlike traditional Capex approaches, cloud spending is based on consumption, which can quickly accumulate if you are overzealous. With that in mind, the following cost metrics can help you optimize your cloud spend.
21. Cost per customer
You can determine how much you can profitably charge a specific customer once you know how much you spend supporting them. Picture this:
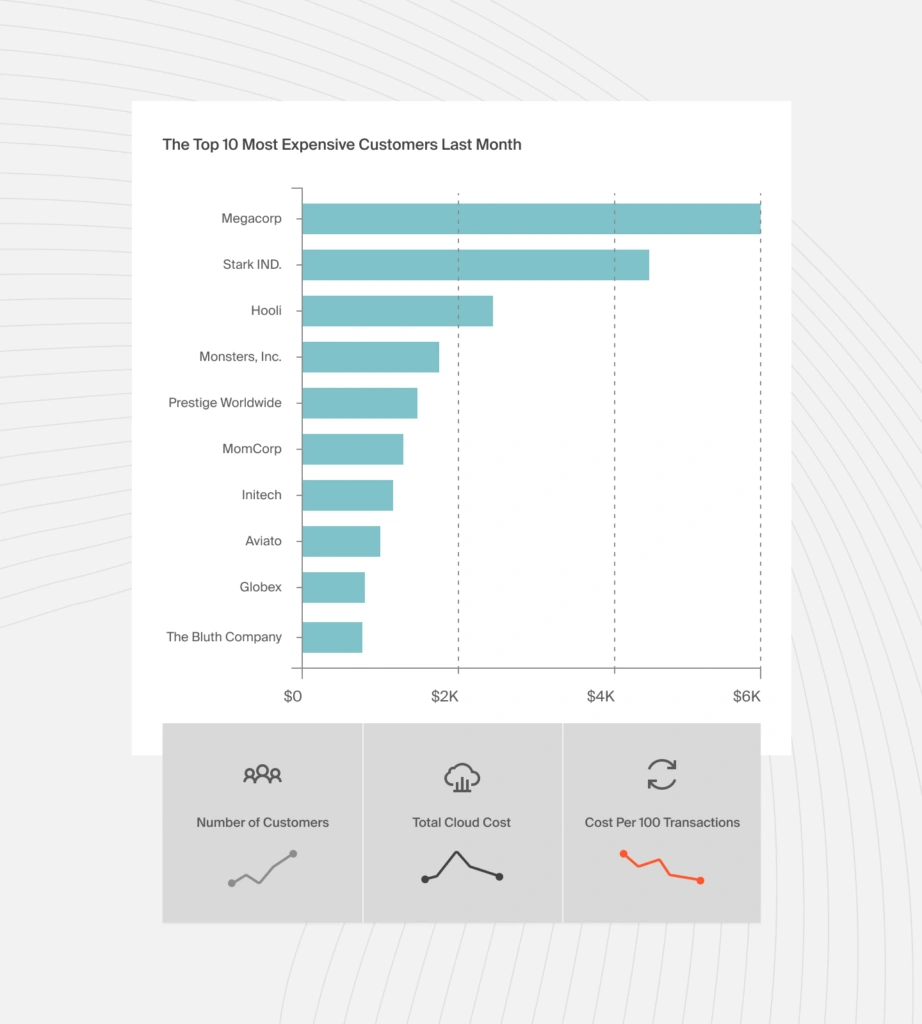
Total and average costs per customer are misleading because they aggregate costs across all customers, regardless of each customer’s resource usage. But with cost per customer, you can accurately answer questions like:
- How much will our costs change if we onboard 10 more customers tomorrow?
- What is our least expensive customer segment so that we can market our services to them more?
- How much discount can we afford to give this customer?
- Considering this customer’s usage, what contractual changes should we make at renewal to protect our margins?
22. Cost per product feature
This metric helps you to analyze how much you are spending to support a particular software feature. With this insight, you can answer questions such as:
- How sustainable is this feature in the free forever tier? Should we move it to a limited free trial?
- Or do we need to move it to a higher-tier pricing to remain profitable?
- Is the demand for this feature sustainable if we move it to a premium tier?
- Should we charge for this product feature based on usage or per user?
- Does it make more sense to repurpose this feature or to decommission it to save costs?
23. Unit cost
Measuring costs per unit empowers you to understand exactly who, what, and why your DevOps implementation costs are changing. A few examples of unit costs you can track, include:
- Cost per project
- Cost per development team
- Cost per deployment
- Cost per environment
- Cost per product, and more.
With this level of precision, you’re able to identify the people, processes, and products that drive your DevOps costs. You can then identify where to cut costs without compromising innovation and velocity. In addition, you can determine where you could invest more to maximize your returns.
Learn more about cloud costs from a business lens with our Complete SaaS Unit Economics Guide (2025 Edition). It shows you how to measure and act on cost per feature, customer, team, and more — helping you connect DevOps activities to financial outcomes.
What Next: Drive A Cost-Conscious DevOps Initiative With CloudZero
CloudZero’s cloud cost intelligence approach collects, analyzes, and shares cloud costs in your engineers’ language. Also:
- Expect actionable and granular insights, such as cost per deployment, per software feature, per customer, per environment, per dev team, per DevOps project, and more.
- Shift cost decisions left. Empower your engineers to see, understand, and interpret cost insights in their own language, enabling them to develop cost-effective, efficient solutions by understanding how their technical choices impact finances.
- Detect abnormal costs in real-time. CloudZero also sends noise-free alerts straight to your Slack or email to help you prevent cost overruns.
- Manual tagging is not required. With CloudZero’s code-driven approach, you can view the costs of tagged, untagged, and untaggable resources, as well as the costs of individual tenants in multi-tenant architectures without endless cost allocation tags in AWS, Azure, or Google Cloud.
CloudZero already saves Drift $2.4 million annually, Validity spends 90% less time managing costs, Malwarebytes can now measure cost per product, and Remitly allocates 50% more costs without tagging. You can, too.
 to see how CloudZero works!