If you’ve ever opened your Google Cloud bill and felt confused, you’re not alone. Costs in GCP can spike up fast. One project here, a few APIs there, until the total looks nothing like what you expected.
That’s because Google Cloud pricing is built for flexibility. You pay for what you use, across dozens of services, each with its own rules, discounts, and data charges. It’s robust, but also easy to lose sight of what’s driving your spend.
The good news? Google provides a suite of billing tools to bring structure to the chaos.
In this guide, we’ll look at how billing works in GCP and explore the main Google Cloud Billing tools, their strengths, gaps, and ideal use cases. You’ll also learn when and why it’s worth pairing them with third-party or FinOps-level platforms for deeper, engineering-driven cost control.
How Billing Works In GCP
Like most providers, Google Cloud uses a pay-as-you-go model, so you pay for what you use across services such as compute, storage, networking, and APIs.
Every resource you create in GCP belongs to a project, and each project is linked to a Cloud Billing account. Usage in that project is charged to the linked account. You can link multiple projects to a single billing account or use separate accounts to isolate spend by department.
Each project generates usage data, which Google aggregates into costs based on service rates, discounts, location, and more. These charges are then reflected in your Billing Reports and Cost Table within the Cloud Console.
Billing also integrates deeply with labels and tags, which you can apply to resources such as VMs or storage buckets.
Report
Finance needs to prove AI’s return: CloudZero report
260 senior finance leaders (more than half CFOs) told us why the speed of seeing AI spend, not the size of it, separates who pulls ahead on AI from who gets burned.
Google Cloud Billing Tools And How They Work (A Complete Guide)
From tracking usage to setting budgets and exporting data for analysis, these Google billing tools enable you to manage and understand your cloud costs.
1. Cloud Billing Reports
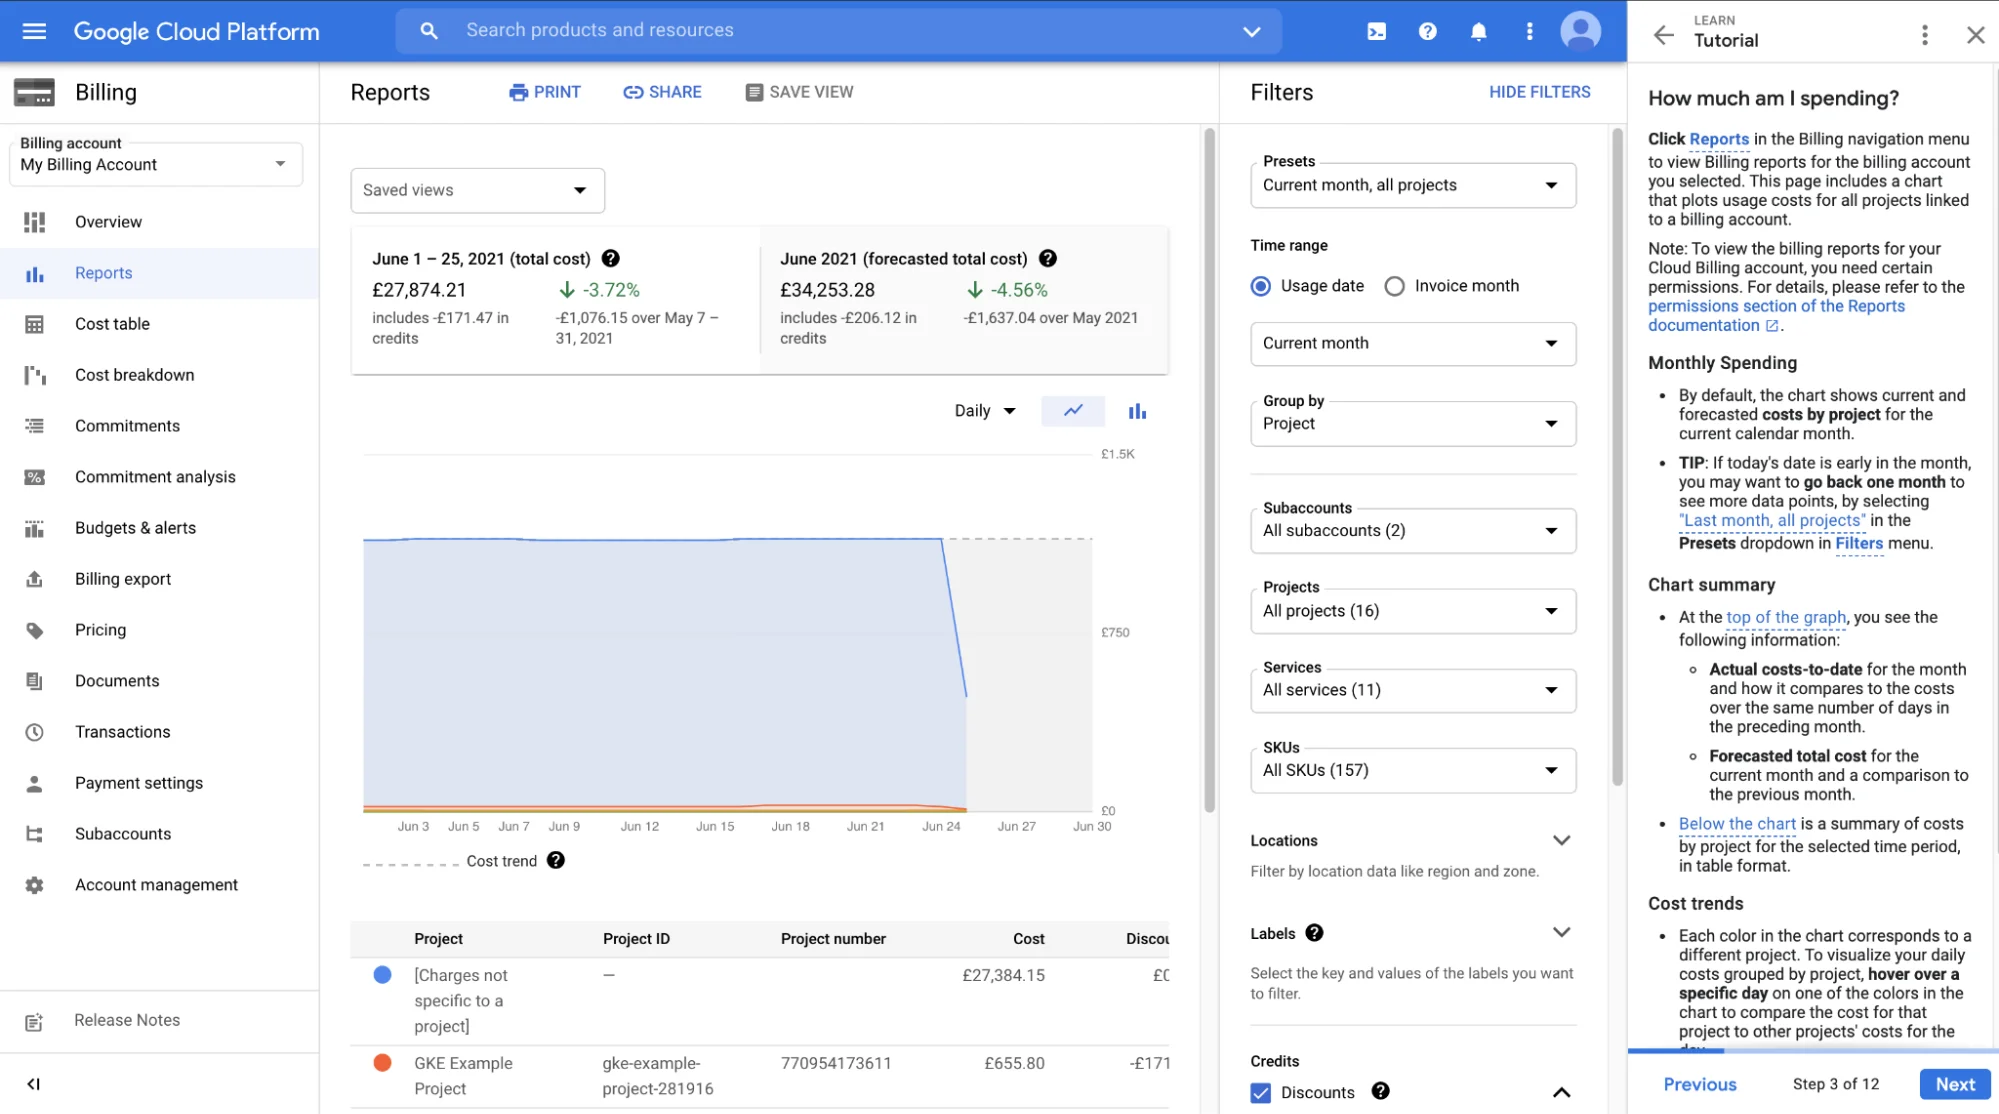
With Billing Reports, you can visualise, filter, and analyse your cloud costs across projects, services, and locations for a given billing account (or project).
It helps answer these questions:
- How is this month’s spend trending compared to last month?
- Which project or service is costing me the most?
- What is my spend by region?
- How much cost is attributed to resources with a particular label?
2. Cost Table Report
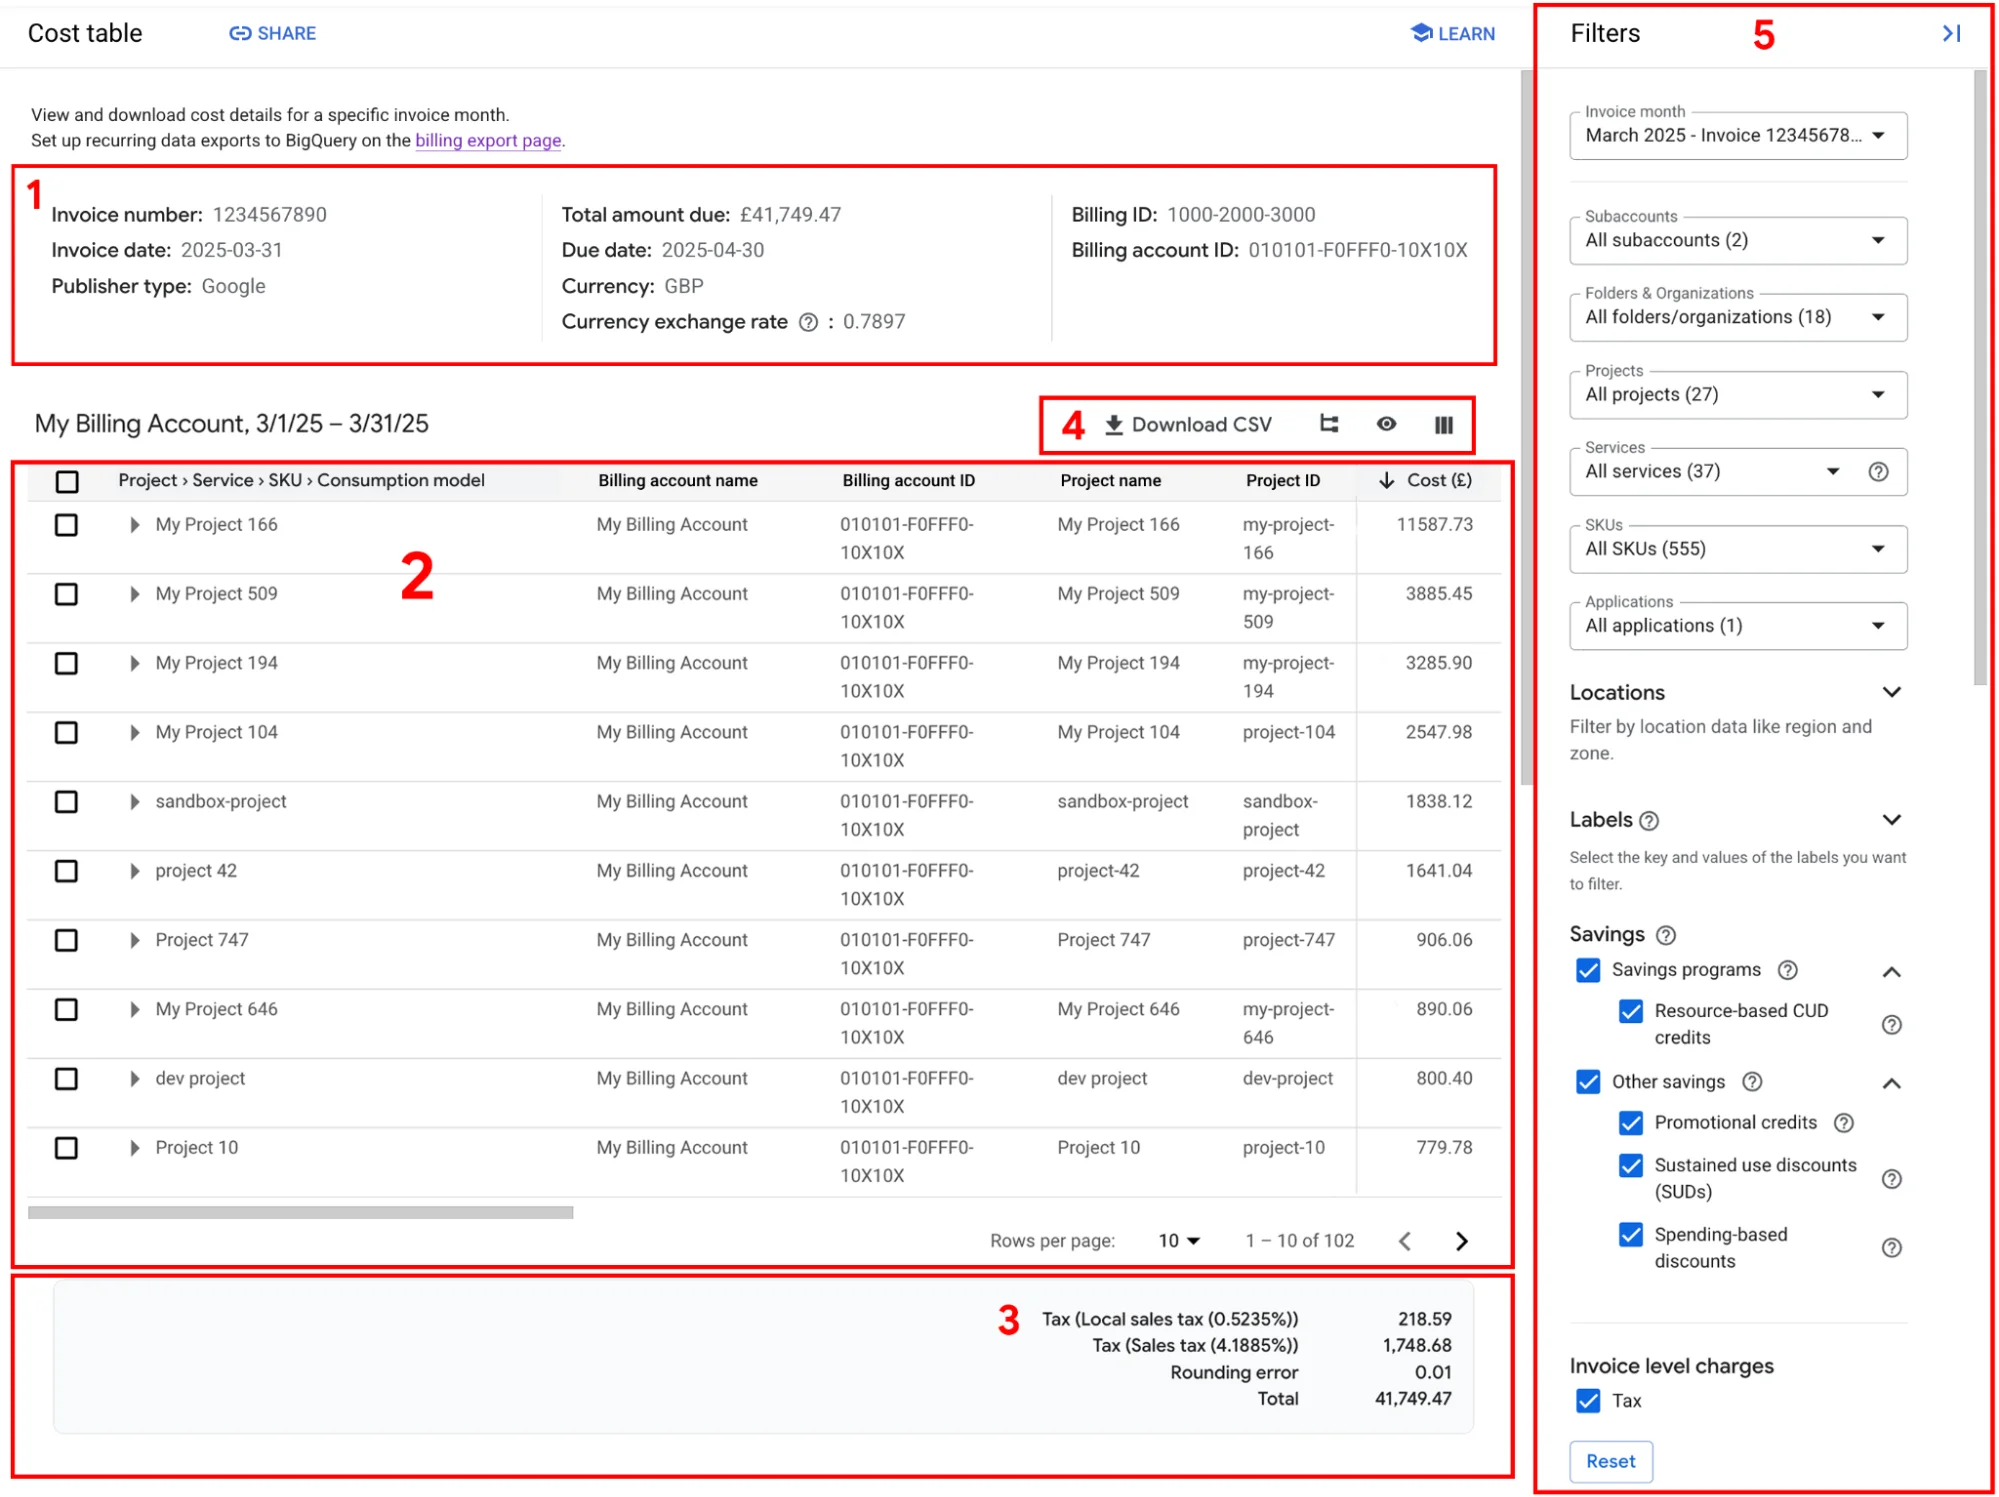
The Cost Table Report is a detailed tabular view of your billing account’s costs for a given invoice-month (or statement period). It’s built to align as closely as possible with your actual invoice and gives you project-level breakdowns, service and SKU IDs, tax by project, and other metadata that the standard PDF invoice may not show.
In other words, while the billing report shows trends, the Cost Table Report is the detailed ledger for a billing period.
3. Budgets & Alerts
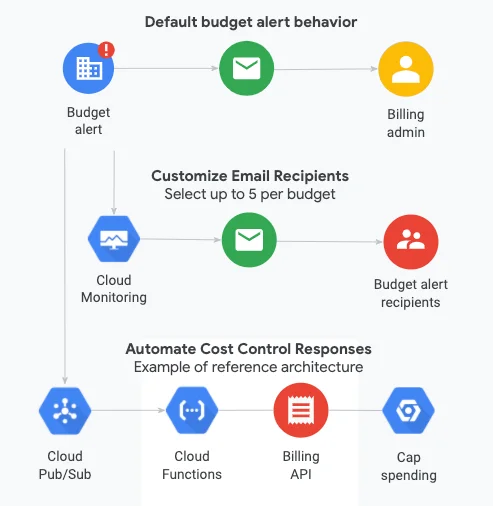
You can set budgets for an entire billing account or narrow them down to projects, services, or labels. Budgets can be fixed (like $10,000 a month) or dynamic, based on your previous spend, and can recur monthly, quarterly, or yearly.
You can define thresholds (for example, 50%, 90%, and 100%) to trigger alerts when actual or forecasted costs exceed the specified limits. Alerts go out via email or Pub/Sub to Slack or automation. Larger teams can also manage budgets programmatically through the Cloud Billing Budget API.
4. BigQuery Billing Export
BigQuery Billing Export automatically sends detailed usage and cost data from your billing account to a BigQuery dataset you control. It gives teams access to raw, queryable data, including SKUs, credits, and project or label breakdowns. You can choose between a standard export (daily cost summaries) and a detailed export (resource-level data), plus an optional pricing table listing all SKUs and rates.
Once enabled, data updates several times a day, creating a reliable source for dashboards and FinOps reporting.
5. Cloud Billing Budget API

With the Cloud Billing Budget API, you can create, update, and manage budgets directly through code rather than using the console. It’s ideal for large organizations managing multiple projects, where manual setups would be inefficient.
Teams can also integrate it with automation pipelines to set budgets, adjust thresholds, and trigger alerts via Pub/Sub when spending exceeds predefined limits.
6. Google Cloud Pricing Calculator
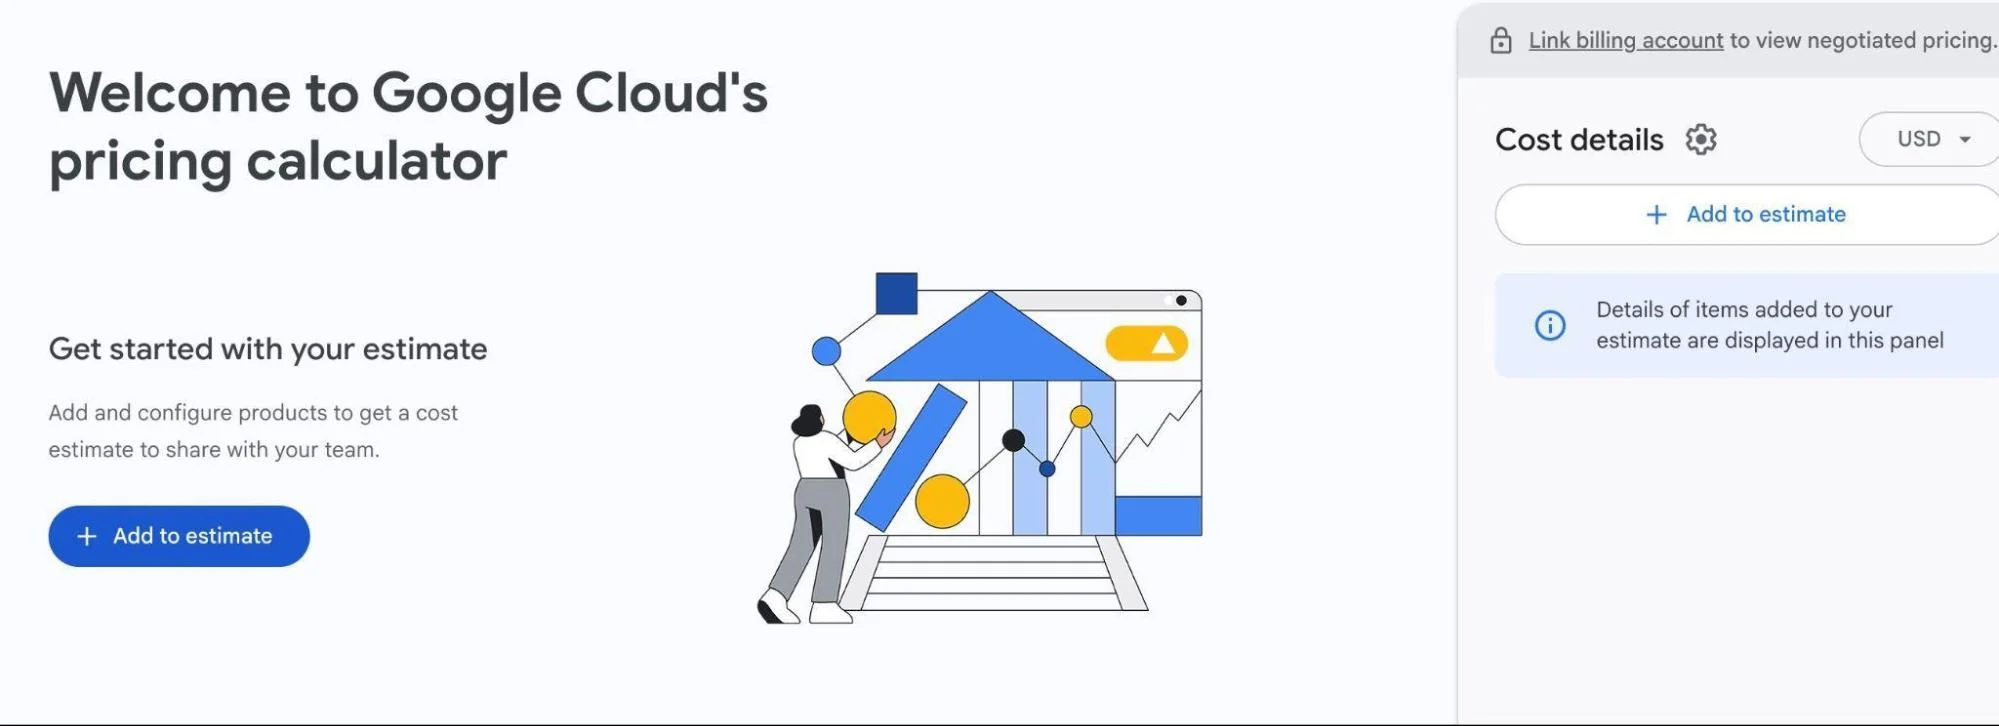
The Google Cloud Pricing Calculator is a free tool that helps you estimate the cost of your workloads before deployment. It enables you to configure services such as compute engine, storage, BigQuery, or Kubernetes by choosing instance types, storage sizes, network usage, and regions.
The calculator then generates an estimated monthly total based on Google’s current SKU pricing.
7. FinOps Hub
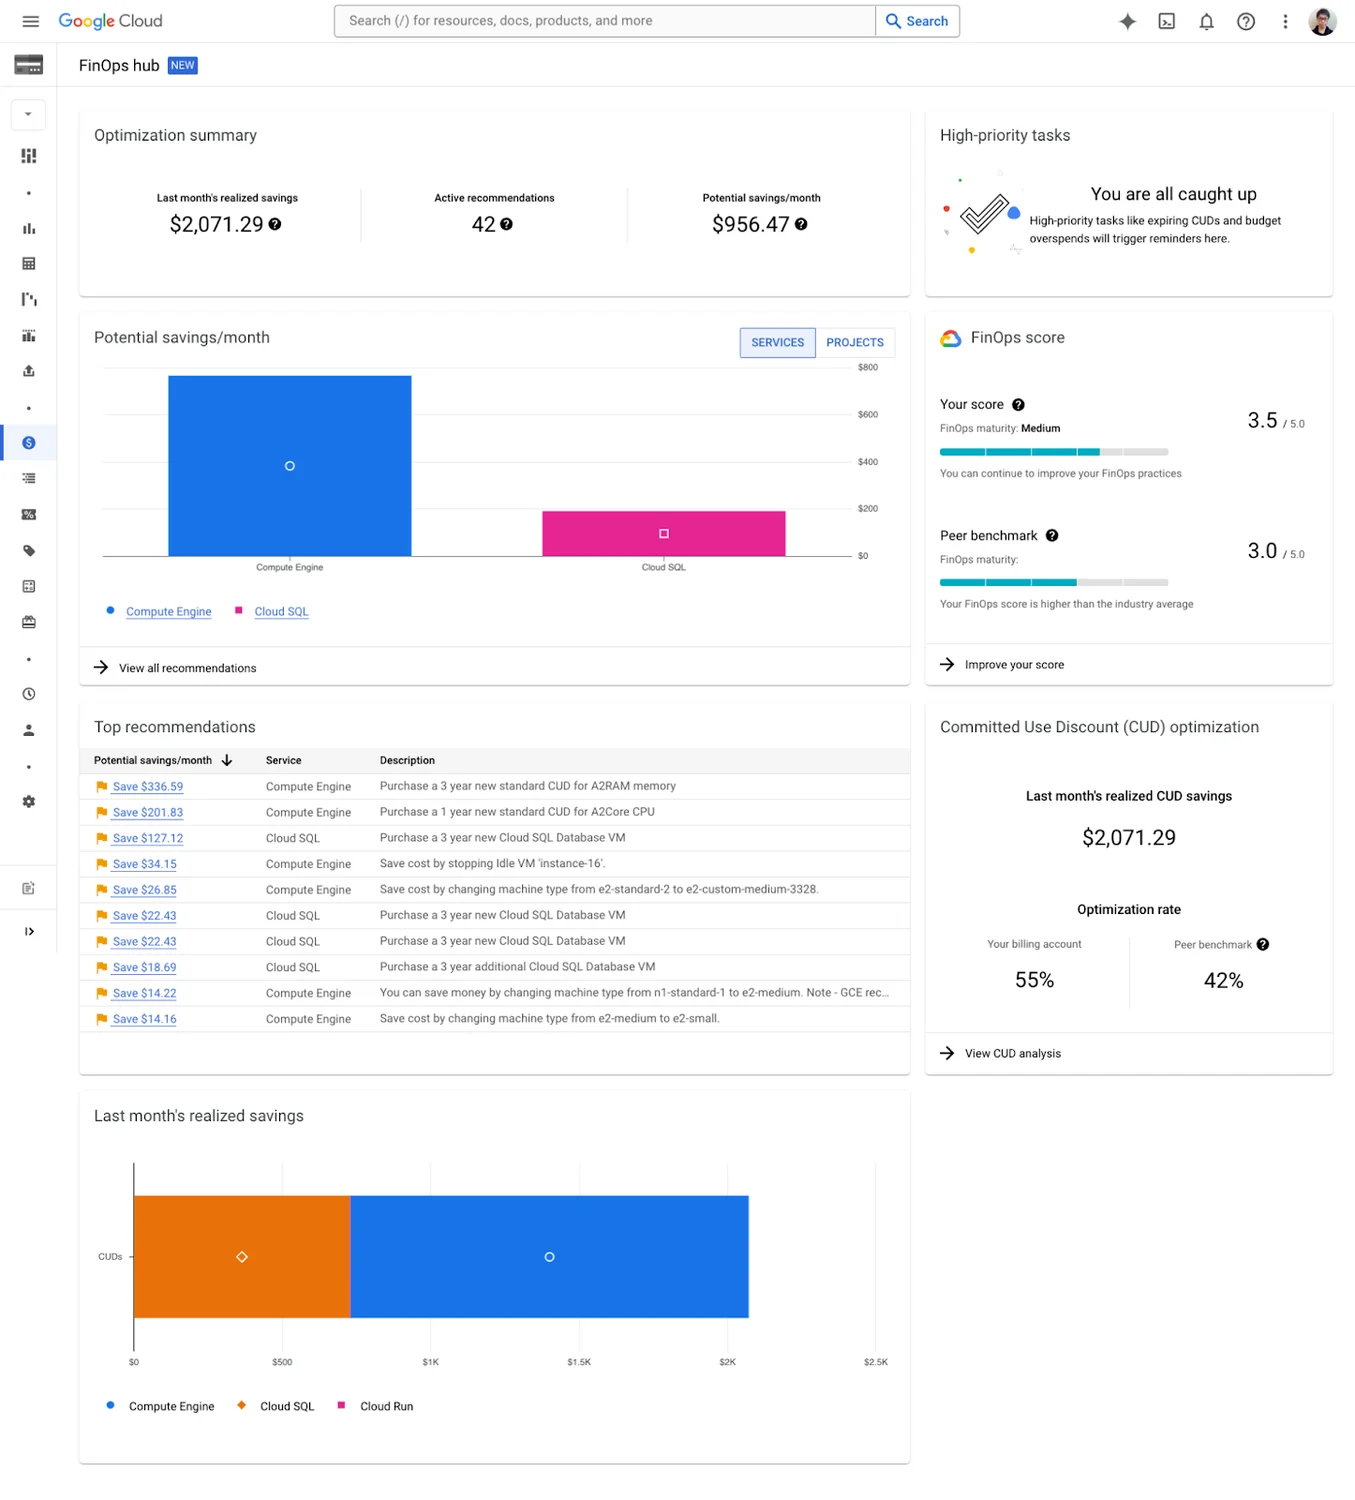
FinOps Hub unifies billing insights, usage data, and cost recommendations. It brings together dashboards, budgets, discount programs, and anomaly detection in one place.
Still, these native tools come with limitations.
The Challenges Of Google Cloud Billing And GCP Native Tools
Below are some of the most common challenges users encounter with native GCP billing tools:
- Multi-cloud or external SaaS cost blind spots. If you use other clouds or SaaS (outside GCP), native tools won’t include those, limiting complete cost visibility across your stack. Multi-cloud management tools can help bridge this gap.
- Shared resource cost allocation. When infrastructure is shared (for example, storage, networks, or clusters), it’s challenging to allocate costs to teams/features using native tooling.
- Data accessibility/analytics skills required. The raw export (via BigQuery) is powerful, but leveraging it for business insights demands SQL/analytics skills.
- Heavy reliance on resource labels. To allocate cost meaningfully, teams rely on labels, but resources may lack labels, label frameworks may change, and shared resources can’t be split cleanly.
- Granularity gaps. Native reports often lack fine-grained detail, such as per-job, per-endpoint, per-feature, etc., so root-cause analysis is complex. A common example is an inquiry about missing per-job billing in Vertex AI.
- Limited business-unit/product-level attribution. GCP billing is strong at showing spend by project or service, but weak at linking costs to business units, products, or customers without heavy manual effort.
- Time-lag and export caveats. Standard usage exports may not go back before enabling; dataset location matters; resource-level detail needs a “detailed export” rather than a standard one. Read more on the structure of standard data export here.
- Fast-moving-workload challenge. Dynamic workloads, such as containers, serverless, or AI jobs, may spin up/down quickly. Native tools may lag or not capture the business context around cost spikes.
- Complex discount and commitment impacts. While GCP supports discounts/commitments, linking actual spend/benefit to them and attributing savings across teams or products can be tedious.
You’ve seen the limits. The fix isn’t another chart, but cost data with business meaning — which is where GCP cost optimization tools and third-party platforms add genuine value. That’s where FinOps-level intelligence comes in.
Take Your GCP Cost Management To The Next Level With CloudZero
Now imagine this: You’re running a project on Google Cloud using Compute Engine, GKE, BigQuery, and cloud storage. You rely on GCP’s billing reports, budgets, and exports.
Everything looks fine until costs suddenly spike and the built-in tools can’t tell you why. This is a well-documented challenge with cloud cost management at scale.
You can see what you spent and where, but not who or what action caused it. Questions pile up:
- Which customer or feature drove the jump?
- Did a new deployment trigger extra GKE usage?
- How do we split shared VPC and egress costs?
- What’s our cost per API call or per tenant?
This is where CloudZero steps in.
What CloudZero adds on top of GCP
- Full cost mapping
- Ingests your BigQuery billing export, GKE metrics, and deploy events.
- Auto-detects services, teams, and environments — even with incomplete labels.
- Shared-cost allocation
- Splits VPC, NAT, and logging costs by traffic, CPU, or request volume.
- Automatically allocates Kubernetes costs by namespace, pod, or controller.
- Business context
- Maps spend to real units: customer, feature, product, or plan.
- Creates clear cost visibility for both finance and engineering.
- Real-time intelligence
- Dashboards show cost per customer, per feature, or per 1K requests.
- Detects spikes tied to deployments or configuration changes.
- Sends anomaly alerts on unit cost, not just total spend.
Leading organizations like Duolingo, Skyscanner, and Rapid7 trust CloudZero to bring clarity and control to their cloud spend.  to see how CloudZero helps teams like yours uncover cost per feature, customer, or product, and make every GCP dollar count.