The finance team says gross margins are slipping. Engineering says costs are under control.
Then you get THE question:
“How’s our gross margin trending?”
It’s a fair question. And it’s one of the first investors, acquirers, and board members will ask. After all, gross margin tells the story of your SaaS efficiency: how well you’re managing the cost of delivering your product and whether your business can scale without breaking the bank.
Yet, tracking and improving gross margin isn’t just finance’s job anymore.
As cloud spend grows more complex, AI workloads scale unpredictably, and shared services blur cost boundaries, engineering and product teams are also playing a bigger role than ever in shaping your margin outcomes.
What used to be a simple cost-of-revenue calculation is now a minefield of misattributed cloud spend, shared services, and margin-eroding technical debt.
This post is your map through that minefield.
We’ll explain what SaaS gross margin benchmarks are, what a healthy margin looks like today, and why some companies fall short. Then we’ll share how top-performing teams go beyond static benchmarks to make more profitable decisions.
What Are Gross Margin Benchmarks In SaaS?
Gross margin benchmarks are performance reference points that indicate how efficiently a company delivers its software relative to its revenue.
Put simply, gross margin = (Revenue – Cost of Goods Sold) ÷ Revenue.
For SaaS businesses, COGS (Cost of Goods Sold) typically includes:
- Cloud infrastructure costs (compute, storage, bandwidth)
- Customer support tied to delivery
- Third-party services required to run the product (APIs, databases, etc.)
- DevOps or SRE costs directly tied to uptime and delivery
- Software licensing fees related to service delivery
See more about the simple formula to calculate your SaaS COGS here.
Gross margin benchmarks, then, are the industry-standard ranges SaaS companies use to compare their performance against peers.
These benchmarks are handy for a bunch of reasons. Think of:
- Internal goal-setting (Are we improving delivery efficiency over time?)
- External comparison (How do we stack up against similar SaaS businesses?)
- Valuation discussions (Gross margin directly impacts profitability and multiples)
- Investor communication (Especially in growth-stage or IPO conversations)
Now, here’s the thing. Benchmarks give you a directional reference. They don’t tell you the whole story. Understanding your specific COGS makeup (and tracking cost per customer or product feature) is where your real power lies.
Let’s dive deeper.
playbook
The AI Cost Optimization Playbook
Traditional cloud cost management is broken. Here’s why — and how to make the switch to cloud cost intelligence.
Why Gross Margin Matters For SaaS Companies
The higher your gross margin, the more efficiently you’re operating, and the more cash you have available to invest in growth.
- For CFOs, gross margin determines how much budget is left to fund product development, sales, and marketing.
- For CTOs and engineering leaders, it’s a measure of technical efficiency, whether your architecture, infrastructure, and DevOps best practices are sustainable as you scale.
- And for SaaS founders, it’s often the difference between a profitable exit and a down round.
Also, whether you’re planning to raise capital, IPO, or just stay cash-efficient in a tighter funding climate, your gross margin is one of the first numbers they’ll scrutinize.
It’s a signal of how well you manage your COGS, how repeatable your business model is, and how much profit potential is baked into your core offering.
- If you are hitting 85% gross margin, you are generally highly efficient, especially if you operate in a cloud-native, software-only category.
- If you are at 55%, it may raise concerns. That is, unless you provide infrastructure-heavy or AI-driven services where margins are naturally tighter.
- But even within those ranges, it’s crucial to measure against your own unit economics, not just industry medians. A 78% margin might look solid on paper, but if your top 10 customers are running at 40%, say, due to infrastructure-heavy features or unmanaged cloud usage, you’ve got a margin leak hiding in plain sight.
Today, cloud costs are rising, investors are prioritizing efficient growth over growth at all costs, and pricing pressures are real, leaving less room for slippery cloud cost management.
Infrastructure decisions are also increasingly cross-functional. And this means engineering, finance, and product must all speak a common language around cost to protect the bottom line.
But there’s a problem — several, in fact.
Common SaaS Gross Margin Pitfalls To Avoid
Right off the bat, many teams treat gross margin as a quarterly finance metric. Like a lagging indicator rather than a dynamic performance lever (real-time cloud cost intelligence). This delay can obscure early warning signs, leading to decisions that drain your margins in surprise costs.
And that’s just the start.
Inconsistent or incomplete COGS
Some teams underreport COGS by leaving out key delivery costs, like cloud infrastructure, DevOps support, or third-party dependencies. Others over-attribute shared services, which inflates COGS and artificially lowers margins.
See: Why SaaS Companies Are Reporting Weaker Margins Today
Many also struggle to catch untagged or untaggable resources, usage, and related spend.
Without a clear, consistent SaaS COGS policy, your gross margin numbers won’t be accurate or useful.
Imprecise, non-actionable cost insights
Simple and cloud provider (native) tools often surface vague metrics like total cost of this or average cost of that. They do not offer the granularity you need to deliver spend insights by a specific team, feature, or individual customer.
That means you’re likely missing opportunities to spot unprofitable customer contracts, draining usage patterns, or inefficient features. And without that visibility, it’s nearly impossible to tie what’s being built to its impact on your gross margin.
Lacking engineering accountability
Cost-efficient code. Right-sized infrastructure. The right compute resources. These are all engineering decisions. Yet, too many SaaS companies still exclude engineers from cost conversations.
When engineering lacks visibility into the cost impact of their work, they operate in the dark. And COGS creep up unnoticed, until a surprise bill lands (and by that time, it’s already too late).
AI and ML workloads escape scrutiny
AI workloads, especially LLMs and GPU-heavy inference jobs, are becoming a hidden margin killer. See the State of AI Cost report here.
Many teams spin them up without clear ROI tracking or cost containment policies. And without those, AI-related cloud costs quietly balloon and eat into your margins.
Avoiding these pitfalls starts with visibility, but it doesn’t end there. It takes a shared understanding across finance, engineering, and product to stay ahead of the curve.
Enough about problems. Next, we’ll share how to beat the pitfalls so you can match up to your high-performing SaaS peers and mentors alike.
Use These 5 Strategies To Stay On Top Of Those SaaS Gross Margin Benchmarks
Here are the key strategies high-performing SaaS teams, like Moody’s, Grammarly, and New Relic, are using today to innovate profitably and stay ahead:
1. Track how infrastructure usage maps to business value
Picture this:
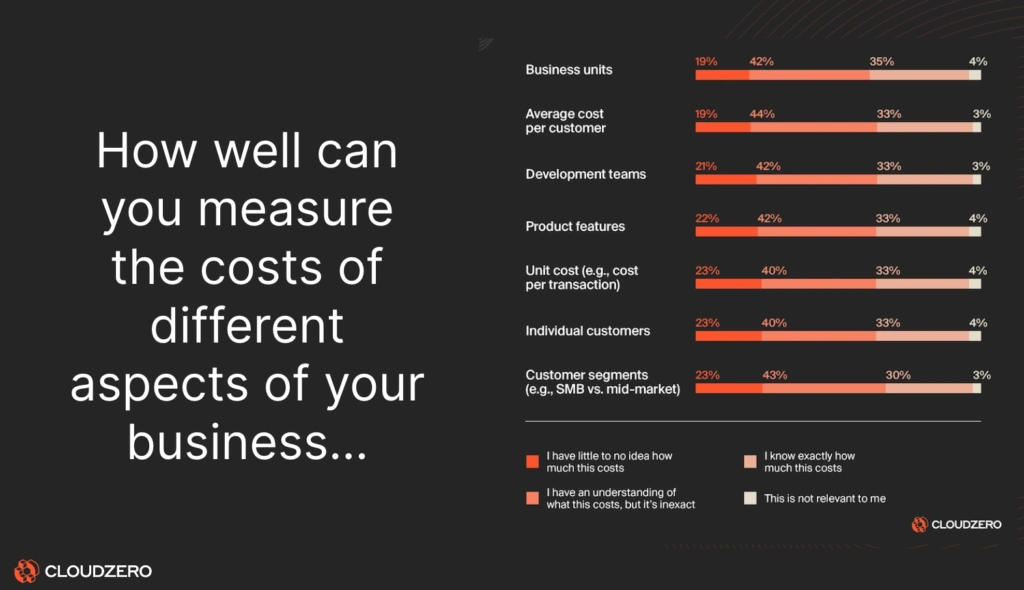
What you are seeing there is how often teams do not know what they are actually spending on in the cloud.
Over 20% said they have little to no idea how much different aspects of their business cost, while 42% reported that they can only give estimates. See the full State of Cloud Costs Report here. Or, see our deep dive here.
This is why tracking and mapping can help you identify high-cost customers, resource-intensive features, or underutilized environments.
How?
Use a robust cloud cost intelligence platform like CloudZero. This way, you can break down your cloud spend by individual customer, product, team, or deployment.
This can give both your finance folks and engineers the insight to make cost-efficient decisions in real time.
2. Establish engineering cost accountability without finger-pointing
The goal isn’t to punish engineers, but to empower them. This starts by making cost metrics visible, accessible, and aligned with how they work.
That means allocating spend down to services, requests, containers, or environments. You can use both metadata and contextual signals like Kubernetes labels or CloudFormation stacks.
You can also surface cost per deploy in the CI/CD pipeline and alert them via Slack when the spend deviates from expected baselines in a specific service or environment.
When cost becomes part of your engineering observability stack (instead of a postmortem), you can prevent margin erosion before it happens.
3. Run COGS reviews that combine finance + engineering + product
Quarterly business reviews (QBRs) aren’t just for sales anymore. You’ll also want to run cross-functional COGS reviews to spot trends, catch inefficiencies, and align on margin-impacting initiatives.
Some areas to review here include:
- Top COGS drivers by product line or customer segment
- Recent infrastructure changes and their margin impact
- Unused or underutilized resources
- AI/ML workloads. Review performance vs. cost
After that, set boundaries.
4. Set guardrails for AI and cloud cost experiments
The key here is to build a culture of controlled experimentation:
- Require cost visibility before scaling AI workloads.
- Track cost per model inference, SDLC stage, API call, and more.
- Set budgets and automate alerts per service, project, or environment. See how that works here.
We’ve gone deeper into how to understand, control, and optimize your AI costs in these guides:
5. Treat unit economics as a living metric
Gross margin gives you a high-level snapshot of your SaaS efficiency. However, it doesn’t tell you where that efficiency comes from, or where it’s being lost.
Unit economics do.
Unit economics is the practice of measuring how much it costs to serve one unit of value, whether that’s a single customer, user, product, feature, or request.
Where gross margin might tell you you’re running at 78%, unit economics tells you:
- Which customer segments are dragging your margins down
- Which features are the most (or least) cost-efficient to operate
- Whether your pricing model aligns with actual delivery costs
- Where your architecture is leaking value due to overprovisioning or shared service waste
In short, proper unit economics helps you close the feedback loop between what you build, how customers use it, and how it impacts your bottom line. And you can track it with metrics like:
- Cost per customer
- Cost per deployment
- Cost per feature or product line
- Margins by customer segment or contract type
This level of granularity helps you refine pricing, prioritize roadmap items, and justify infrastructure investments — all with margin growth in mind.
Yet, conventional cloud cost tools do not offer this level of cloud cost intelligence. CloudZero does.
Benchmarks Show You Where You Stand, CloudZero Shows You Where To Win
Benchmarks show you where you are against standards, competitors, and peers. But they won’t tell you how to level up — or how to turn that intel into your next competitive edge.
You also need more than quarterly reports and rough estimates. You need cost data that’s granular, real-time, and built for action. The kind that shows you exactly how much it costs to serve each customer, run each product, and ship each deployment.
And then what to do about it.
CloudZero helps engineering, finance, and product teams get this level of cloud cost intelligence automatically. Meaning you can make unit economics a real-time, always-on metric, not a quarterly guessing game.
You can see not just what you’re spending, but also why. And you won’t have to spend days wading through boatloads of billing data to know what to do next.
It’s the same approach we used to uncover over $1.7 million in savings from our own cloud setup. It’s how Upstart cut more than $20 million from their AWS bill, and how Drift saved $2.4 million.
Teams at Moody’s, Duolingo, and Grammarly also trust CloudZero to improve their gross margins, optimize unit economics, and build smarter from Day Zero.
Ready to move from “What’s our margin?” to “We got this”?  , and start getting ahead of those benchmarks with confidence.