

Quick Answer
SaaS unit economics measures the revenue and costs of a business on a per-customer basis, showing you whether each new user adds profit or burns cash. The core metrics are customer lifetime value (LTV), customer acquisition cost (CAC), LTV:CAC ratio, CAC payback period, gross margin, net revenue retention, and average revenue per user. A healthy SaaS business targets an LTV:CAC of at least 3:1, gross margin above 70%, and CAC payback under 18 months.
Every SaaS executive has had the same uncomfortable meeting. Revenue is up 30%. The board is applauding. Then someone in finance asks, “But are we actually making money on each customer?” The room gets quiet.
That question (and the silence that follows) is exactly why unit economics matter more than almost any other metric in your stack. Growth without profitable unit economics is just an expensive hobby. A Capgemini survey of 1,000 executives found that only 29% of organizations achieved expected SaaS cost savings, and only 37% even evaluate whether their cost management tools work.
This guide breaks down what SaaS unit economics are, which metrics to track, how to calculate them, what benchmarks to aim for, and how leading companies turn unit-level visibility into the strategic advantage that separates the profitable from the politely bankrupt.
What Are SaaS Unit Economics?
Unit economics is the study of a business’s revenue and costs measured per individual unit, usually a customer. The unit economics meaning is straightforward: what does unit economics mean in practice? How much does it cost to acquire, serve, and retain one customer, and how much revenue does that customer generate over their lifetime?
In SaaS economics, the “unit” is almost always a customer or subscriber account. What are unit economics in SaaS, practically speaking? They answer a simple question: does the math work at the individual customer level? If you spend $500 to acquire a customer who generates $1,500 in gross margin before they churn, your economics of one unit tells a story of sustainability. If you spend $500 and only recover $400, you are paying people to use your product, a bold strategy, but not one investors tend to appreciate for long.
The formulas that underpin unit economics are not complicated. The hard part is getting accurate data. Most SaaS companies know their top-line revenue and total spend. Far fewer can tell you what a single customer actually costs to serve, down to the cloud compute, storage, API calls, and support tickets that customer generates. That gap between “we know our total” and “we know our per-unit” is where most SaaS financial models quietly fall apart.
playbook
The AI Cost Optimization Playbook
Traditional cloud cost management is broken. Here’s why — and how to make the switch to cloud cost intelligence.
Why Unit Economics Matter More Than Top-Line Growth
There was a time when “grow at all costs” was a viable strategy. That time was 2021, and it ended badly for a lot of companies.
The market has corrected hard. Benchmarkit’s 2025 SaaS Performance Metrics survey found that the median SaaS company now spends $2.00 in sales and marketing to acquire just $1.00 of new ARR, a 14% increase from 2023. Bottom-quartile companies? They spend $2.82. At that rate, you are not acquiring customers; you are collecting them like expensive trading cards.
Meanwhile, median SaaS growth rates fell to 25% in 2024 (down from 30% in 2023) according to SaaS Capital’s annual survey. Growth is slowing while acquisition costs rise. The only way to stay profitable in that squeeze is to know, with precision, whether each customer is worth what you are paying to get them.
Negative unit economics can be acceptable in early stages when a startup is investing in growth. But if you have been in market for three or more years and your unit economics still don’t work, that’s not a growth strategy. That’s a math problem wearing a Patagonia vest.
This is the central tension of modern SaaS: the question is no longer “Are we growing?” It is “Was it worth it?” — was each dollar of spend justified by the value it created? Companies that can answer that question with data win. Companies that answer with “we think so” end up on the wrong side of the Rule of 40.
The 7 SaaS Unit Economics Metrics You Need To Track
If you are wondering what are SaaS metrics worth tracking, these are the SaaS key metrics, the key metrics for SaaS companies that determine whether your business model is sustainable.
They are the most important SaaS metrics, the SaaS metrics that matter, and the important SaaS metrics that investors, board members, and CFOs will ask about first. Consider this your SaaS metrics definitions rundown , every unit economics for a SaaS team needs this foundation.
1. Customer acquisition cost (CAC)
Customer acquisition cost is the total amount you spend on sales and marketing to acquire one new customer, in a given period.
The formula:
CAC = Total Sales and Marketing Spend / New Customers Acquired
This includes salaries, ad spend, tools, events, agency fees, and overhead. As noted above, the median SaaS company now spends $2.00 to acquire $1.00 of new ARR, but that number masks sharp variation by deal size. Benchmarkit’s data shows that solutions in the $10K–$50K ACV range are often more expensive to acquire than $50K–$100K deals, a counterintuitive pattern they have observed consistently across multiple survey years.
The mistake most teams make is measuring blended CAC instead of per-channel CAC. Blended numbers hide which channels burn cash and which drive efficient growth.
2. Customer lifetime value (LTV)
Customer lifetime value represents the total gross-margin-adjusted revenue a customer generates over their entire relationship with your company.
The standard formula:
LTV = ARPU x Gross Margin % x (1 / Monthly Churn Rate)
For example:
A company with $1,600 monthly ARPU, 80% gross margin, and 2% monthly churn has an LTV of $64,000. Change the churn rate to 1.5% and LTV jumps to $85,333, a 33% increase from a half-point improvement in churn. That is the kind of math that keeps retention teams employed and well-regarded at happy hour.
A common error: using gross revenue instead of gross margin in the LTV formula. A $100K ACV product with 80% gross margin contributes $80K to LTV, not $100K. Skipping the margin adjustment will overstate your economics and make your board very excited, right up until they figure it out.
3. LTV:CAC ratio
The LTV:CAC ratio is the single most-watched unit economics metric in SaaS. It answers: for every dollar you spend acquiring a customer, how many dollars of lifetime value come back?
LTV:CAC Ratio | What It Signals |
Below 2:1 | Unsustainable. Spending too much per customer |
3:1 | Minimum threshold for healthy growth |
4:1 to 5:1 | Strong. Room for reinvestment and scaling |
Above 5:1 | Potentially underinvesting in acquisition |
According to Bessemer Venture Partners benchmarks, top SaaS companies typically achieve CAC payback under 12 months.
Industry data puts median LTV:CAC around ~3:1 to 4:1. Optifai reports a 3.2:1 median across 939 SaaS companies, while Benchmarkit estimates ~3.5:1.
If your ratio is 8:1, that’s not always a win. It often signals underinvestment in growth, you may be leaving acquisition opportunities on the table.
4. CAC payback period
CAC payback period measures how many months it takes to recoup your customer acquisition investment through gross margin contributions.
The formula:
CAC Payback = CAC / (Monthly ARPU x Gross Margin %)
Phoenix Strategy Group’s 2026 analysis reports a median CAC payback period of 15 to 18 months for B2B SaaS, with elite companies targeting under 12 months. Benchmarkit’s data confirms that payback is highly correlated to ACV, larger deals take longer to recoup but tend to deliver stronger long-term profitability. SMB-focused companies with payback stretching past 18 months should treat that as a cash flow warning sign, regardless of what the LTV:CAC ratio says.
A 5:1 ratio with 24-month payback is worse for cash flow than a 3:1 ratio with eight-month payback. You can be profitable in theory and bankrupt in practice.
5. Gross margin
SaaS gross margin is revenue minus cost of goods sold (COGS), expressed as a percentage. For SaaS businesses, COGS includes cloud infrastructure, hosting, support staff, payment processing, and third-party software costs.
The median overall gross margin for private SaaS companies (including services revenue) is 77%, according to Benchmarkit’s 2025 report. Subscription-specific gross margins should be higher, 75 to 80% or above. If your total gross margin is below 70%, that typically signals a cost structure problem, not a pricing problem.
Gross margin matters for unit economics because it determines how much of each revenue dollar actually contributes to covering acquisition costs and generating profit. A 90% gross margin company and a 60% gross margin company with identical revenue will have dramatically different unit economics.
6. Net revenue retention (NRR)
Net revenue retention measures how much revenue you retain and expand from your existing customer base, after accounting for churn, downgrades, and expansion. It is the metric that separates SaaS companies that compound from ones that run in place.
The formula:
NRR = (Starting MRR + Expansion – Contraction – Churn) / Starting MRR x 100
Top performers hit 120%+ NRR, and Phoenix Strategy Group reports that companies at that level achieve 2.3x higher valuations. At 120% NRR, your existing customers generate 20% more revenue this year than last — before you acquire a single new account. That is the SaaS equivalent of compound interest, and your CFO will not stop talking about it.
For companies with high ARPU, nearly half achieve negative churn, meaning expansion revenue exceeds the revenue lost to downgrades and cancellations. At that point, you grow without acquiring anyone new. It is also the point where customer retention cost becomes the most important investment you make.
7. Average revenue per user (ARPU)
Average revenue per user (ARPU) is total revenue divided by total customers in a period. Simple, but revealing. ARPU trends tell you whether you are moving upmarket, whether your pricing holds under competitive pressure, and whether expansion motions are working.
ARPU matters for unit economics because it is a direct input to both LTV CAC payback calculations. An ARPU increase with stable costs improves every other metric in the chain. And if you are exploring pricing strategies built on unit economics data, ARPU segmentation is where you start.
How To Calculate Unit Economics For A SaaS Business
How to calculate unit economics comes down to getting four numbers right: CAC, ARPU, gross margin, and churn. Everything else is derived from those inputs. (If you want a shortcut, search for a unit economics calculator, several exist online, but understanding the underlying math matters more than any tool.)
Here is a worked unit economics example, one of many possible unit economics examples, for a mid-market SaaS company. Think of it as unit economics explained in the most practical way possible:
Input | Value |
Monthly ARPU | $2,000 |
Gross margin | 80% |
Monthly churn rate | 1.5% |
Monthly gross margin contribution | $1,600 |
CAC (fully loaded) | $12,000 |
LTV | $106,667 ($2,000 x 0.80 / 0.015) |
LTV:CAC | 8.9:1 |
CAC payback | 7.5 months ($12,000 / $1,600) |
That is a healthy unit economics model, strong ratio, fast payback, room to invest in growth.
Now change the monthly churn to 3%:
Input | Value |
LTV | $53,333 |
LTV:CAC | 4.4:1 |
CAC payback | 7.5 months (unchanged) |
Churn doubled, LTV halved, and the ratio went from exceptional to merely good. Notice that CAC payback did not change, payback is about short-term recovery, while LTV is about long-term value. You need both lenses.
How to calculate unit economics SaaS teams should prioritize: start with the four base inputs, calculate the derived metrics, then track monthly. The real power of unit economics analysis comes from watching these numbers move over time and understanding what’s driving the shifts.
SaaS Unit Economics Benchmarks: What Good Looks Like
Here is a consolidated SaaS metrics cheat sheet, the benchmark ranges for 2026, drawn from multiple primary sources.
Metric | Weak | Median | Strong | Elite |
LTV:CAC | <2:1 | ~3:1–4:1 | 4:1–5:1 | 5:1+ |
CAC Payback | 24+ months | 15–18 months | ~12 months | <8–10 months |
Gross Margin | <60% | ~70–75% | 75–80% | 80%+ |
NRR | <90% | 100–105% | 110–120% | 120%+ |
Monthly Churn | >3% | ~1–2% | ~0.5–1% | <0.5–0.8% |
ARR Growth | Flat | 20–25% | 30–50% | 50%+ |
Sources: Benchmarkit 2025, SaaS Capital 2024, Bessemer 2026, Optifai Pipeline Study 2026 (N=939), Phoenix Strategy Group 2026. These SaaS metrics benchmark vary by company size, ACV, and growth stage, but the ranges below reflect consistent patterns across leading SaaS datasets.
The trend line to watch: CAC is rising (up 14% year-over-year), growth is decelerating, and payback periods are lengthening. The companies pulling ahead are the ones improving retention and expansion, not just spending more on acquisition. A good SaaS metrics dashboard should surface these trends in real time, not in a quarterly review when the damage is already done. (For a more complete metrics catalog, see CloudZero’s guide to 17+ SaaS metrics to monitor.)
The underlying story these benchmarks tell is a shift the FinOps Foundation has been tracking for years — and one that modern FinOps practice is built around: the companies that win are not the ones with the biggest budgets. They are the ones with the clearest view of where every dollar goes, and whether it earned its keep.
Unit Economics For Startups Vs Scaling SaaS Companies
Unit economics for startups operate under different rules than those for established companies, but not forever.
Early-stage companies under $2M ARR can tolerate LTV:CAC ratios of 2:1 to 3:1 while establishing product-market fit. At that stage, you are buying information as much as you are buying customers. A unit economics startup example: a seed-stage company spending $500 CAC with a projected LTV of $1,200 (2.4:1 ratio) is not in crisis, as long as they are learning which customers retain and which do not.
The grace period ends around $5M ARR. By that point, investors expect ratio improvement, consistent payback under 18 months, and evidence that the model scales. If you have ever put together a unit economics slide for a board deck or investor pitch, you know the scrutiny these numbers receive. Growth-stage companies between $5M and $20M ARR should target 3:1 to 4:1. Above $20M, the bar rises to 4:1 or better.
What is unit economics for startups really about? Iteration speed. Early companies should calculate unit economics by cohort, by acquisition channel, by customer segment, by ACV tier, and use those cohort-level insights to kill what does not work fast. The startup that survives is the one that reaches healthy unit economics before the money runs out. This is less a financial insight than a survival tip, which is why it belongs on the office wall right next to the Jira board and the motivational poster no one reads.
For deeper modeling on how unit economics connect to cloud cost forecasting, CloudZero’s guide walks through the step-by-step process of building predictive models from unit-level data.
From SaaS Unit Economics To Cloud Unit Economics
Here’s where traditional SaaS unit economics hit a wall.
Standard metrics like LTV, CAC, and gross margin tell you whether the business model works at the customer level. What they don’t tell you is why it works, or why it is breaking. When your gross margin drops two points, is it because cloud costs increased? Which cloud costs? Was it compute, storage, data transfer? Which product or feature drove it? Which customer segment?
This is the gap that cloud unit economics fills. Cloud unit economics takes the same unit economics framework and applies it to cloud infrastructure spend — measuring cost per customer, cost per feature, cost per transaction, cost per API call, and cost per team, all tied to the specific demand drivers that generate business value. (CloudZero’s comprehensive guide to cloud unit economics covers the full framework in detail.)
FinOps unit economics, sometimes called unit economics FinOps in practitioner circles, is the practice of connecting cloud financial management to per-unit business metrics. It is how modern SaaS companies answer the question that traditional SaaS metrics can’t: “Was the spend worth it?”
The distinction matters because cloud spend is often a SaaS company’s second or third largest expense category. And here is the uncomfortable truth most SaaS companies discover too late: the reason their unit economics are unclear is not because the formulas are hard. It is because their cost data is a mess. Only 2% of organizations have a FinOps function that covers cloud, SaaS, and AI holistically, per the same Capgemini study. Everyone else is navigating with a map that is missing most of the roads.
Unit economics cloud visibility means knowing that Customer Segment A costs $3.40/month to serve while Customer Segment B costs $14.80/month, and understanding which segment generates more revenue per dollar of infrastructure. That is the level of granularity that turns cost management from a guessing game into a strategic function. It is also, for the record, the exact point where finance and engineering teams finally have something useful to talk about at the same meeting.
How CloudZero Connects Unit Economics To Every Dollar In Your Cloud
The biggest obstacle to actionable SaaS unit economics is not understanding the formulas. It is getting accurate, granular data from your actual cloud environment. Most companies know their total cloud bill. Very few can tell you what any individual customer, feature, or engineering team actually costs. And until you can, your unit economics are a theory, not a tool.
This is where CloudZero’s philosophy of cost per anything comes in. Traditional cost management asks, “What did we spend?” CloudZero asks, “What did it buy us?” — cost per customer, cost per feature, cost per transaction, cost per API call, cost per inference, cost per team. If a business outcome exists, it can be measured against the cloud spend that drives it.

CloudZero allocates 100% of cloud costs, across IaaS, PaaS, SaaS, shared infrastructure, containerized workloads, and multi-tenant architectures, to the business dimensions that matter.
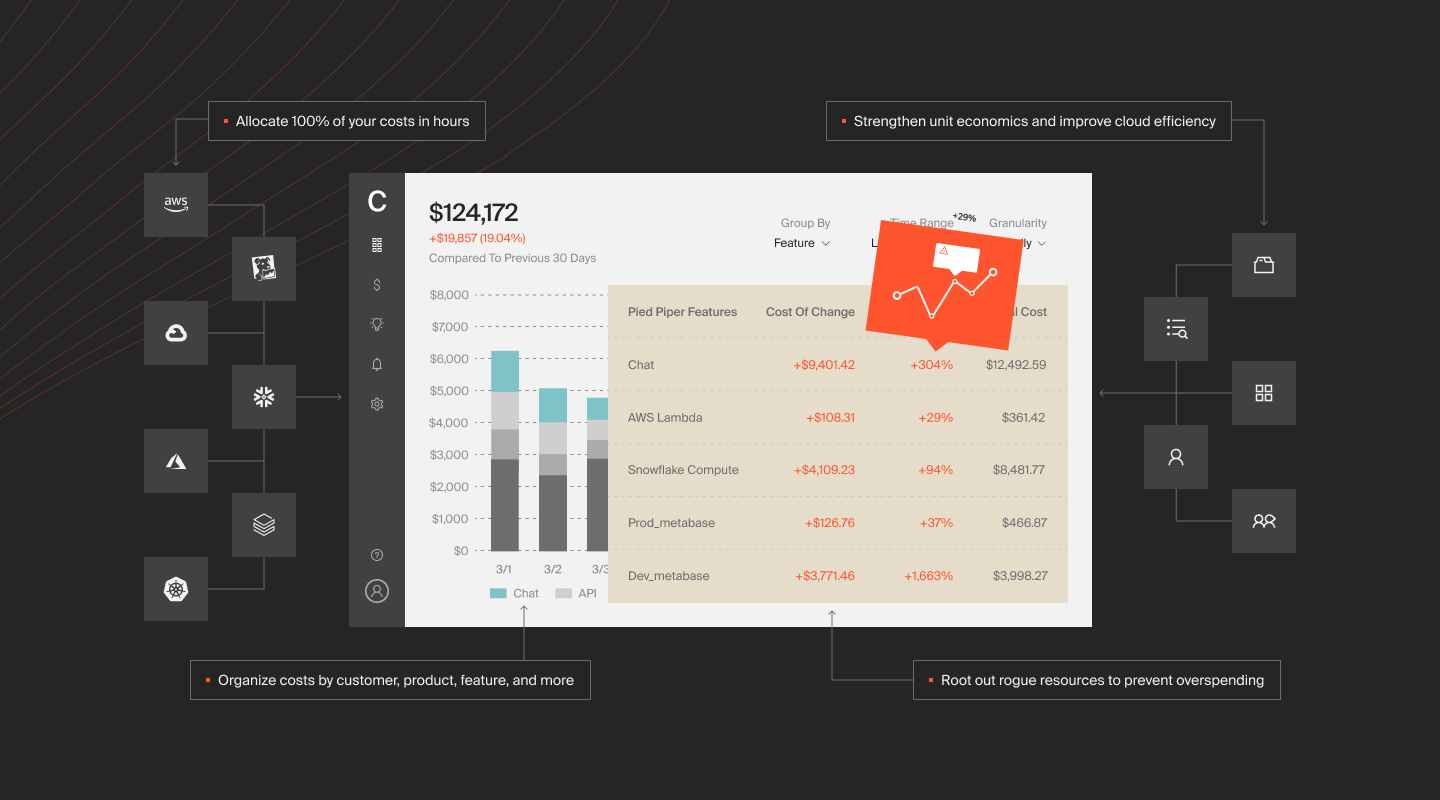
No tagging required. This is the foundation of FinOps unit economics done right, and it is why CloudZero’s customers can answer questions that most SaaS companies cannot even ask.
The results speak in specific numbers:
Upstart used cost per product and cost per organization to drive engineering accountability across teams, resulting in $20M in cloud cost savings by giving engineers direct visibility into how their architectural decisions affected spend. When engineers can see that a single design choice costs $40,000/month, they tend to find a better design choice. Quickly.
Neon grew engineering cost engagement by 700% through allocations like cost per team and cost per customer, turning cost from a finance-only conversation into an engineering sport.
CleverTap’s VP of Infrastructure Engineering, Francis Pereira, described an “organic cultural shift” after adopting CloudZero. Engineers who once made infrastructure decisions based on convenience began weighing cost efficiency into every build choice, because they could finally see the financial impact of their decisions in real time.
One CloudZero customer, a global SaaS platform serving over 40 million users running 50+ large language models, allocated costs per model, per region, and per customer segment. Feature-level allocation revealed cost per token and cost per user, driving over $1M in savings including a 50%+ reduction in compute spend.
CloudZero also introduced the Cloud Efficiency Rate (CER), a unifying benchmark that measures the percentage of revenue not consumed by cloud costs. An analysis of CloudZero’s publicly traded customers showed a 95% median CER, placing them in elite efficiency territory. CER gives boards and investors a single number that answers the question at the heart of every SaaS business: are we spending more efficiently as we grow, or less?
CloudZero’s 2026 FinOps in the AI Era report, a survey of 475 executives conducted with Benchmarkit, found that FinOps maturity has doubled while cloud efficiency has collapsed. The companies navigating that paradox are the ones treating unit economics as a real-time operating system, not a quarterly report.
When your SaaS unit economics live in a spreadsheet, they tell you where you were. When they live in CloudZero, they tell you where to go next.
 to see how leading global organizations such as Toyota, Duolingo, Coinbase, Skyscanner and more use CloudZero to connect cloud spend to business value. You can also get a free cloud assessment to see where you currently stand.
SaaS Unit Economics FAQs