Did you know that Google Search changes how it works about 12 times daily? For example, the internet search giant made about 4,500 changes to Search in 2020 alone. Those changes involved running more than 600,000 tests.
Most of us can barely tell how often Google updates because the modifications are subtle. But we can tell that something keeps improving.
Many other leading tech solutions do the same, from your tiniest mobile app to big ol’ Apple products. What drives the continuous improvement is a DevOps pipeline at its finest. Here’s how a DevOps pipeline works, how to get started building one, and some tools to help you simplify the process.
Table Of Contents
What Is A DevOps Pipeline?
A DevOps pipeline is the workflow that engineers use to design, build, test, deploy, and continuously improve a software product throughout its lifecycle. The process involves bringing together people, tools, and automation to deliver high-quality software or updates.
The DevOps pipeline acts like an assembly line made up of sub-stations, where representatives from development and operations prepare code for end users. Those substations look like this:
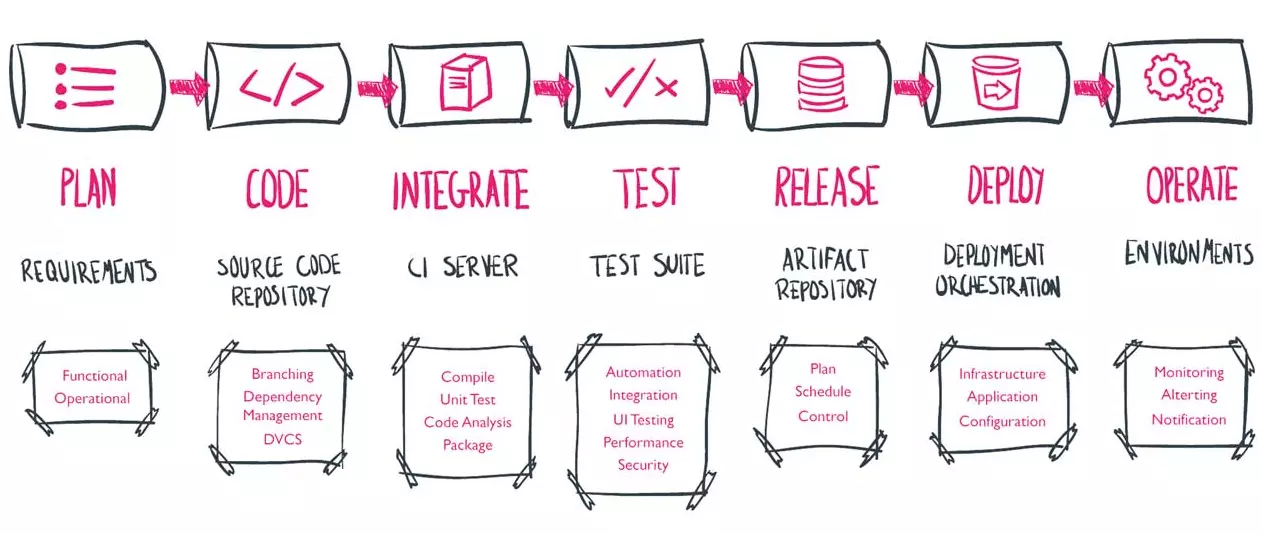
Credit: DevOps Group
These substations are known as the phases of a DevOps pipeline.
Each phase adds value to the code and evaluates it for success before it moves on. Should there be a failure along the flow, the pipeline stops, developers receive the feedback, and they work to fix the issue.
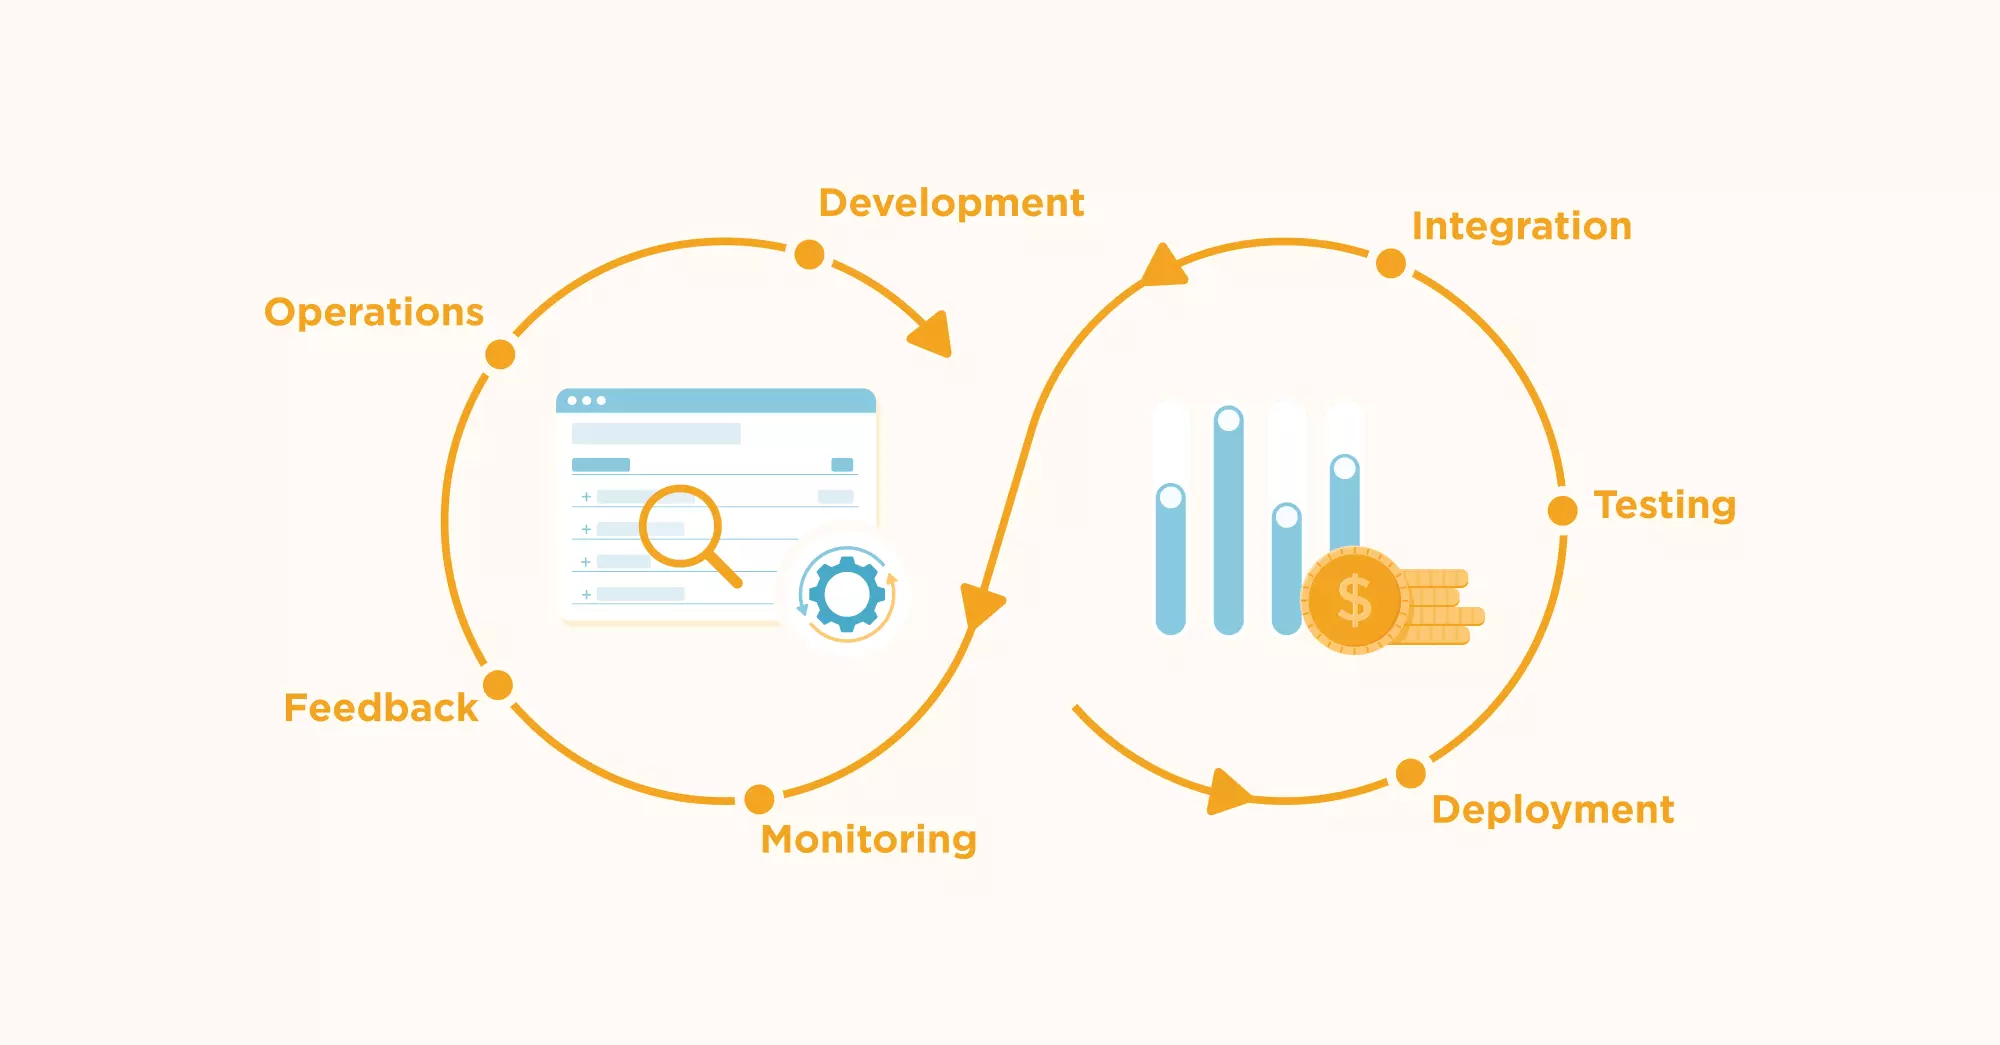
But here’s the thing. A DevOps pipeline isn’t a start-to-finish line. It is a loop, a continuous process of delivering better software faster. The DevOps pipeline actually looks a lot like this:
Now, if we wish to fully understand what goes on in each DevOps phase, it is essential to first look at the components of a typical DevOps pipeline.

What Are The Different Components Of A DevOps Pipeline?
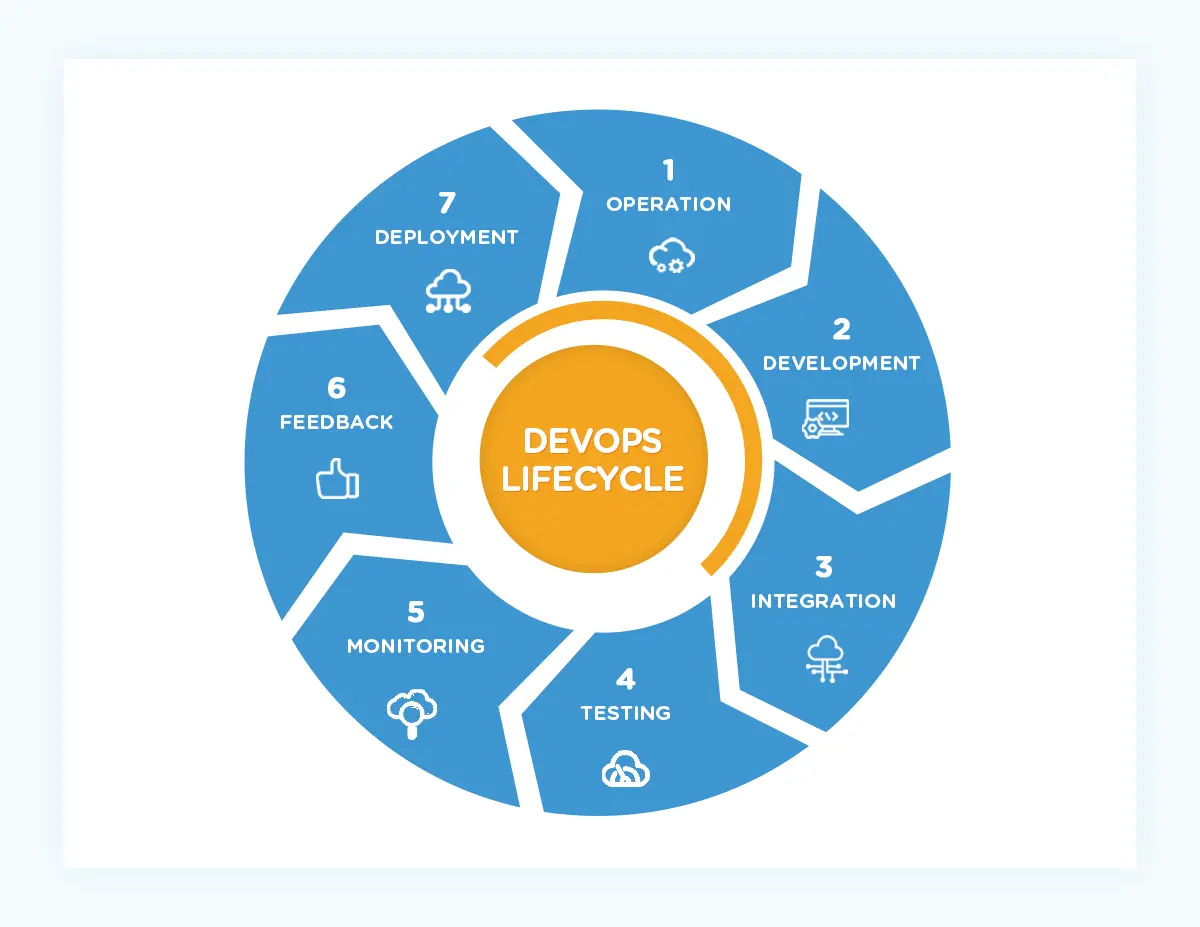
The seven main components are a combination of people, practices, and tooling, which together form the CI/CD pipeline of a DevOps workflow:
Continuous Development
Developers no longer write an application’s entire code before revealing and testing it. Instead, DevOps teams now continuously write smaller code batches and push them to a shared repository.
In this way, several developers can work on the same feature at the same time to speed up development.
Continuous Integration (CI)
Continuous Integration (CI) involves merging incremental batches of code from different developers into a shared code repository on an ongoing basis. Common repositories include GitHub, GitLab, and BitBucket.
CI encourages each developer to merge their progress as often as possible into the main branch. Code conflicts are easier to spot this way. Plus, each person’s contribution is less likely to diverge from their colleagues’ work when they can see how the project is progressing.
Continuous Delivery or Continuous Deployment (CD)
Continuous Delivery involves pushing the code to another environment once developers approve it. To accommodate that approval step, the code moves to a holding area after it passes the CI phase.
A developer has to manually push it to the next stage of the pipeline, which is the big difference between Continuous Delivery and Continuous Deployment.
In Continuous Deployment, a set of automation tools automatically release the code into a production-like environment to evaluate how it’ll behave. Teams that prefer deployment over delivery often move the code commits directly to production after passing all pre-defined tests.
Continuous Testing
The continuous testing process often automatically kicks in with every code commit.
- Regression testing ensures that a code change does not break existing functionality.
- Unit testing checks that a change delivers expected behavior.
- A functional test may require a person to use the updated version to see how well it works.
- Other tests include security, integration, and performance tests.
If a test fails, the failure prevents the new code from being merged or deployed into the main branch. And if your stack allows it, the code can automatically roll back so your developers can correct it before the entire application crashes.
Continuous Monitoring
A continuous monitoring process identifies, detects, and tracks various aspects that relate to the health of the system, such as performance, security, compliance, and even cost.
Continuous monitoring aims to identify potential issues before they become actual problems that lead to downtime and losses.
Read our in-depth guide for a comprehensive list of the best cloud monitoring tools available right now.
Continuous Feedback
Modern monitoring systems detect anomalies in real-time and alert designated team members accordingly. Depending on your monitoring stack, you can use the data to discover the root cause of the problem and thus reduce the time to resolve it.
Continuous Operations
In this phase of the pipeline, the focus is on constantly improving the product. The operations team collects operational feedback, combines it with customer suggestions, and passes both along to developers to inform future updates.
This ensures that the software product is always up-to-date, meets customer expectations, and is secure and compliant.
These are just the components. Here’s how they all work together within a DevOps pipeline.
So, How Does A DevOps Pipeline Work?
Although every pipeline is unique, the fundamental DevOps phases are similar across most organizations; Plan, Code, Build, Test, Release, Deploy, Operate, and Monitor.
A typical DevOps pipeline looks a lot like this:
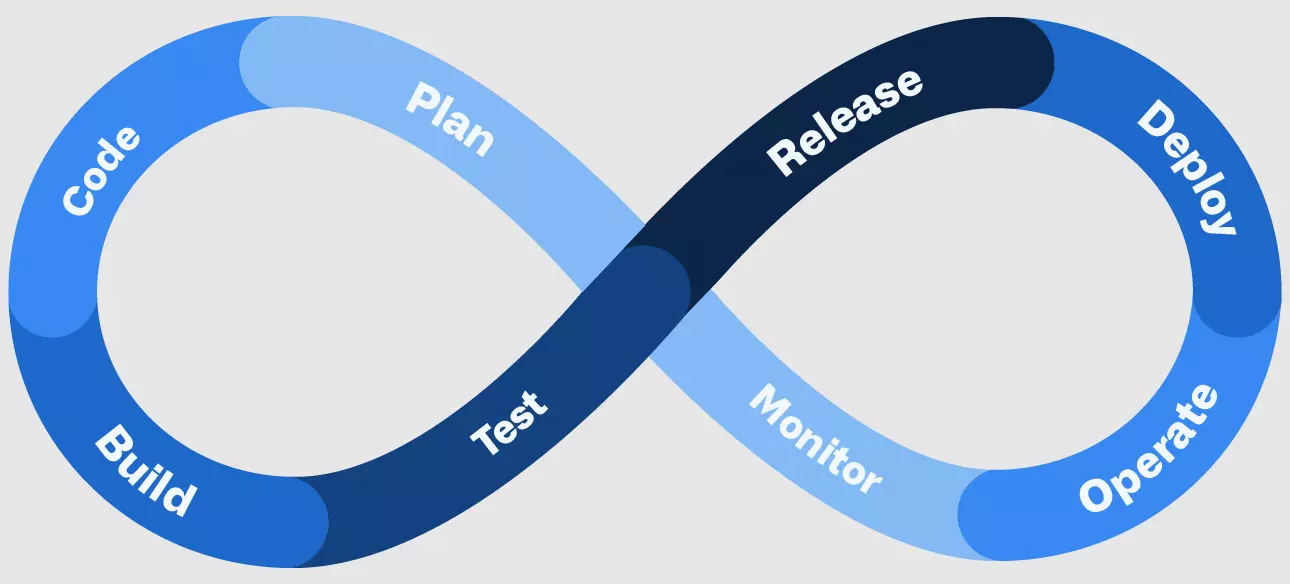
Credit: GitHub
Here are snackable briefs of each phase.
Plan
DevOps pipeline planning involves discussing either new features or fixes/updates to an existing product.
The brainstorming process involves people from different teams, including development, operations, management, and customer representatives. Working together, they decide which people, technologies, tools, and timelines to use.
For updates or fixes, the planning stage is where the team considers the implications of the change and develops backup plans to prevent application clashes when new changes are introduced.
Code
Here, developers start writing code to build a minimum viable product they can test. They follow the plan they’ve brainstormed with other stakeholders.
They also use Integrated Development Environments (IDEs), code editors, and a version control system like Git to merge their code and maintain consistency.
Build
Whenever developers are ready to share that code, they issue a pull request to their shared source code repository (a request to merge the new code with the main branch). Team members can approve the initial pull request once they’ve run tests to ensure the new code is error-free.
Sending the newest changes to the source code repo, so that it is merged with the main branch indefinitely is referred to as a code commit.
Meanwhile, a pull request activates an automated process that builds the minimum viable product (codebase, executable, or deployable package). It then performs a series of full integration and unit tests to detect any regressions.
A pull request fails if the build or any test fails. The developer then gets a notification to fix the issue. This phase ensures team members catch bugs and errors early on in development.
Test
Once a build passes the tests, it automatically deploys to a staging environment for further testing. Staging environments can be existing hosting services or new environments set up during the deployment process. This approach is referred to as Infrastructure-as-Code (IaC).
Team members then deploy the build to the test environment, triggering a series of manual and automated tests.
- Manual test types include conventional User Acceptance Testing (UAT) in which people interact with the build as an end user or customer would. The goal is to identify if there are any issues to refine before deploying to a production environment.
- Automated tests typically execute security scans, check for infrastructure changes, perform hardening checks, evaluate build/app performance, and conduct load testing.
Different organizations will have different testing methods and workflows for their specific app requirements. However, the testing phase of the DevOps pipeline is where you plug in robust testing without disrupting developers’ work or affecting your production environment.
Release
Once a build passes the testing phase, it is ready for rollout into a production environment. Here’s where you decide whether to use Continuous Delivery (manual releases) or Continuous Deployment (automated releases).
The Continuous Deployment route automatically rolls out new updates to customers or end users. But you can use feature flags to turn off those new features to the users until a certain time or milestone. With Continous Delivery, your system holds the rollouts until you approve them, once a milestone is passed, or on a scheduled release cycle.
Deploy
This DevOps pipeline phase involves actually pushing the tested build into a live production environment where end users can interact with it.
With a canary or Blue/Green deployment, you can switch to a new production environment without downtime (customers can’t see the changes yet and rollbacks are relatively easy). A new production environment is then built, and it sits in parallel with the existing production environment.
All new requests are pointed to the new environment once it is ready. If there are any problems with the new build, you can just instruct the hosting service to redirect requests to the old environment until you resolve the issue.
Operate
At this stage, the operations team takes leadership by managing aspects, such as infrastructure scalability and security at scale, to serve customers’/users’ needs. More importantly, the team develops a way to continuously request, record, and triage feedback that’ll help improve the product in future updates and additional features.
Monitor
Besides analyzing customer behavior and requirements, monitoring also collects and tracks infrastructure and application metrics that reveal performance, security, cost, and other measurable system health indicators.
You can use metrics, events, logs, or traces, or all of them, to measure the health status of your servers, website, network, application, infrastructure, etc.
Depending on which monitoring tool you use, it can automatically visualize, analyze, and share this information based on a team member’s role in the DevOps pipeline. Take an advanced cost monitoring solution like CloudZero, for example.

CloudZero organizes cost insights across cloud providers (AWS, Azure, Google Cloud) and services (Snowflake, Databricks, MongoDB, New Relic, etc) by role, like this:
- Engineers get to see insights such as cost per deployment, per feature, per environment, per project, per development team, etc. This way, your technical people can tell in their own language how their architectural decisions affect the entire company’s bottom line thereby creating more cost-effective solutions.
- Finance professionals can view cost per customer, per project, per team, per product, etc. These unit cost insights can help you tell how much to charge your service packages to make a profit, where to cut costs to protect your margins, and where to invest more to maximize returns.
- C-suite can easily tell their cost of goods sold (COGS), gross margin, and cost per team, as well as compare their scores with industry peers and internal targets. They then decide if they need to improve.
- The board and investors can view insights such as their gross margin and tell if that’s attractive to investors — and thus, what to do about it.
 to see CloudZero in action.
Monitoring is also a good time to determine whether your DevOps pipeline is optimal. For instance, are there bottlenecks that you could improve to boost developer productivity, feedback collection, continuous integration, etc.?
Another thing. The DevOps pipeline does not end here. Until the product is decommissioned, the pipeline is a continuous flow of development and operations. Think of it this way:
Monitoring reveals to the DevOps team features, fixes, and updates customers want, competitors are releasing, and internal users recommend they build and roll out.
What Are the Benefits Of A DevOps Pipeline?
The main benefit of using a DevOps pipeline is that it helps build, deploy, and maintain high-quality software that is always up-to-date, secure, and cost-efficient. Among the other benefits of adopting a robust DevOps pipeline are:
- Maintain a solid yet dynamic workflow to produce consistent deliverables across different stakeholders in the software development lifecycle.
- Build and roll out high-quality software through extensive and well-organized collaboration.
- Release new features, fixes, and updates faster.
- Leverage automation to deliver high-quality software frequently.
- Capture potential issues early to prevent application clashes in production.
- Continuously improve the product throughout its lifetime, ensuring it works for users and is up-to-date, secure, compliant, cost-efficient, etc.
Now, these are great results to have. So, how do you create a robust DevOps pipeline step-by-step?
How To Get Started Building A DevOps Pipeline?
You can ease every step of the process with DevOps tools, some of which we will highlight below. Also, you can start implementing your DevOps phases as soon as you have configured this basic pipeline.
Here are seven fundamental steps for building a DevOps pipeline.
1. Define your business planning
Once you receive a request to create an application from a customer, or need to build one for internal use, the next step is to plan how to accomplish it through a DevOps pipeline. Here are some factors to consider:
- Clearly lay out the business case for creating the app and how it’ll be used
- The people, skills, and programming languages required to build and manage the project at all phases
- The features to build
- The resources to meet the application’s performance, security, cost, and other requirements
- Choosing DevOps tooling, such as the best CI/CD tools
Also, define a communication loop that encourages continuous collaboration among developers, operators, customers, and project managers.
2. Establish a CI/CD approach
Some DevOps teams choose separate tools for the CI and CD components of the pipeline. Others prefer an end-to-end CI/CD pipeline tool, like Jenkins (open-source), Circle CI, Semaphore, or Harness CI/CD. Either way, CI/CD tooling empowers you to automate a lot of the otherwise manual work in the CI and CD workflow.
3. Configure a source control environment
Setting up a version control management platform will enable you to track all code changes your developers make to the main branch – whether they are all working on-premises or remotely from different countries.
Git is the most popular source control management system. Code-hosting platforms like GitHub, GitLab, BitBucket, and Subversion also enable you to manage versioning and source control management with powerful collaboration tools.
This step will help you:
- Check-in your source code from distributed developers
- Have it peer-reviewed to prevent bugs, errors, etc
- Use already peer-reviewed code in your build to save time and tap others’ work
- Perform versioning for the source code
- Define and follow a git workflow
4. Configure a build server
A build server provides a centralized, stable, and secure environment for developing distributed projects. It fetches merged code from source code repositories, serves as a point of integration for all developers, and ensures an untainted environment to maintain code integrity.
Jenkins, TeamCity, GoCD, and Travis CI are some tools you can use here. Maven, Ant, and Gradle are commonly used to build Java-based applications. BitBake and SCons are commonly used for Python-based projects.
The tools will help you accomplish tasks, such as compiling code once it is pushed to your repository as well as creating container images and pushing them to registry.
5. Build testing
In this step, you set up a way to test your minimum viable product (build, codebase, executable, or deployable package).
There are a variety of tests to consider, including unit, integration, functional, regression, penetration, UI, and load tests. Your choice will depend on the requirements of your application and the scope of your project. After configuring your build server (CI server), you’ll run the automated tests one by one.
There are several tools you can use here, including TestComplete (which has a Jenkins plugin), Mockito and JUnit (both for Java-based projects), and Pytest (for Python-based projects).
6. Configure your server infrastructure
Before you can deploy your container images or code to a production environment, set up your server infrastructure. For example, you need to install a web server for a web-based application, a virtual machine or instance for a cloud-based app, or bare metal servers for apps that demand dedicated servers.
This is also where your system automates choosing a deployment environment, handling variables, and drafting deployment scripts.
7. Manually or automatically deploy to production
The best practice for a new DevOps pipeline is to first use manual deployment to get a feel for how the process behaves. You can use canary or Blue/Green deployments, which are relatively less of a hassle to revert when there’s a problem. If you want to use automated deployments in the future, you’ll have figured out how to keep bugs and errors from a live environment.
What Are Some Popular DevOps Pipeline Tools?
We’ve already mentioned some of the best DevOps pipeline tools available today. But we also compiled a mammoth list of 55 DevOps tools you can choose from to build, automate, and optimize your pipelines.
DevOps Pipeline FAQs
Here are some answers to frequently asked questions about a DevOps pipeline.
What is the difference between a DevOps Pipeline and a DevOps Lifecycle?
The DevOps lifecycle refers to the process of applying DevOps best practices throughout the entire software development process.
Meanwhile, DevOps pipeline is a term used to refer to the repeatable workflow DevOps teams use to plan, code, build, test, release, deploy, operate, and monitor software more frequently and reliably.
What is the difference between a DevOps pipeline and a CI/CD pipeline?
A CI/CD pipeline is just one component that comprises the Continuous Integration (CI), Continuous Delivery (CD), and Continuous Deployment (CD) components of the overall DevOps pipeline.
What is the difference between DevOps pipeline components and DevOps pipeline stages?
In DevOps pipelines, the components consist of the people, processes, and tools that enable the technical work and its continuity, while stages are points at which a particular milestone should be completed.
What are the development and operations phases of a DevOps pipeline?
A top DevOps pipeline best practice is to avoid silos between developers and operations. However, development is often responsible for coding, building, testing, releasing, and deploying code, while operations mainly manage operations, monitoring, and relaying feedback.
How do you reduce or optimize your DevOps pipeline costs?
Use CloudZero. With our code-driven approach, you can accurately aggregate, normalize, visualize, analyze, and share unit cost insights in the language of engineers, finance, and FinOps teams — all without manual tagging.
CloudZero works at any stage of your cloud journey and DevOps pipeline — from measuring the cost of migrating a specific workload to the cloud to tracking the cost of supporting an individual product feature or customer on a per-hour basis.
CloudZero customers like Drift have already reduced their annual cloud bill by $2.4 million. to see how you can too.


The Cloud Cost Playbook
The step-by-step guide to cost maturity