The purpose of cloud monitoring is to identify, observe, track, and manage cloud infrastructure components and services. Cloud monitoring helps organizations ensure their services meet customer expectations of performance, availability, and security.
Companies also use cloud monitoring to learn how users interact with their business websites, applications, and other digital touchpoints. Collecting and analyzing telemetry from their app, website, server, database, or networks can provide insight into how customers use their services, product features, and other valuable insights.
As a result, companies can improve their software in a way that helps employees or customers accomplish their goals.
But many organizations’ clouds generate terabytes of data, making it hard to make sense of it, let alone use it.
Enter cloud monitoring services.
What Do Cloud Monitoring Tools Do?
Monitoring tools collect, centralize, enrich, visualize, and analyze cloud data and metadata. They help visualize this data and link it to specific use cases so it can make sense in a business context.
A powerful cloud monitoring tool will offer automated, real-time monitoring across an entire stack. It helps them make sense of metrics, logs, and traces from their cloud infrastructure, applications, and services.
A robust monitoring tool will also empower you to track multiple aspects of your cloud environment to gauge its overall health. You can perform:
- Server monitoring
- Database monitoring
- Application performance monitoring
- Website monitoring
- Virtual network monitoring
- Cloud infrastructure monitoring
- Security and compliance monitoring
These cloud monitoring solutions can help you identify service bottlenecks quickly so you can respond before they become costly problems. This benefits service delivery and informs proactive system improvements at the scale of modern computing.
Report
Finance needs to prove AI’s return: CloudZero report
260 senior finance leaders (more than half CFOs) told us why the speed of seeing AI spend, not the size of it, separates who pulls ahead on AI from who gets burned.
Cloud Metrics You Need to Monitor
To optimize cloud performance and cost, keep an eye on these key metrics:
- Billing and cost. Regularly review your cloud spending. Unexpected spikes could indicate inefficiencies or the need for resource adjustments.
- CPU use. Track the percentage of CPU your cloud resources use. High use may signal the need for scaling, while low use indicates over-provisioned resources.
- Memory usage. Monitor memory consumption to prevent application crashes due to insufficient memory and to identify underutilized resources.
- Network latency. Measure the time it takes for data to travel across the network. High latency can degrade application performance and user experience.
- Disk I/O. Keep tabs on the input/output operations per second (IOPS) to ensure your storage devices are not a bottleneck.
- Error rates. Monitor the frequency of errors in your cloud environment. A high error rate might suggest issues with application code or infrastructure.
- Request rate. Track the number of requests your application is handling. Sudden increases could necessitate scaling resources.
- Uptime and availability. Ensure your cloud services meet your uptime requirements, as any downtime can impact your business.
Most Important Factors When Choosing A Cloud Monitoring Tool
The right cloud monitoring tool is crucial for maintaining performance and cost efficiency. Consider these key factors:
- Cost. Consider the pricing model of the tool. It should align with your budget and offer good value for the features provided.
- Real-time monitoring. Look for a tool that provides real-time data and alerts, including anomaly detection. This enables you to respond to any issues or irregularities as soon as they arise.
- Automation. Automated alerts, actions, and reporting can save time and reduce the risk of human error. Choose a tool that supports automation where it matters most.
- Scalability. The tool should handle your current monitoring needs and scale as your cloud environment grows without degrading performance.
- Customization. The ability to customize dashboards, alerts, and reports is vital. It allows you to focus on the metrics most important to your business.
- Compatibility. Ensure the tool supports all the major cloud providers and services your organization uses. It should integrate smoothly with your existing infrastructure.
- Support and documentation. Reliable customer support and documentation are essential for troubleshooting and maximizing the tool’s potential.
- Ease of use. A user-friendly interface reduces the learning curve and increases efficiency. The tool should be easy to navigate and configure.
- Security. The tool must have robust security features to protect your monitoring data and comply with relevant regulations.
This guide shares tools that provide comprehensive monitoring capabilities in each cloud monitoring category.
Cloud Cost Monitoring Tools
Many organizations have struggled with cloud waste for the last several years. Choosing the right cloud monitoring software matters: BCG estimates that up to 30% of cloud spending is wasted, and the FinOps Foundation’s 2026 survey confirms waste reduction remains the top priority for cloud practitioners.
These cloud cost optimization solutions can help change that.
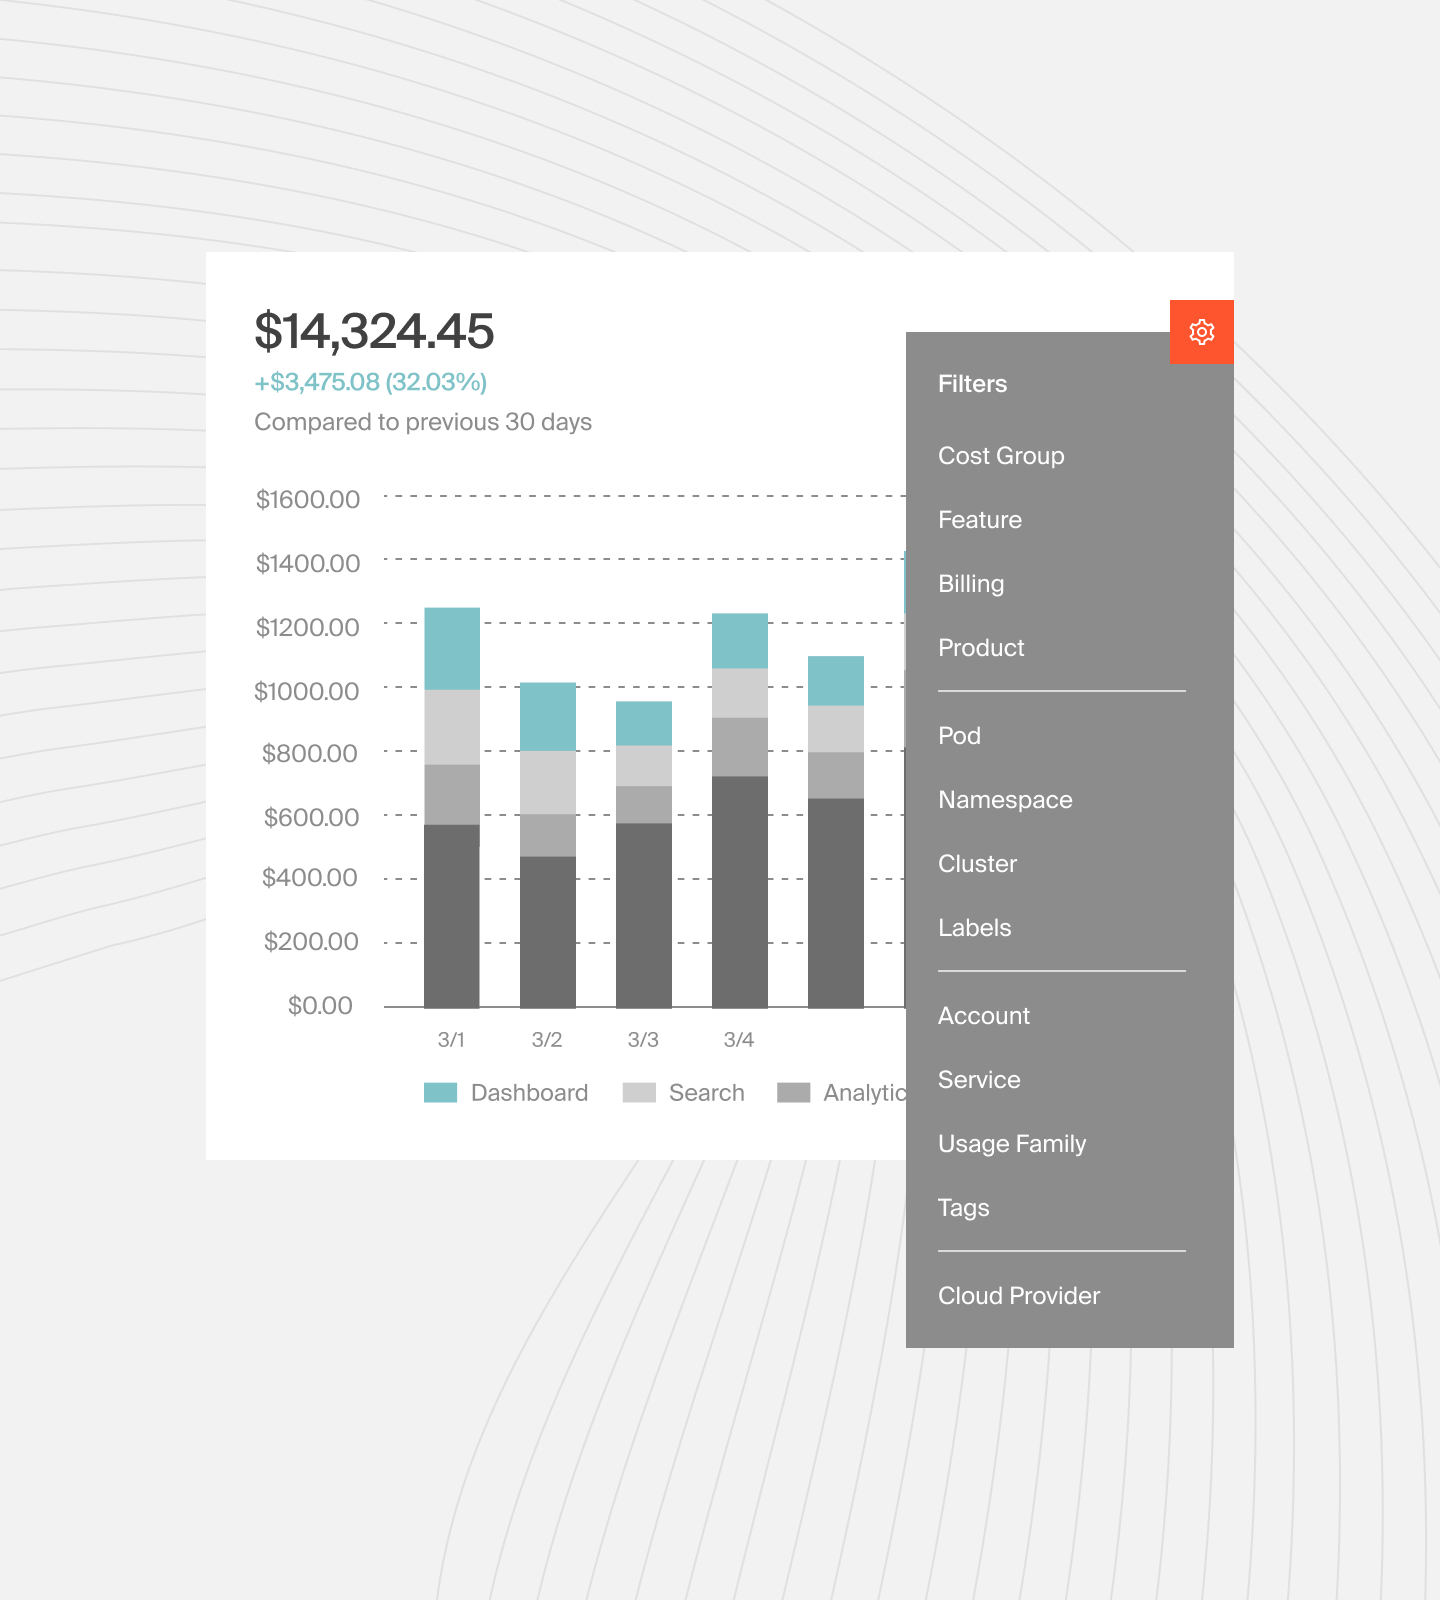
1. CloudZero – Cloud cost intelligence platform
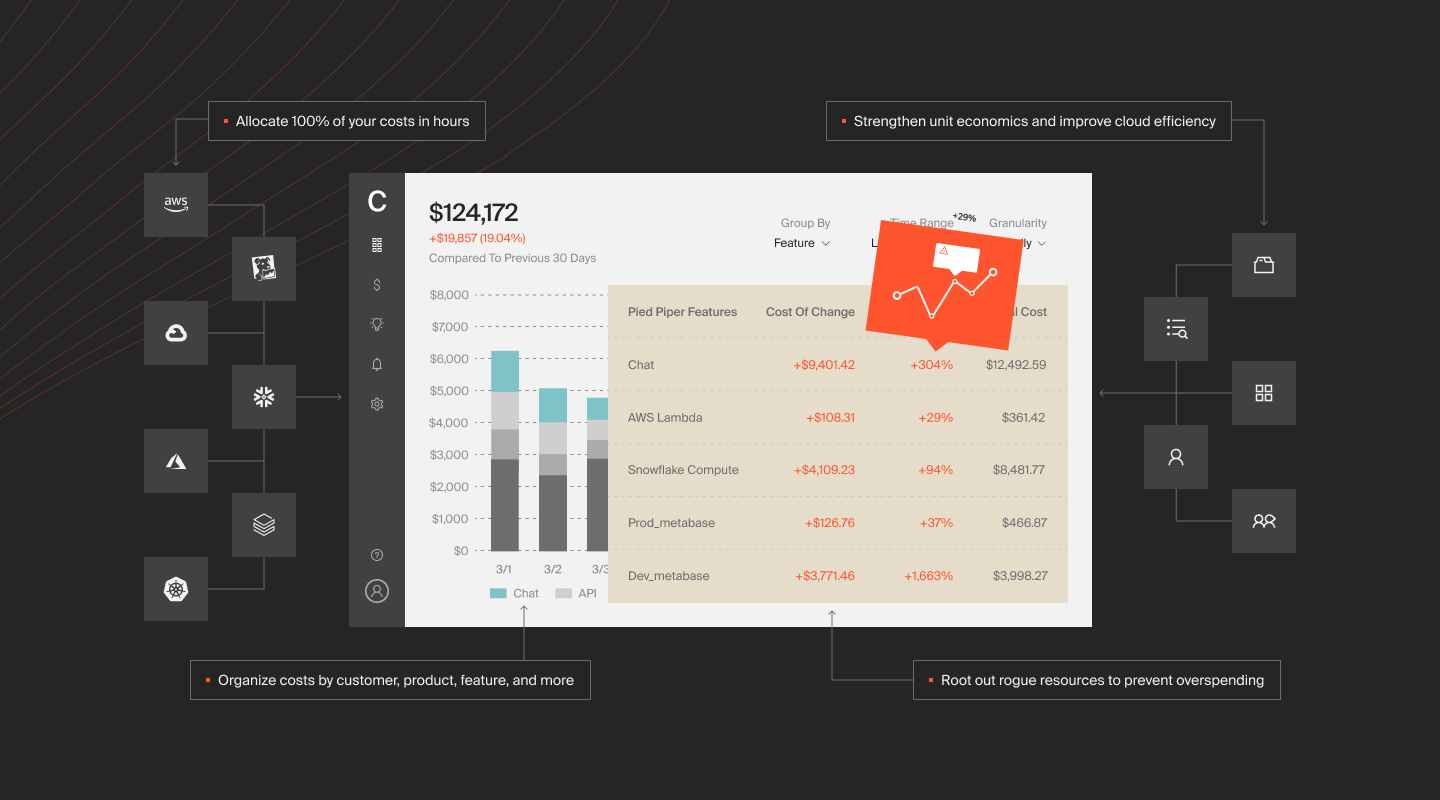
CloudZero provides unique insights into cloud computing costs, especially through unit cost analysis. With CloudZero, SaaS and technology brands like MalwareBytes, Drift, and Remitly have collected, analyzed, and shared AWS cost insights down to cost per customer, cost per environment, cost per team, cost per feature, etc.
CloudZero provides granular and contextual cost insights by role, which sets it apart from other cloud monitoring solutions.
For example, CloudZero shows engineers:
- Cost per product feature – View how much it costs to build, run, and support a specific product feature at every stage of the software development life cycle. This can help engineers avoid architectural choices that increase costs without commensurate ROI.
- Cost per dev team – Understand what each team spends throughout the DevOps process and why — so you can optimize its workflow to save costs without hurting velocity.
- Cost per deployment – Find out how much it costs to deploy a particular feature. Then track how this affects your total costs over time.
- Cost per project – Track the cost of every engineering project from start to finish. This information can help finance and management allocate adequate resources to similar future projects and prepare accurate quotes for customers.
Finance can use CloudZero to get:
- Cost per customer – View how much each customer costs to support so you can charge your services profitably.
- Cost per tenant – Gain a better understanding of the cost of supporting a specific tenant in a multi-tenant environment with shared resources.
- Usage and cost per product feature – Analyze your customers’ favorite product features, usage, and more. Then, decide whether moving the feature to a higher price tier will increase revenue without losing customers.
- Cost per project – Calculate ROI by determining the costs associated with each project.
CloudZero can also help C-suite executives, the board, and SaaS investors answer questions like:
- How would our costs change if we onboarded 10 more customers tomorrow?
- Do we take advantage of economies of scale?
- What trade-offs do we need to make to improve our costs per unit value?
- What is our utilization cost per feature per customer?
- How do we optimize this feature to improve our gross margin?
- What is our most valuable customer segment? Can we target them more effectively to improve profitability?
- What is driving our AWS bill up? Is it overspending, or is it healthy growth?
But do not just take our word for it. With CloudZero:
- Drift cut its annual cloud bill by $2.4 million
- Validity now spends 90% less time managing its cloud costs
Want to be next? Schedule a demo here and start saving money without sacrificing customer satisfaction.
2. Xosphere – Optimization for Spot Instances
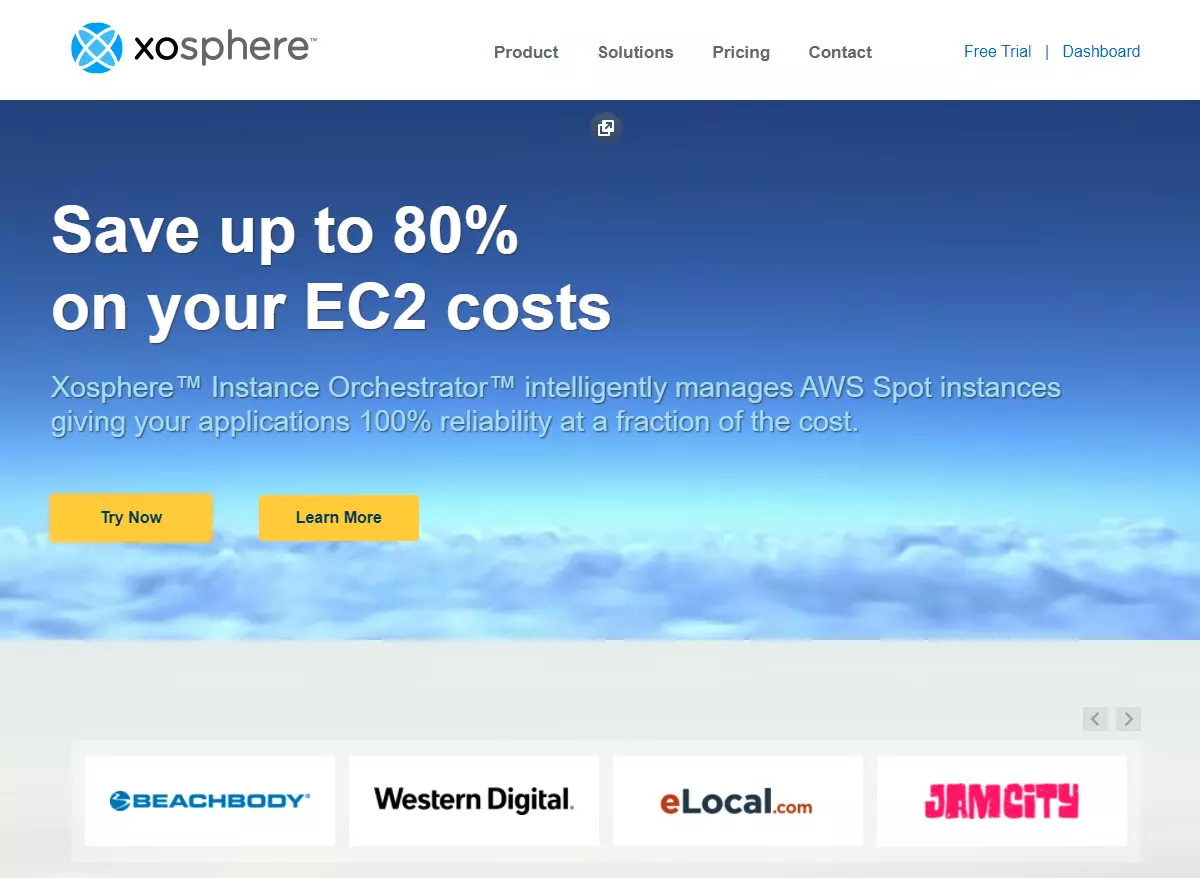
Xosphere Instance Orchestrator automatically replaces On-Demand Instances with Spot Instances when available for a reasonable price. It continuously scans your environment to ensure you use the most cost-effective instances. As Spot Instances become uneconomical, Xosphere intelligently replaces them with On-Demand Instances.
This transition does not affect your system’s performance or cause your applications to be unavailable. In addition, Xosphere supports applications written in any language or platform, containers (Kubernetes, EKS, Mesos, ECS, Rancher), and your favorite data stores, including Elasticsearch, MySQL, Redis, and Cassandra.
3. ProsperOps – AWS Savings Plans and Reserved Instances optimization
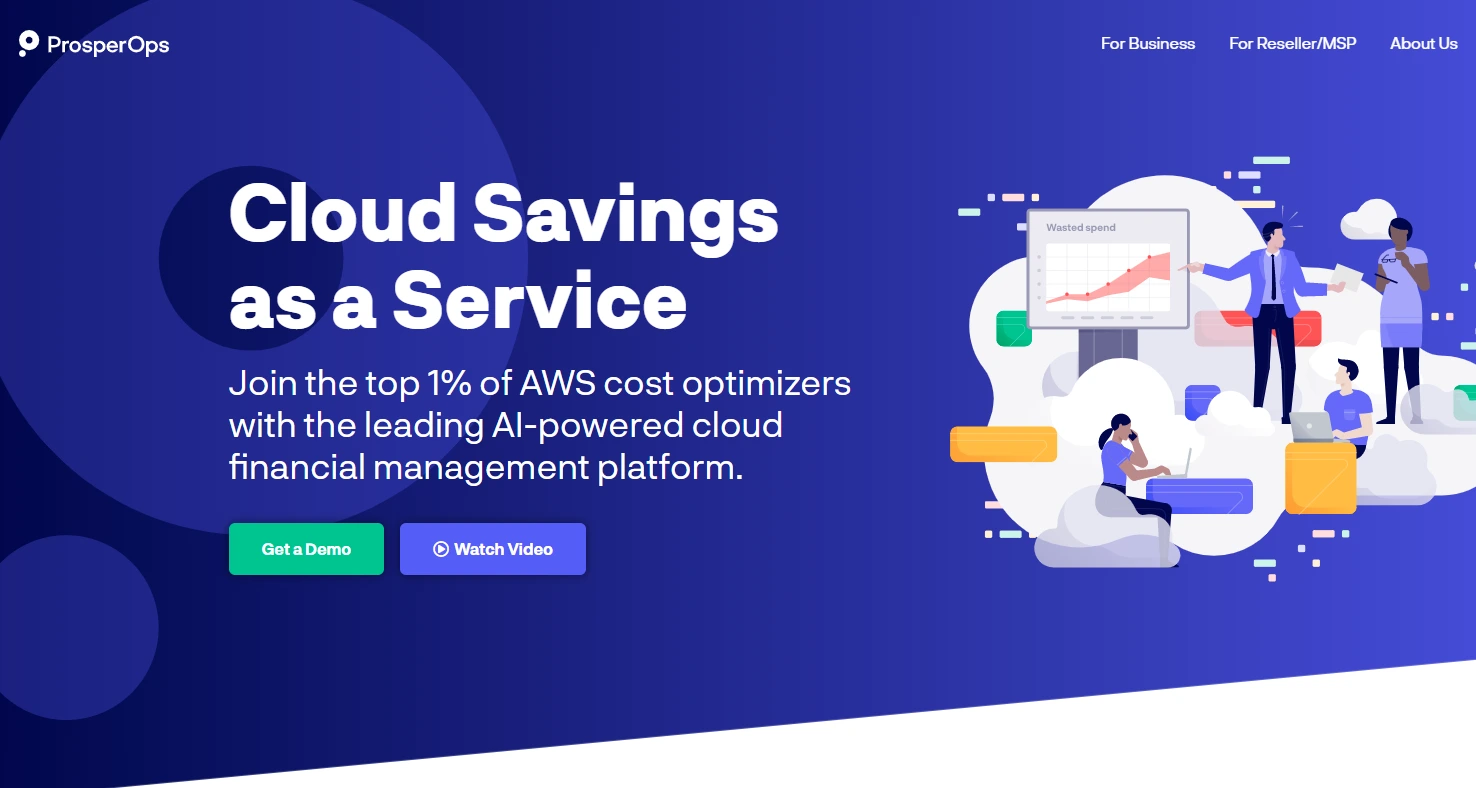
You likely purchased AWS Savings Plans or Reserved Instances (RIs) expecting to save up to 72% off regular On-Demand pricing. In reality, most customers save less than 20%. With ProsperOps, you can access an autonomous savings management platform, which can help you save up to 40% more on SPs and RIs.
ProsperOps helps reduce commitment risk for short-term projects like testing and deployments. For example, the platform can help you choose the right AWS instance for your workload or project timeframe, allowing you to maximize savings while achieving optimal system performance.
4. AWS Cost Explorer – Native AWS cost monitoring Tool
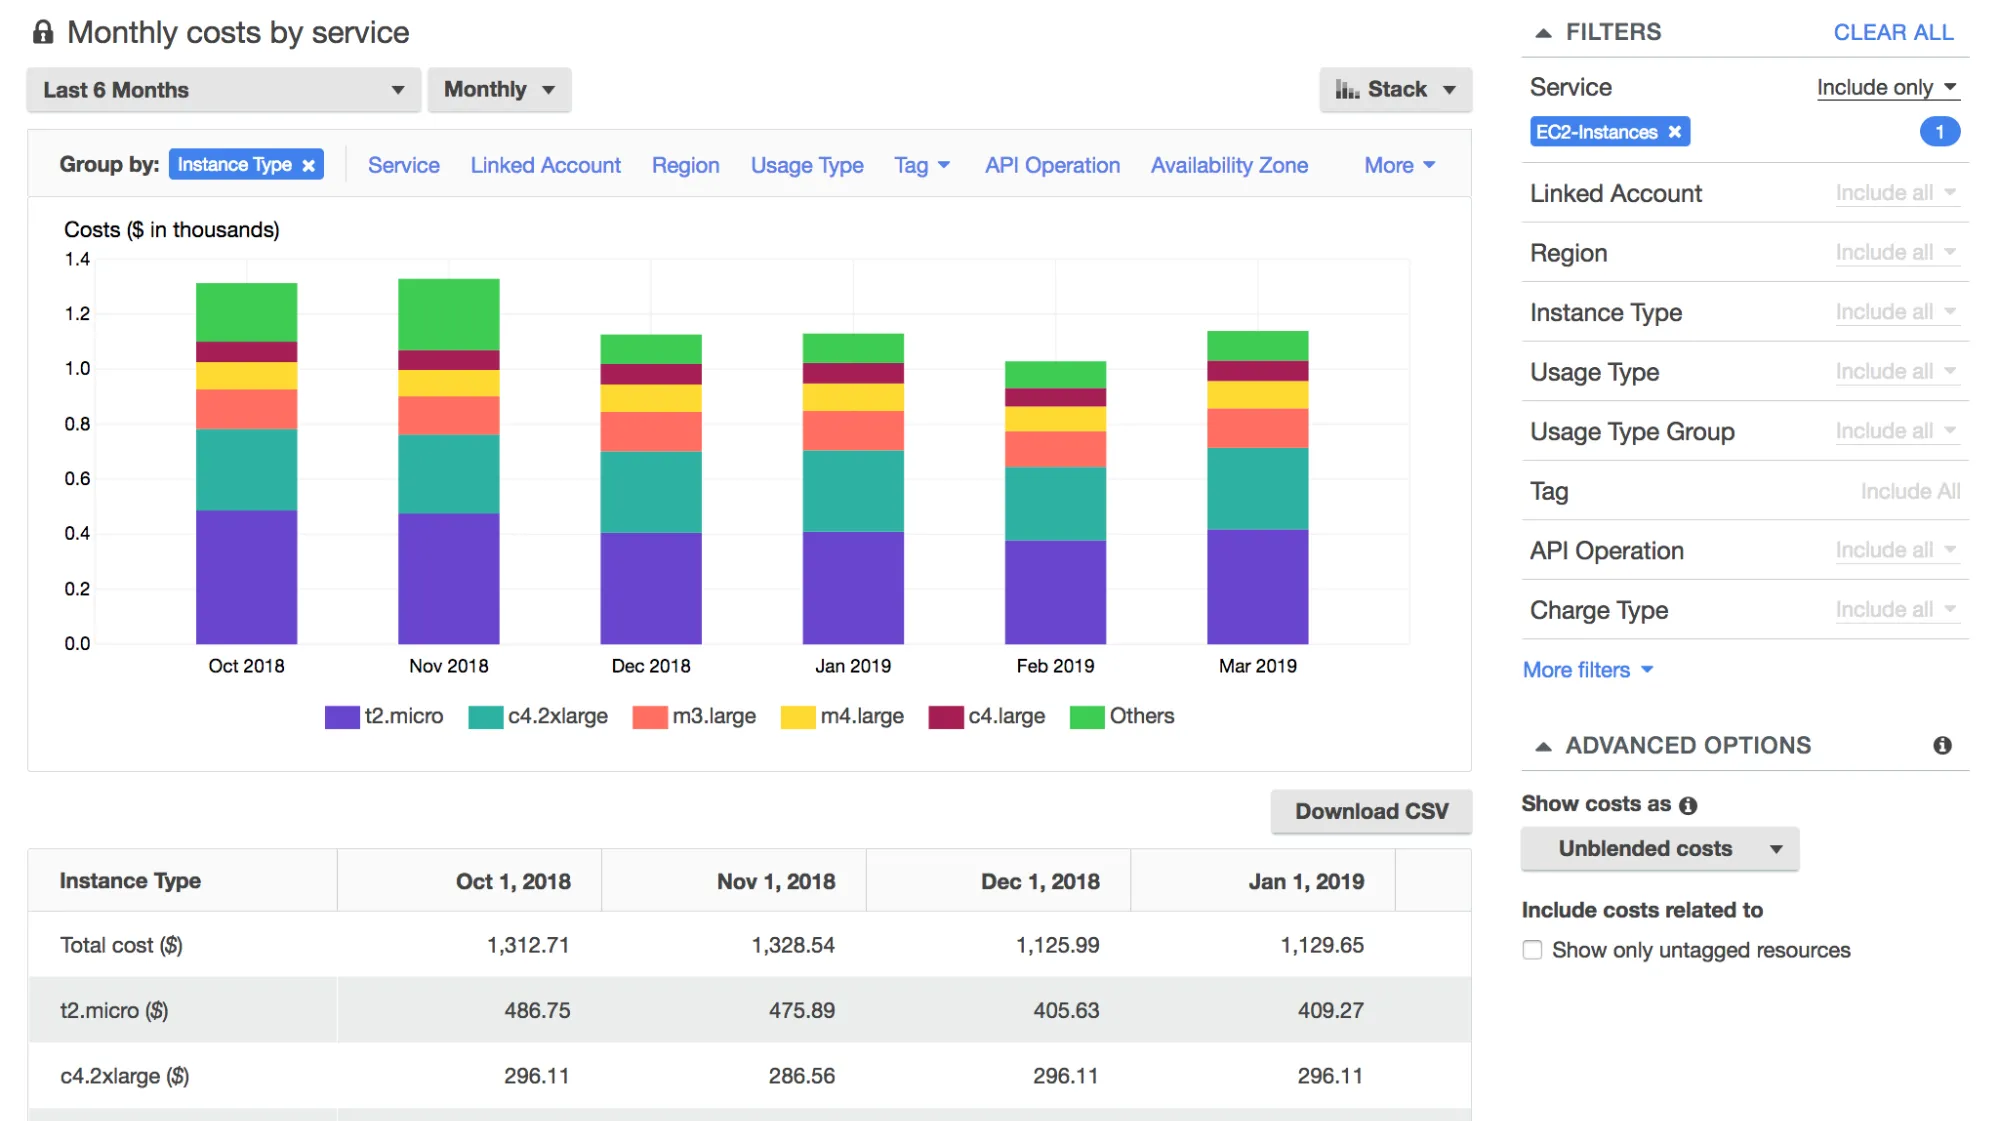
Cost Explorer forms the backbone of cost monitoring and reporting in AWS – alongside Cost and Usage Reports. It features an easy-to-use interface, combines metrics from multiple AWS services in one place, and provides cost analysis over time. Besides filtering cost and usage data, you can also use 13-month historical data to predict future costs for the next 12 months.
Besides Cost Explorer, AWS offers several other cloud financial management tools. These are ideal if you have a straightforward cloud bill.
- AWS Cost and Usage Report
- AWS Cost Categories
- AWS Budgets
- AWS Cost Allocation Tags
- AWS Cost Anomaly Detection
- AWS Trusted Advisor
- AWS CloudWatch
AWS customers can also find more AWS cost monitoring tools here. Yet, you may need a more sophisticated tool as your AWS usage and costs grow (CloudZero) or adopt a hybrid or multi-cloud approach (SolarWinds).
5. Cloudability – Hybrid cloud cost monitoring platform
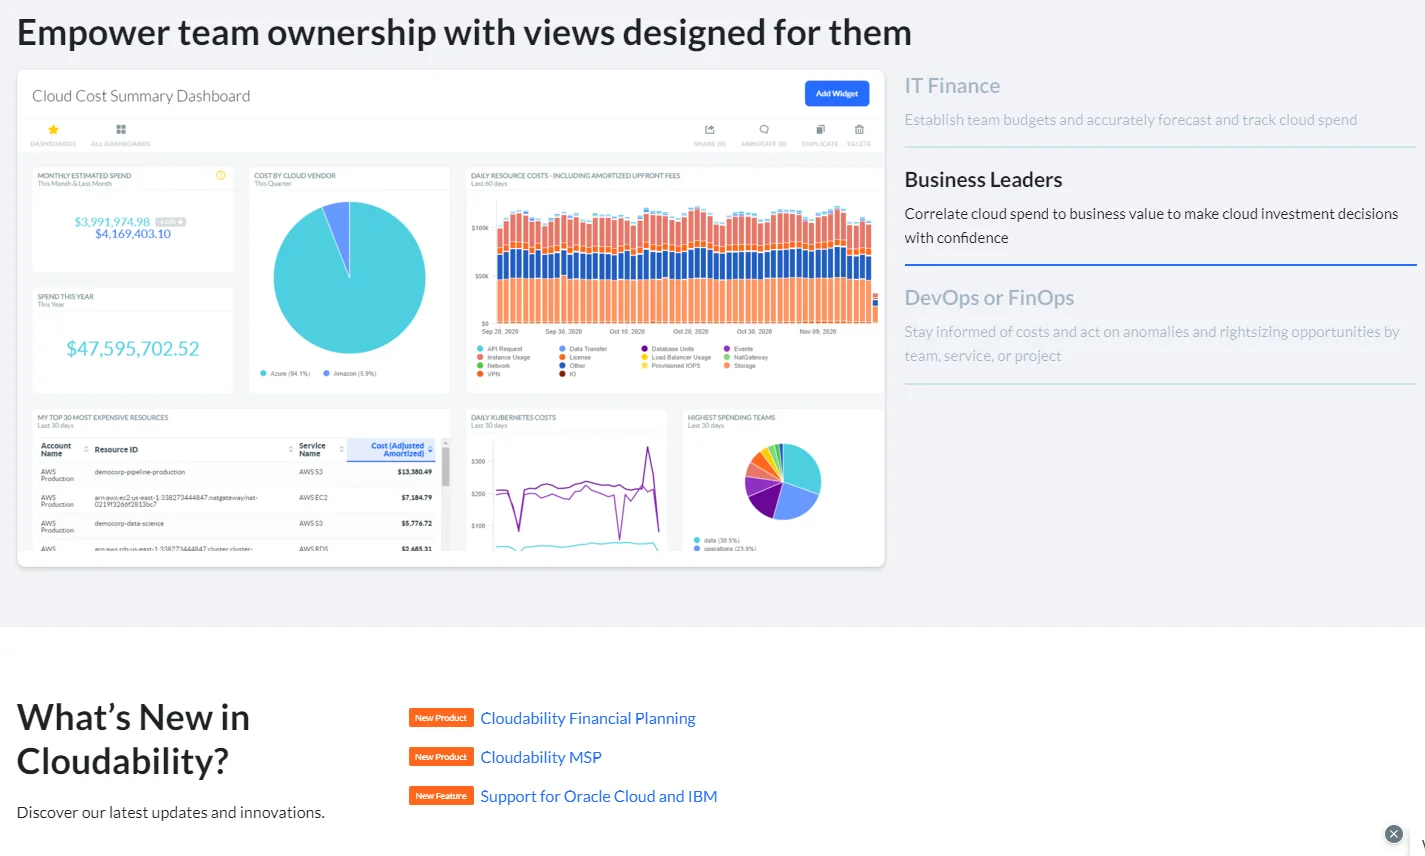
For a more traditional approach to tracking costs across cloud services like AWS, GCP, and Azure, Apptio’s Cloudability is a good choice. Cloudability also provides budgeting, forecasting, cost-saving recommendations, and anomaly alerts. But for Cloudability to work effectively, you’ll also need to have a solid tagging strategy.
To compensate, Cloudability offers a tag explorer you can use to find missing cost allocation tags and manually add them for more cost data. However, unlike CloudZero, you cannot view costs in more granular terms, such as untagged resources, cost per hour, deployment, or product features.
If you want, here are some alternatives to Cloudability that you might be interested in.
Application Performance Monitoring (APM) Tools
An application performance management tool — often called a cloud performance monitoring solution — provides visibility into software application issues before they cause problems, which is crucial to any stack’s management. An ideal tool provides real-time, contextual application performance monitoring. This can help you quickly identify issues, respond to them, and fix them before negatively impacting customer experiences and revenue.
Some top APM tools include:
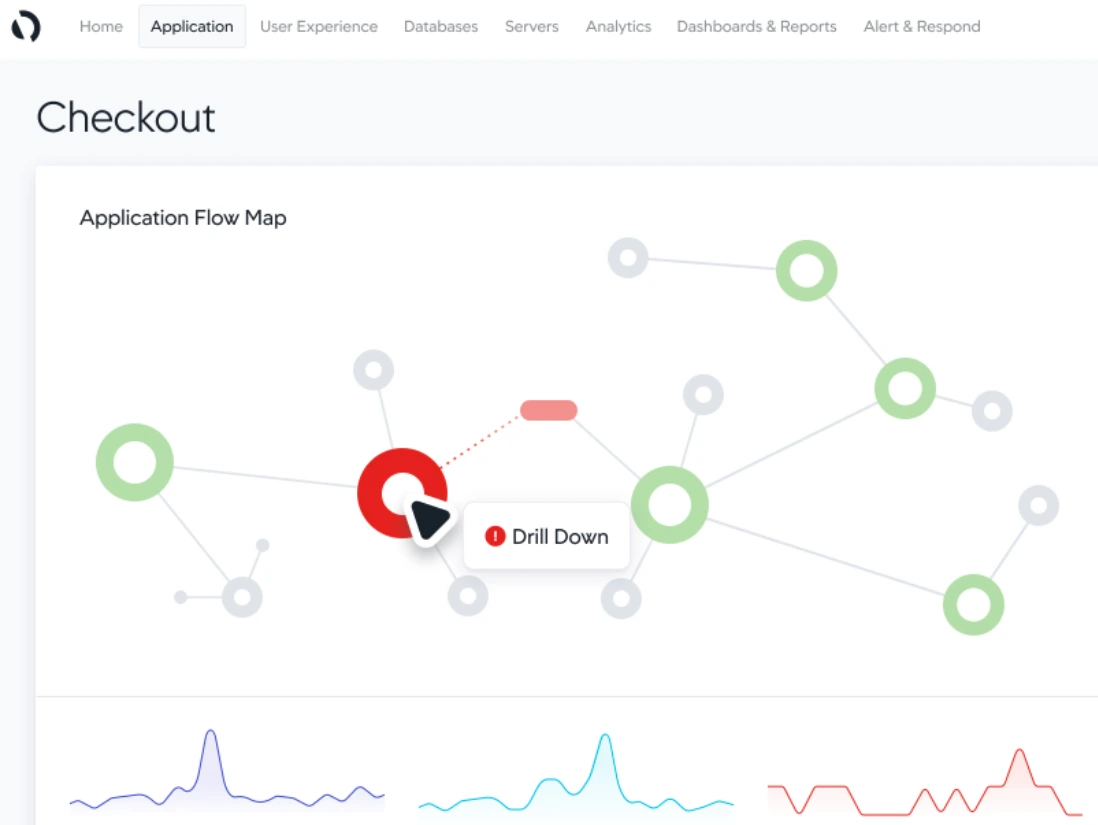
6. New Relic – Monitoring tool for apps and microservices
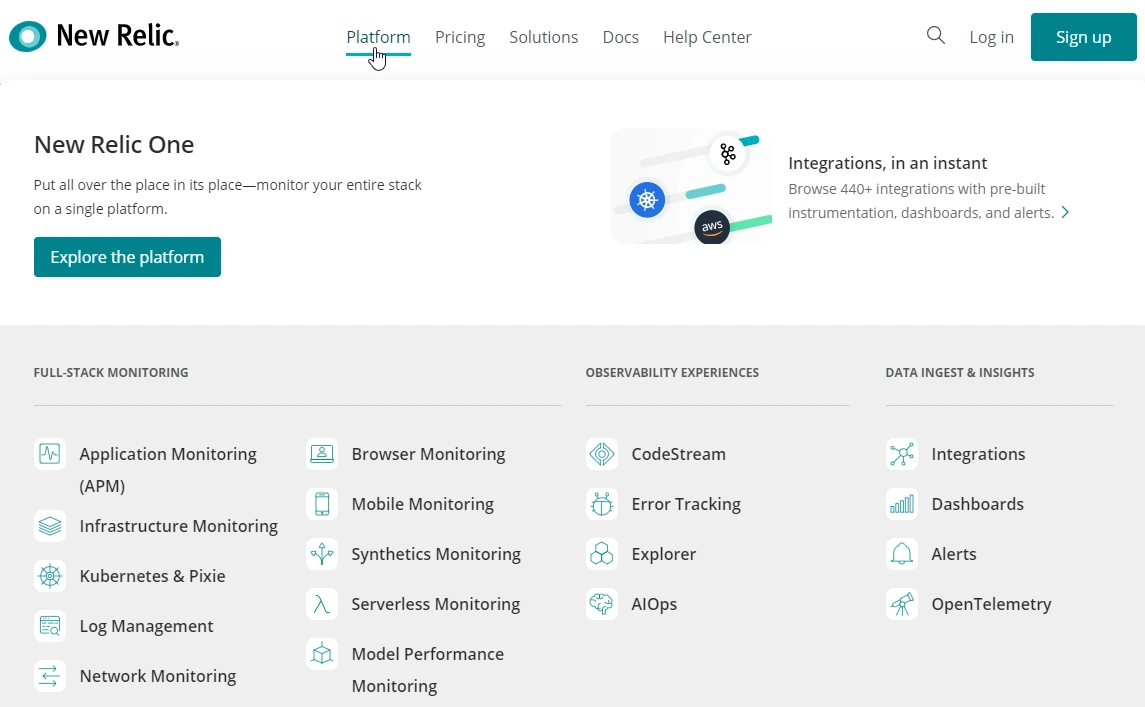
New Relic is a modern, full-stack, and visually stunning monitoring platform. You can use it for monitoring, troubleshooting, and improving mobile, cloud, web, and on-premises environments. It also supports real users, microservices, logs, traces, synthetics, and multi-cloud resource monitoring.
In addition, New Relic offers rich visual insights with Grafana Dashboards. It also displays the specific method calls for various app sizes to help determine incidents’ root causes. You’ll also access New Relic’s powerful query language (NRQL) and a comprehensive free plan to test its application monitoring capabilities.
7. AppDynamics – Full-stack APM solution
AppDynamics gathers, visualizes, tracks, and reports insights into application performance at the code execution level.
The tool supports real-time APM. The Cisco monitoring tool supports over six programming languages, automatically identifies application topologies, and troubleshoots application issues such as errors, slow response times, and malfunctioning components. AppDynamics also supports end-to-end server, real-user, infrastructure, and database monitoring in hybrid cloud environments.
8. Retrace – Developer-centric application performance monitoring
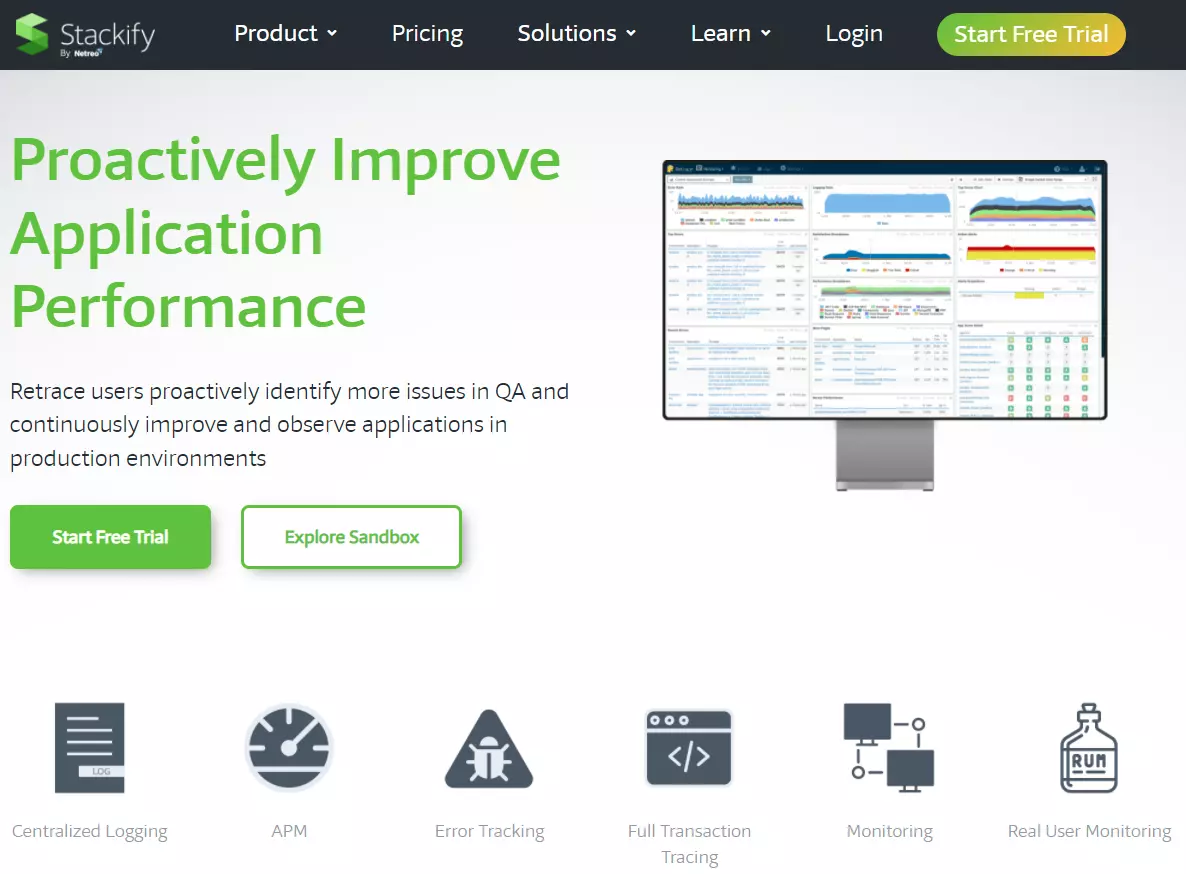
Stackify designed Retrace for developers to find app performance bottlenecks with code profiling. It supports complete transaction tracing. That includes tracking how your code executes SQL queries and async code performance. You can also view exceptions and logs side-by-side and proactively detect app bugs.
With centralized logging, you can use structured logging and log tags to analyze logs across servers and applications. In addition, Retrace includes error tracking and real user monitoring with Apdex user satisfaction tracking.
9. Sumo Logic – Multi-cloud observability and security monitoring
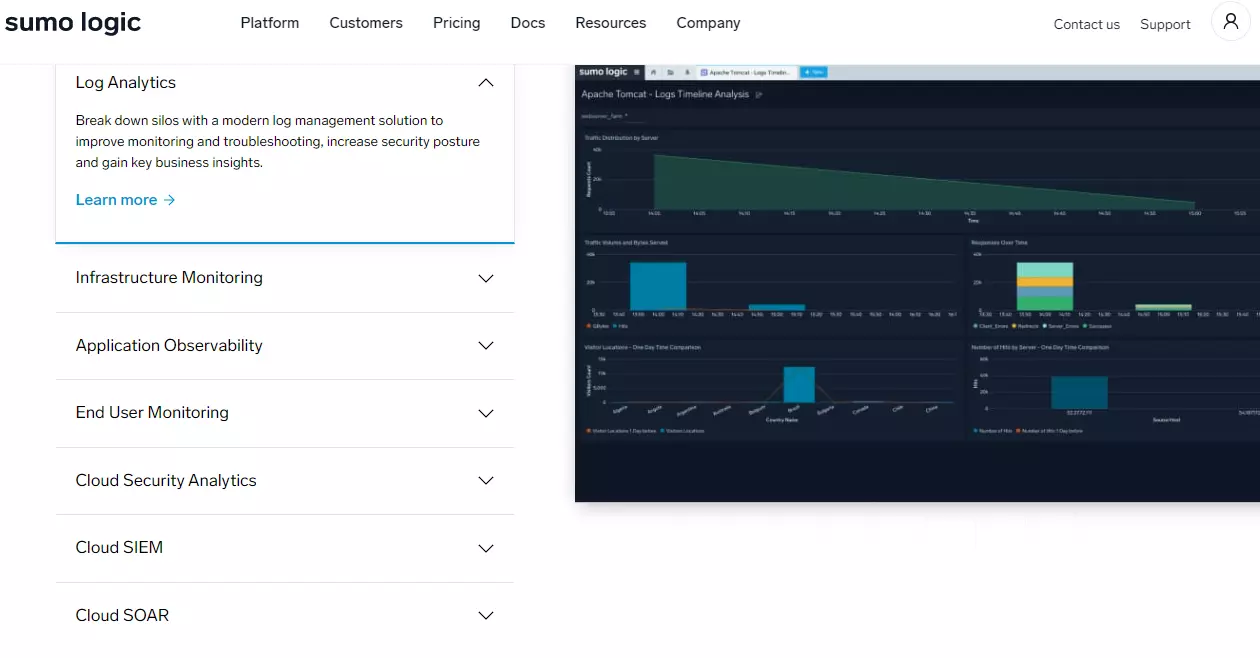
Sumo Logic specializes in comprehensive application monitoring for performance and security concerns. You can use it to collect data, track, and act on insights from workloads running across clouds, including in hybrid and multi-cloud setups.
And you can search, query, analyze, and share the data you ingest (it supports traces, too). The platform also packs built-in security capabilities and supports Privacy Shield, SOC 2 Type 2, PCI DSS 3.2, and is CSA Star and HIPAA certified for cloud security deployments.
Cloud Infrastructure Monitoring Tools
Nearly 70% of companies report cloud misconfiguration in their environments. The following cloud observability tools offer full-stack monitoring, enabling you to catch misconfigurations and track the health of all your cloud resources. Those resources include workflows, application metadata, workloads, security posture, networks, etc.
10. Dynatrace – End-to-end cloud infrastructure monitoring platform
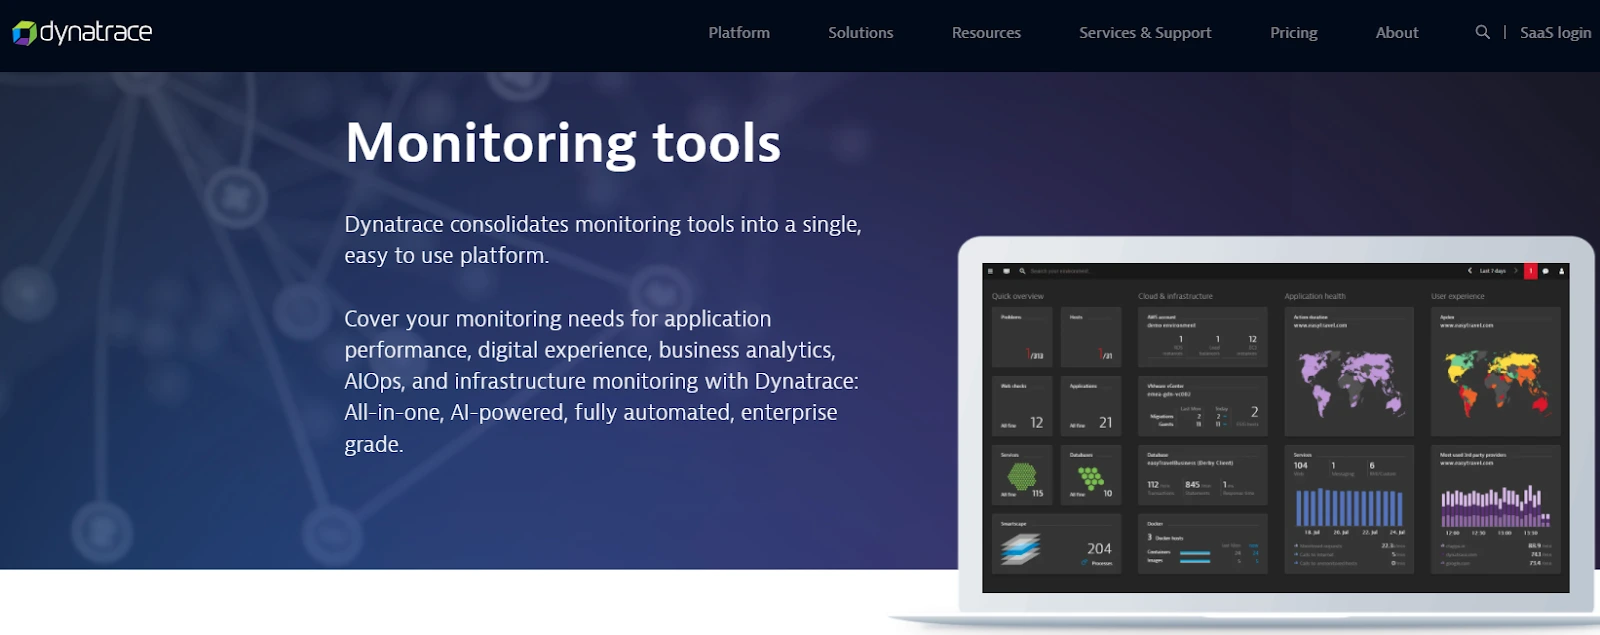
Dynatrace provides public, private, hybrid cloud, and serverless monitoring solutions. Dynatrace also provides back-end infrastructure monitoring, empowering you to see how your infrastructure’s health affects your service delivery. It delivers continuous auto-discovery of VMs, hosts, containers, Kubernetes, and cloud services.
Dynatrace leverages metrics, logs, traces, and events to correlate the data it collects to your business outcomes. The platform also works across multiple cloud providers and services, from AWS to OpenShift to Kubernetes.
11. Sematext – On-premise and cloud-native infrastructure monitoring solution
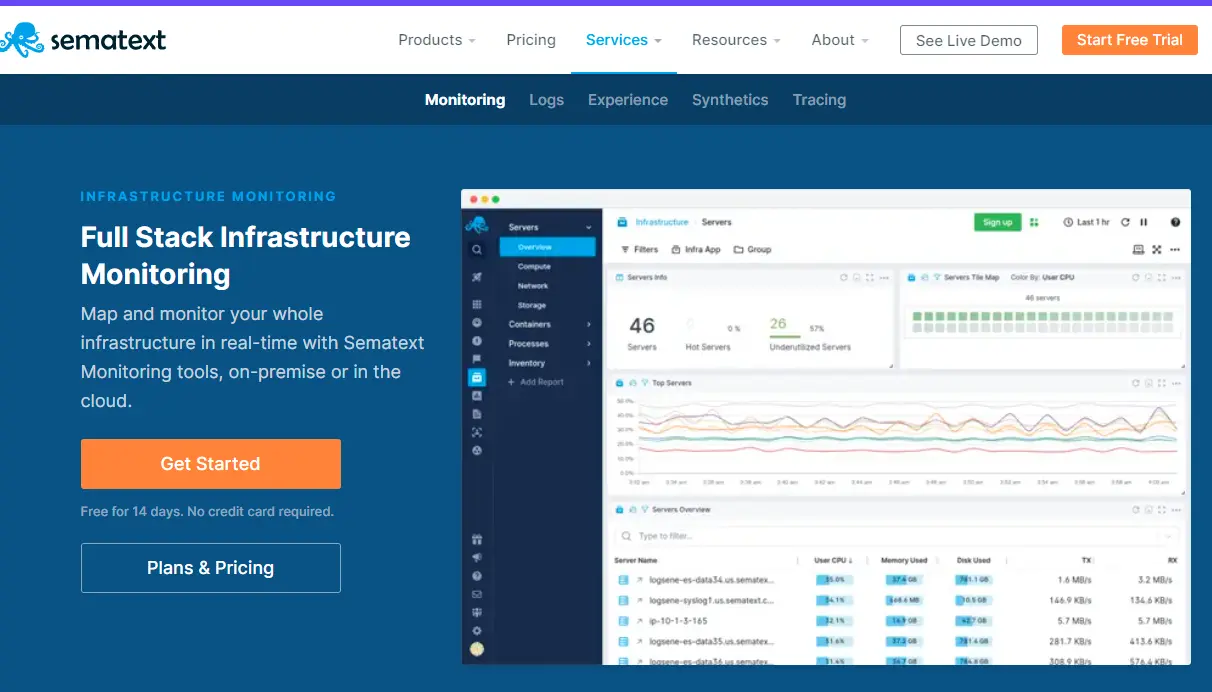
For organizations that run cloud-native and on-premises workloads on any public, private, or hybrid cloud, Sematext monitoring may be a great fit. Like Dynatrace, Sematext uses metrics, events, logs, and events data to assess your IT infrastructure health. Expect continuous, real-time monitoring at the code execution level.
The tool also notably supports over 100 integrations, so you can seamlessly integrate it with your technology stack. Sematext also provides real-time database, server, and container monitoring (using Sematext agent) to help you stay on top of potential issues.
12. Site24X7 – Infrastructure monitoring with robust website monitoring
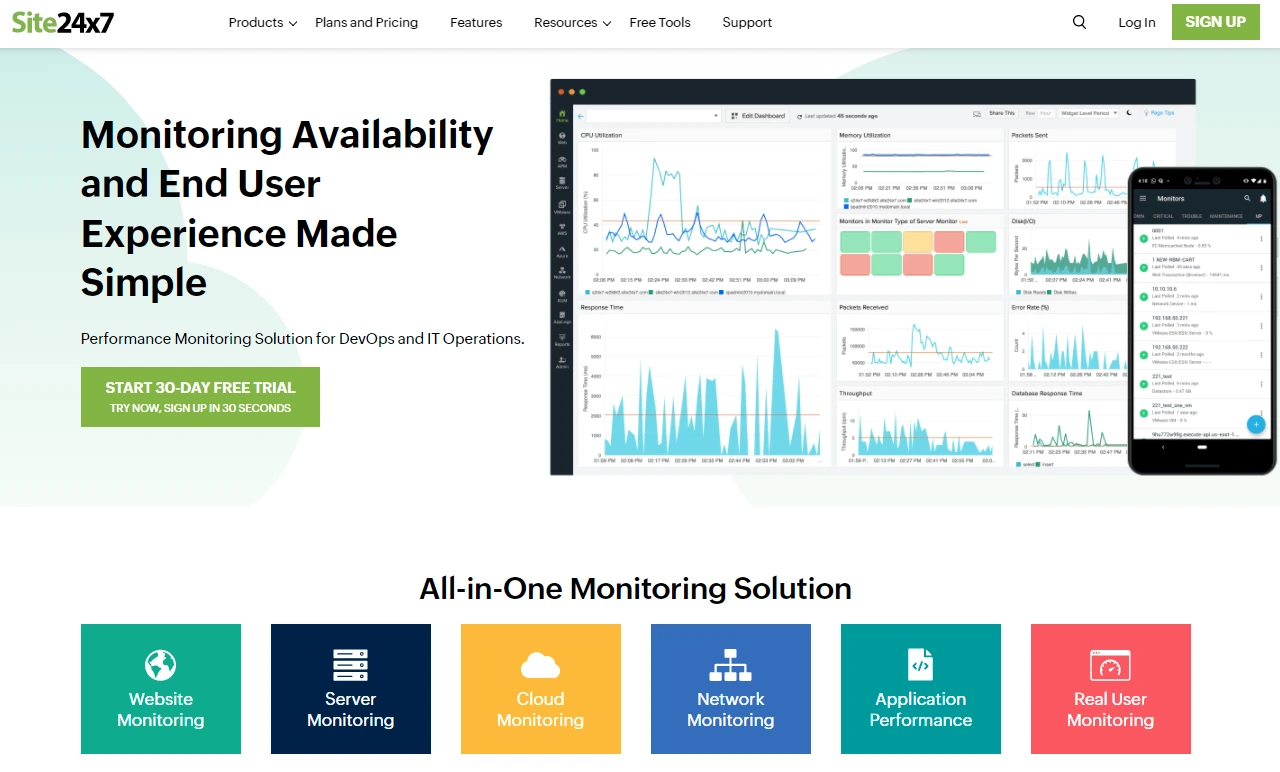
Site24X7 has its roots in website and internet services monitoring, supporting DNS server, HTTPS, FTP server, SMTP server, POP server, Rest APIs, and TSL/SSL certificate monitoring.
However, Site24X7 has evolved into a robust application performance monitoring service with web transactions (synthetics), real user, server, network, and resource utilization monitoring capabilities. Site24X7’s services are scalable, secure, and cover public (AWS, Azure, and GCP) and private clouds.
13. DX Infrastructure Manager – Unified hybrid cloud infrastructure management
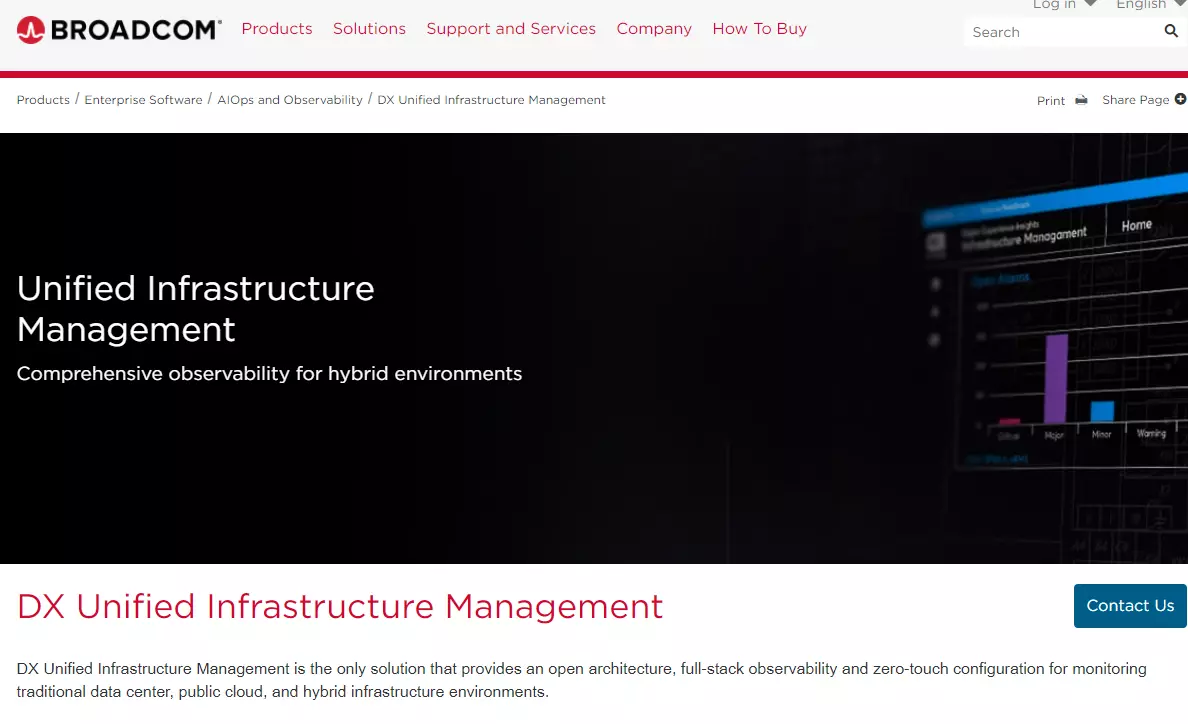
In a multi-cloud setup, you need a platform that enables easy monitoring and management from a single pane of glass. Broadcom’s DX Infrastructure Manager (formerly CA Infrastructure Monitoring) gives you control over on-premises, public cloud, private cloud, and hybrid cloud environments in a single location. This is possible because it offers an open architecture and zero-touch configuration with automated alarm and device policies. You can also track end-user experiences through its HTML5 console.
Cloud Server Monitoring
Server monitoring comprises tracking the health of your hosts, servers, and containers. Some tools also help monitor serverless functions across hybrid cloud environments. Whether you have cloud-based or physical servers, the following server monitoring services offer robust capabilities.
14. SolarWinds – Hybrid cloud server monitoring software
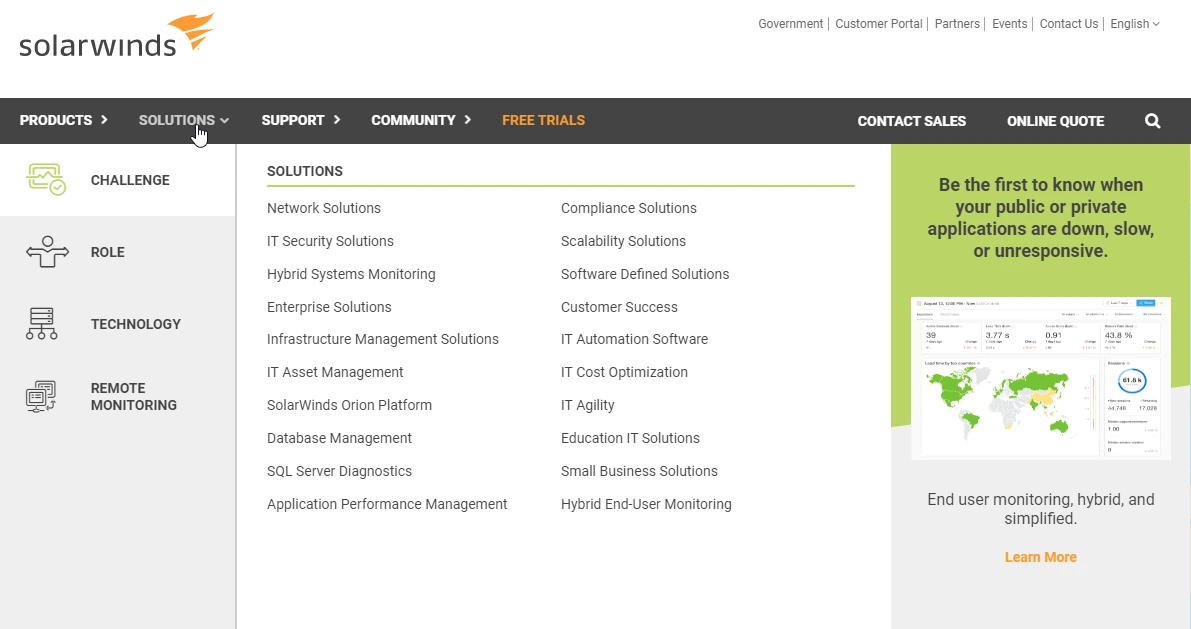
Consider SolarWinds for monitoring instances and VMs in AWS and Azure clouds. SolarWinds’ Orion Platform retrieves in-depth status, resource usage, and IP address insights across hybrid setups. The platform’s server diagnostics service combines with NetPath’s network monitoring capabilities to handle IPAM (AWS Route 53 records and Azure DNS Cloud Zones), NPM, SAM, and VMAN needs.
Like other all-in-one cloud monitoring services, SolarWinds monitors database usage, network performance, application performance, and infrastructure health.
15. DataDog – Cloud-based server monitoring service
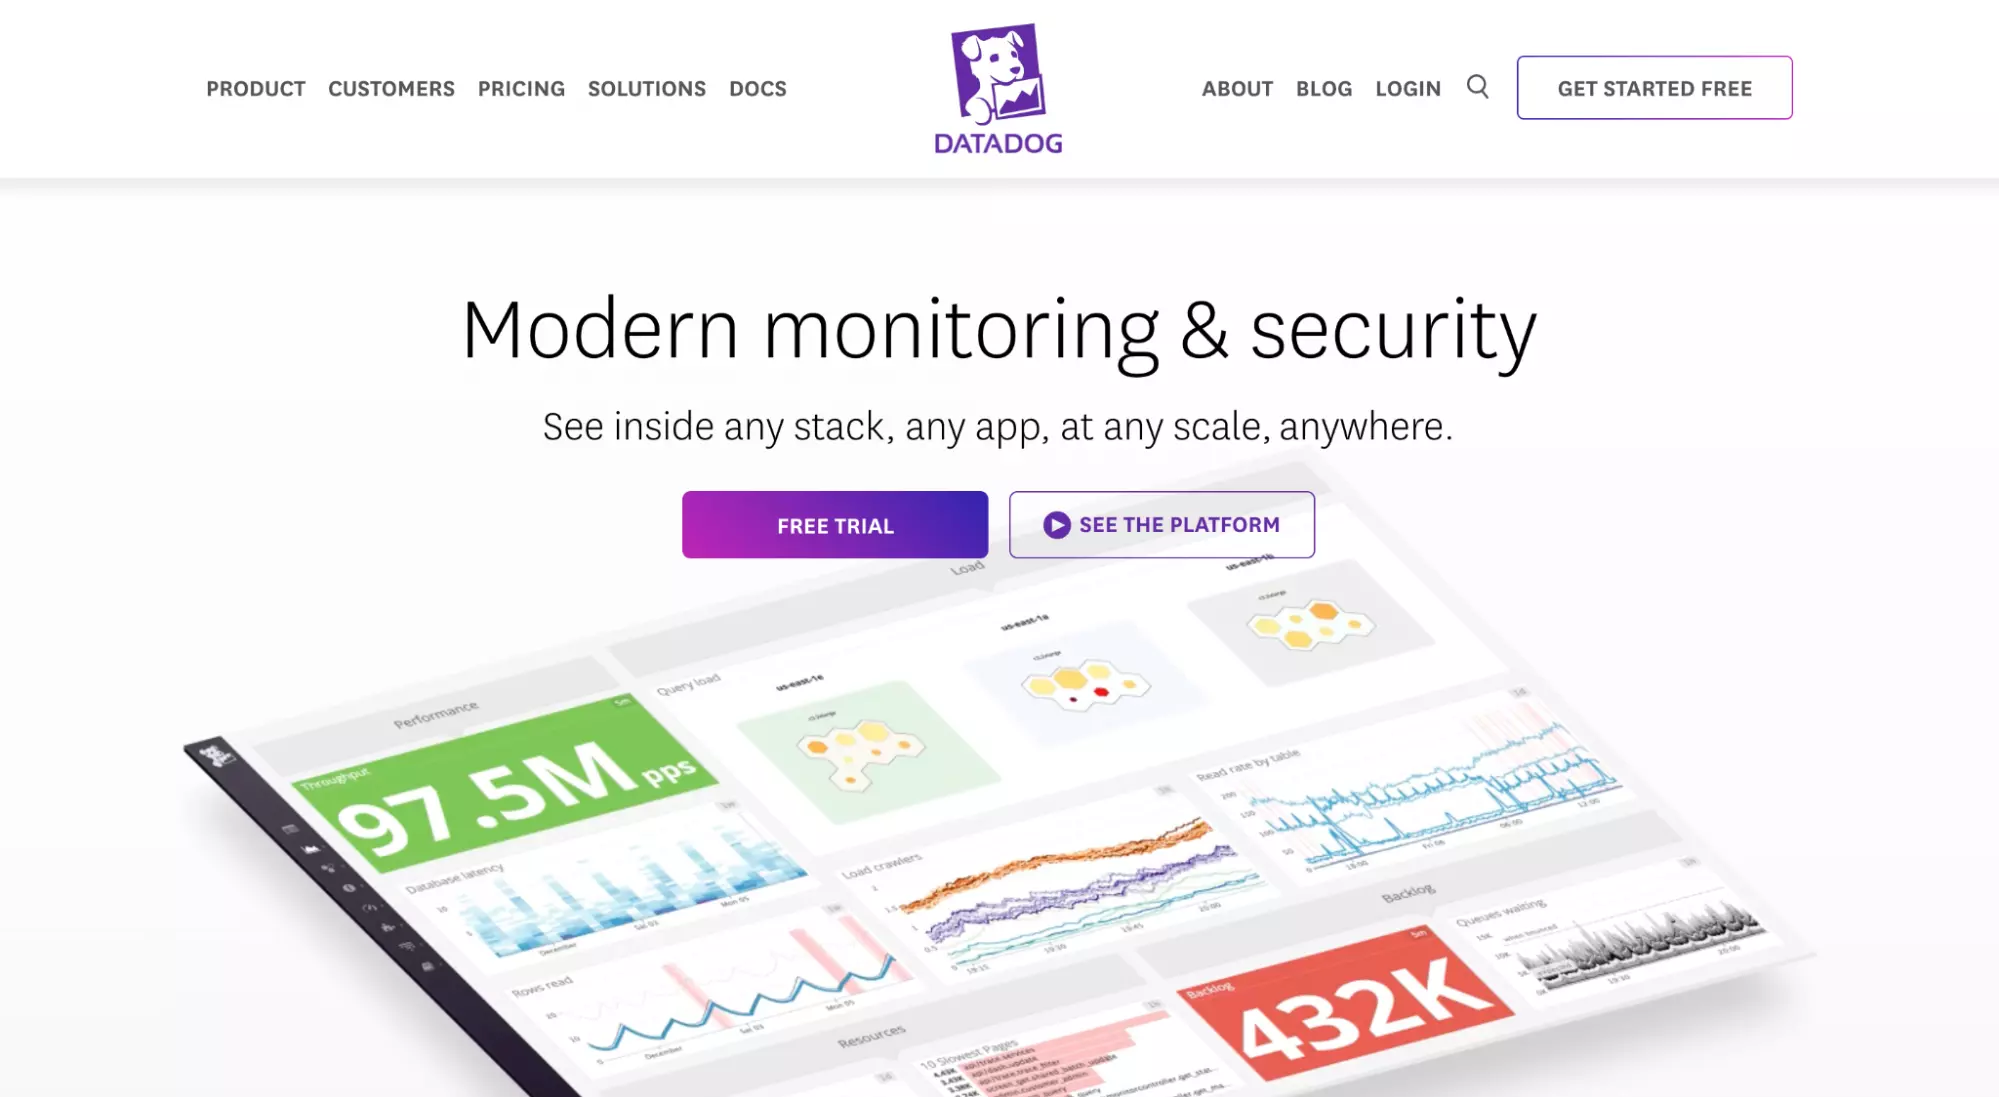
DataDog leverages over 500 data sources to turn metrics, logs, events, and traces into server health intelligence. The platform is perfect for companies that need to monitor and manage hosts and containers in real-time.
If you use tags, DataDog will help you use them to analyze server status by service, environment, instance type, and more. It also provides service maps to help you pinpoint server issues about other infrastructure components, helping you identify a problem, its potential effects, and how to fix it.
Database Monitoring Solutions
A top database monitoring tool automates database deployments and provides seamless database version control across technologies and teams. To protect business-critical data, you can also use its real-time diagnostics and alerts to measure databases’ availability, SQL query performance, resource consumption, replication latency, and compliance. Some top options here include:
16.ManageEngine – SQL and NoSQL database monitoring
ManageEngine’s Applications Manager has been around for decades, providing a range of solutions, including security and compliance management.
For databases specifically, Applications Manager helps you automatically discover, group, and monitor code-level insights for in-memory, NoSQL, RDBMS, and big data storage in real-time. You can also use the platform to monitor and manage a raft of database services, from Oracle and Cassandra to MySQL, Redis, and MongoDB.
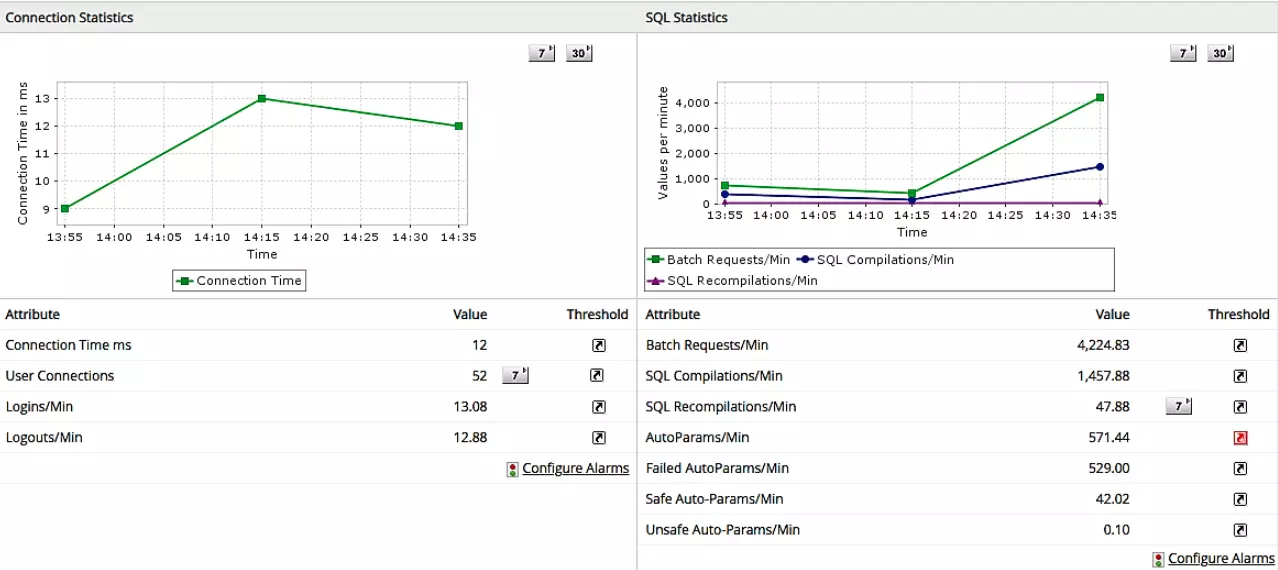
17. Redgate – Compliant database for DevOps teams
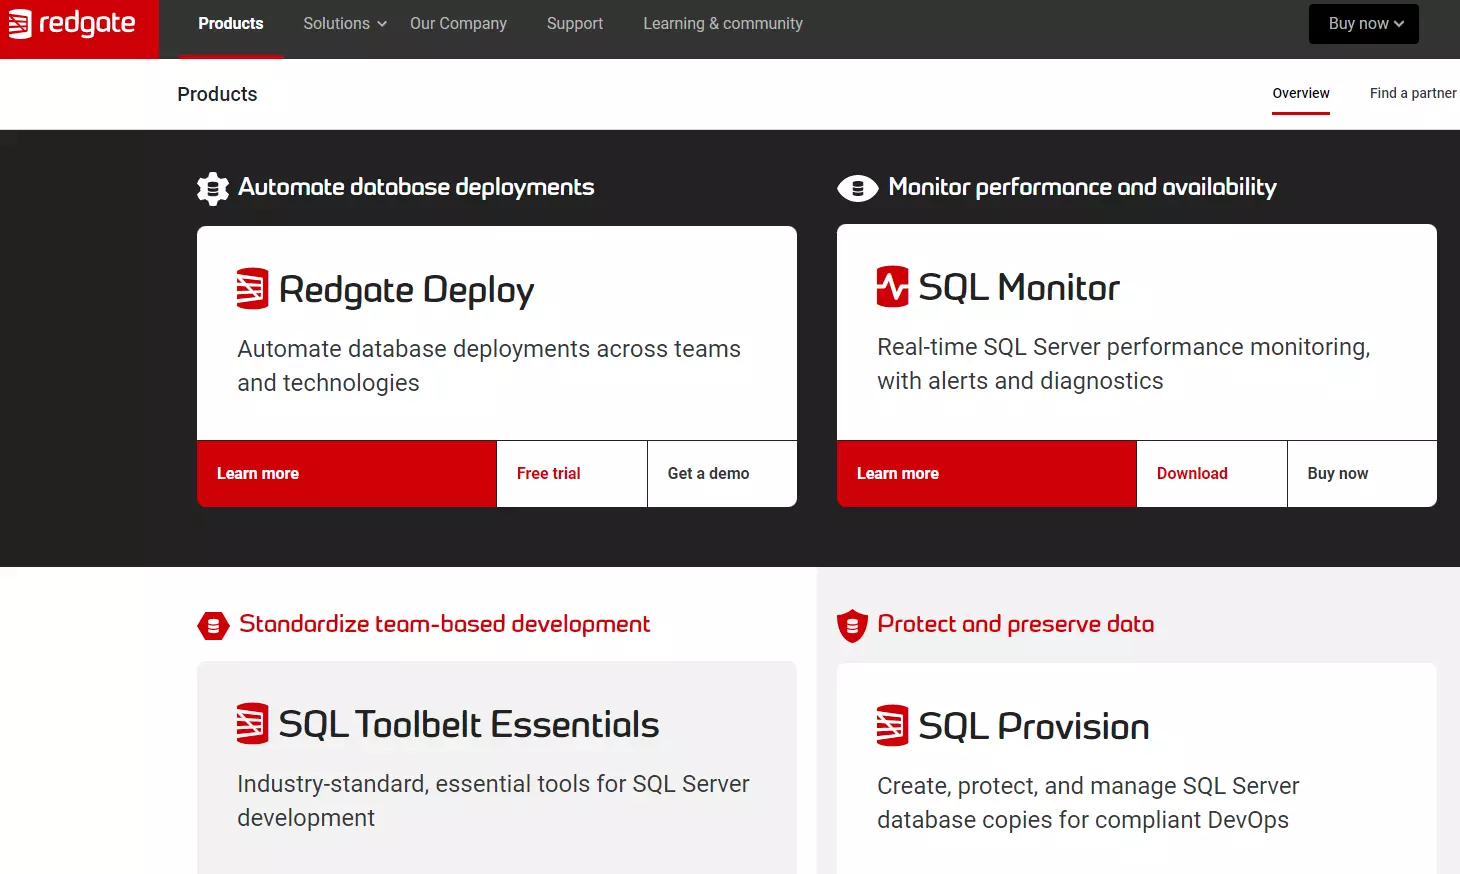
Redgate is an excellent choice for database administrators who do not require a multifaceted tool, but are looking for database-specific performance, availability, and security monitoring in one platform. Support for .NET, Azure, and SQL Server environments are some compelling reasons to use Redgate.
In addition, you can deploy Redgate on-premises or in the cloud. Redgate also runs realistic database tests, continuously monitors databases, and safeguards sensitive data in real-time.
More database monitoring platforms include dbWatch Database, SolarWinds Database Performance Analyzer for SQL Server, Spiceworks, SQL Power Tools, DataDog Database monitoring, Nagios Database monitor, SentryOne SQL, OpsView, and Site24X7 Server Monitoring.
Network Monitoring Services
These tools help administrators keep track of network service health across physical, virtual, and software-defined infrastructure.
This makes it possible to monitor everything from routers and switches to VPNs and firewalls. While some monitors use agents, others don’t. Other approaches automate data collection through SNMP, SSH, Syslog, API, etc. Here are some top network monitoring solutions for modern, multi-cloud networks.
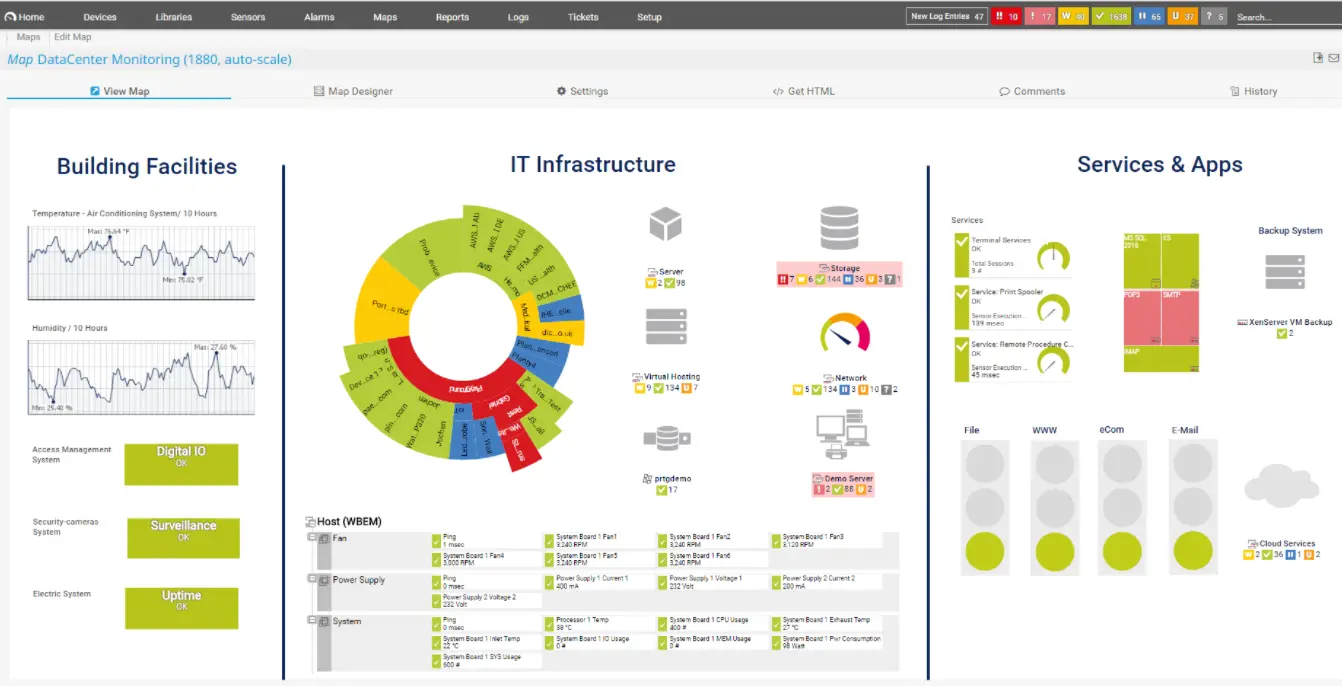
18. Nagios XI Network Analyzer – Scalable network monitoring
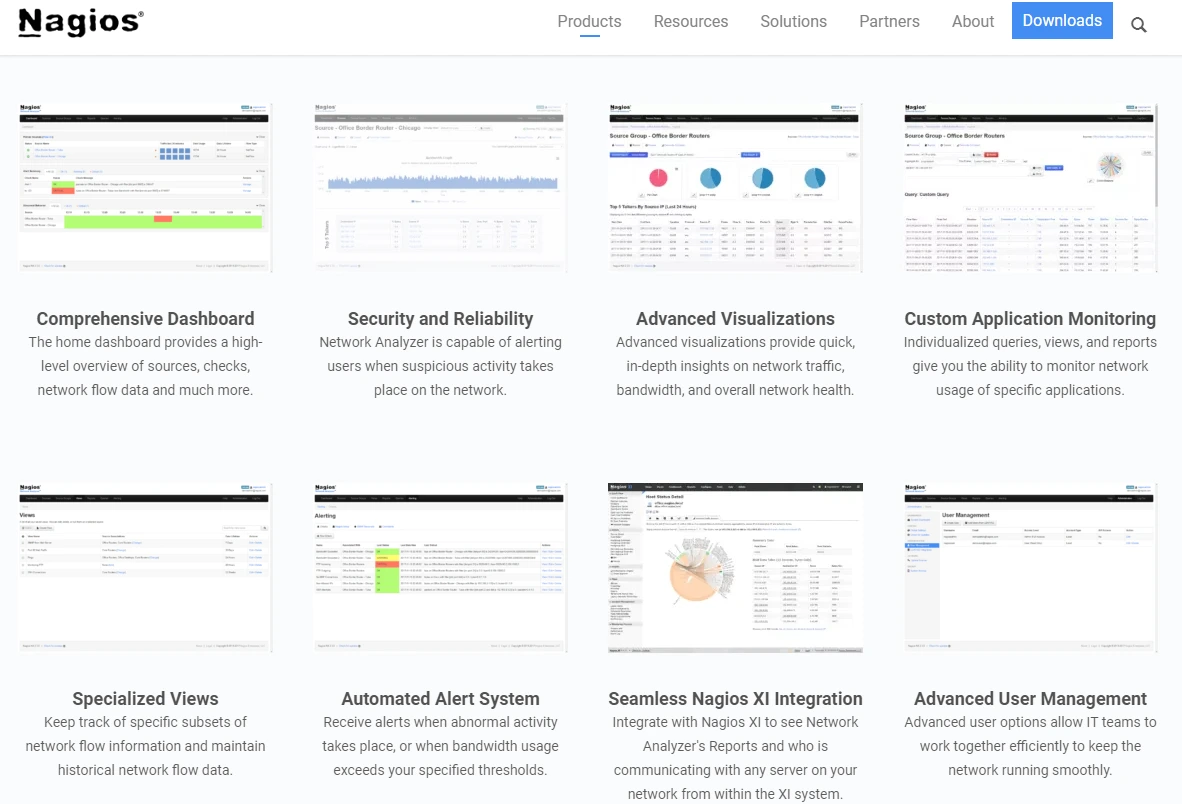
Nagios monitors Linux-based services, switches, apps, and servers. The service works seamlessly with Nagios Core 6, Nagios’s open-source monitoring platform that supports thousands of community plugins.
By helping you analyze network traffic across your entire infrastructure, you can detect problematic traffic sources, potential threats, and other insights about your network’s health in a central place. You can also analyze bandwidth usage based on various combinations, such as IP or source.
19. Paessler PRTG Network Monitoring – All-in-one network monitoring tool
Paessler’s PRTG is a network monitoring platform with a selection of integrated technologies. PRTG provides ready-to-use SNMP with custom options, WMI (Windows), SNM (macOS and Linux/Unix), and packet sniffing or flow protocols for traffic analysis.
More techniques you can use include HTTP requests, Ping, SQL, Rest APIs (returning JSON or XML), etc. PRTG also provides over 300 map objects to help create a stunning dashboard with real-time status information.
Other best network monitoring solutions include SolarWinds Network Performance Monitor, LogicMonitor, Auvik, DataDog Network Monitoring, Atera, and Domotz network monitoring.
Cloud Security Monitoring Solutions
An unchecked security breach could cause irreparable damage across vast areas of your modern cloud infrastructure. Unfortunately, you never know where or when a breach could occur. If it does happen, the average cost of a data breach now exceeds $4.8 million, according to IBM. To protect your cloud, you’ll need a security platform that offers continuous monitoring.
The best solutions include compliance management, real-time tracking, and incident reporting capabilities. These full-stack platforms are worth considering.
20. Wiz – Contextual Vulnerability Management
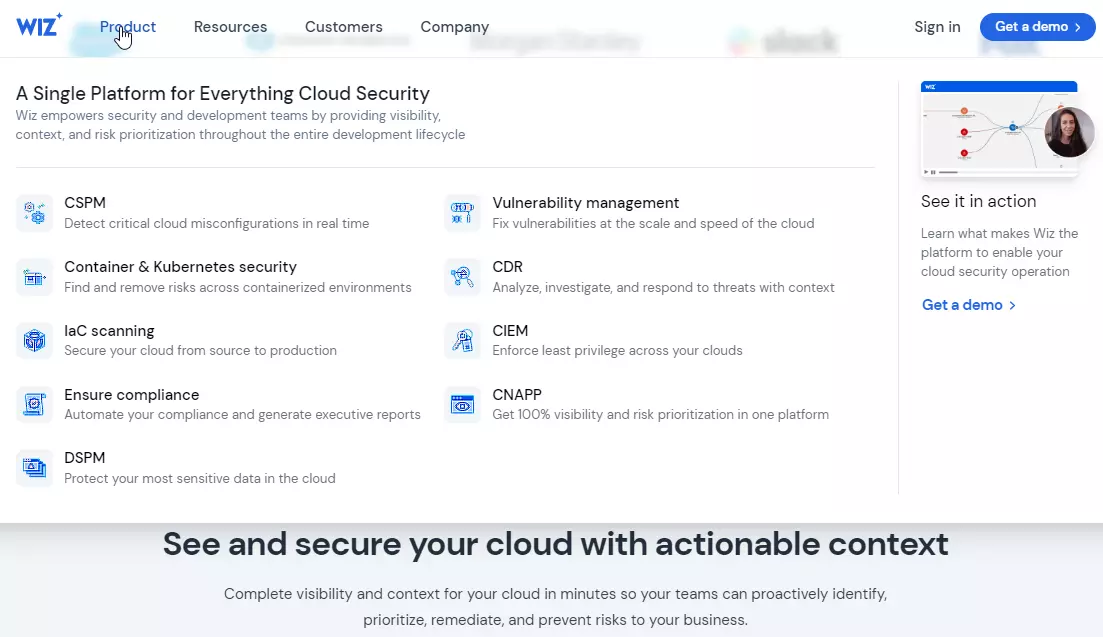
Wiz connects via API to all major cloud providers, including VMware vSphere and Red Hat OpenShift. The tool also scans virtual machines, serverless functions, containers, and data stores, such as databases, public buckets, and data volumes.
An agentless cloud security platform, Wiz continuously analyzes misconfigurations, secrets, identities, vulnerabilities, network exposure, malware, and sensitive data.
With the Wiz Security Graph, you get contextual insights that continually reveal toxic combinations of attack paths in your cloud and real risk. This is so you can actively minimize your attack surface.
21. Orca Security – Cloud security and data protection solution
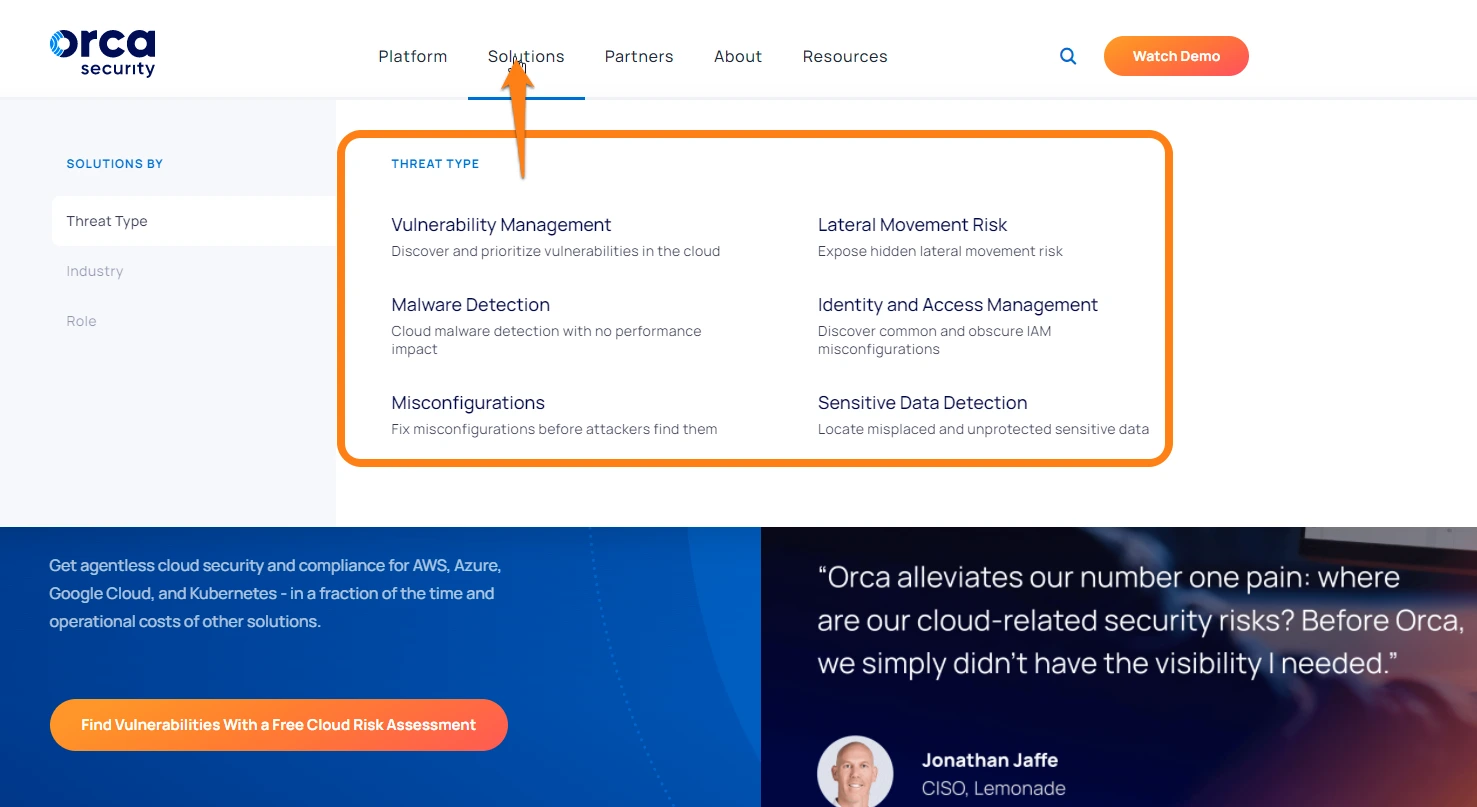
Orca Security is an agentless cloud security and compliance tool you can deploy for your AWS, GCP, Azure, or Kubernetes services. Orca’s SideScanning technology retrieves data directly from your workload’s runtime block storage (out of band) and cloud configuration. The security service also works across clouds, so you can use it in your hybrid cloud strategy.
In addition, it monitors, analyzes, and reports any misconfiguration and suspicious activity resulting from vulnerabilities or malware. Context-aware alerting also ensures you only receive alerts about critical security or compliance issues — not irrelevant noise.
22. LaceWork – All-in-one cloud security platform for companies of all sizes
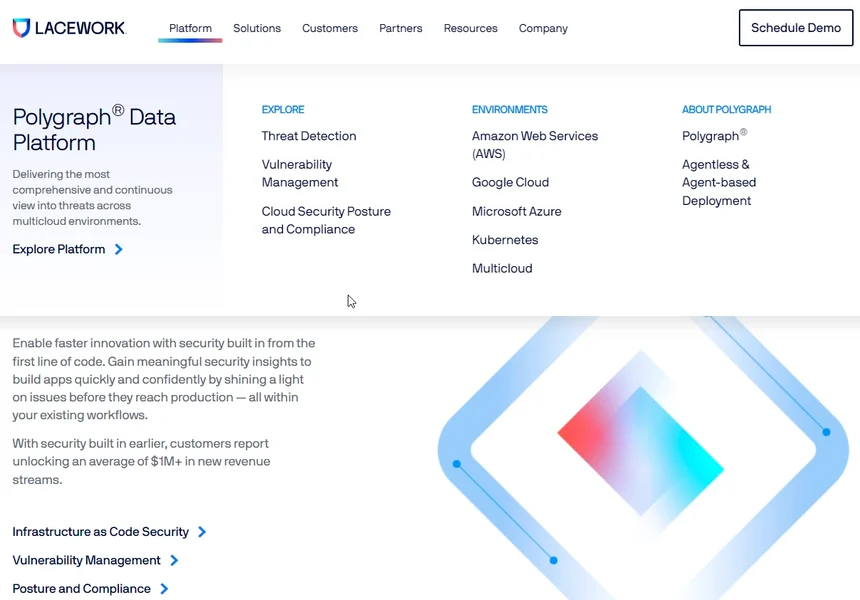
The Lacework platform uses AI and automation to provide continuous cloud security for medium- and large-scale organizations. Lacework correlates security threats across multiple environments, like AWS, GCP, and Azure. You can then identify the problem with context, enabling you to prioritize solving critical vulnerabilities or misconfigurations.
Lacework works at the Infrastructure level (IaC), providing vulnerability, security posture, and compliance management for all apps, workloads, containers, processes, machines, accounts, and users an environment.
23. Fugue – IAM security and cloud compliance tool
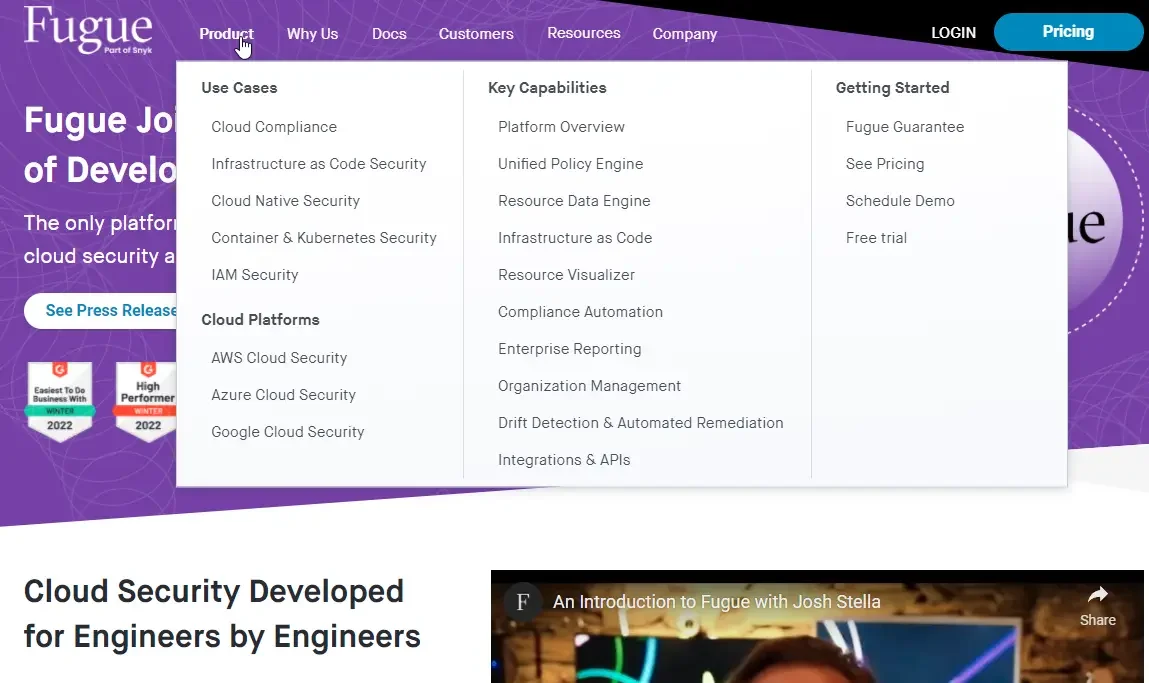
With Snyk’s Fugue, you get a Unified Policy Engine for handling cloud compliance and security before and after deployments. A single policy engine enables you to manage all rules throughout your software development lifecycle in one place.
The Fugue suite features cloud-native, IAM, and Infrastructure-as-Code security. Its compliance management capabilities transcend cloud resources and teams. Fugue provides Fugue Best Practices, CIS Foundations Benchmark (AWS, Azure, and GCP), SOC 2, GDPR, ISO 27001, HIPAA, NIST 800-53, and PCI compliance families.
24. Threat Stack – File integrity monitoring for DevSecOps
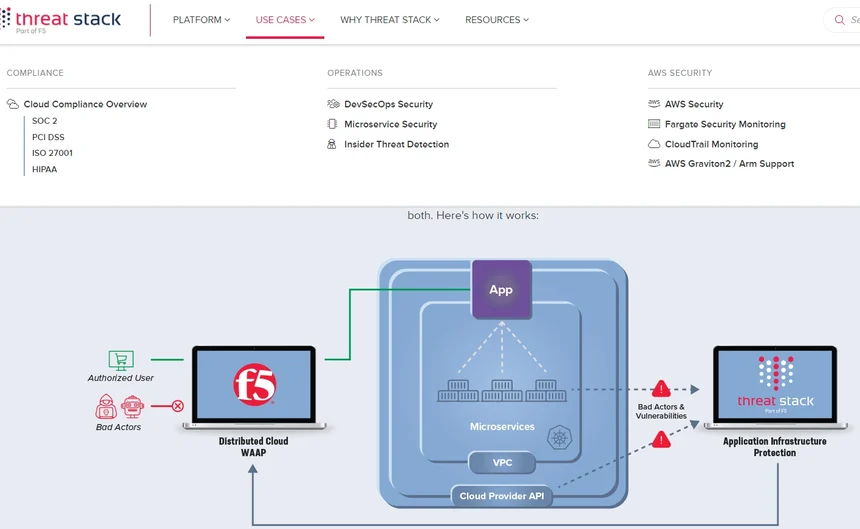
The Threat Stack Security Operations Center enables end-to-end security oversight from a single platform. The tool uses machine learning and continuous monitoring techniques to surface anomalous behavior in infrastructure and application stacks.
Teams like its easy-to-use yet powerful host detection capabilities. Expect support for file integrity monitoring, Kubernetes, and container security. Threat Stack offers SOC 2, HIPAA, PCI DSS, and ISO 27001 compliance for compliance needs.
Website Monitoring Tools
A website comprises a collection of local files. It then sends those files over the internet to other networks. Monitoring tools provide insight into files, traffic, availability, etc., for cloud-hosted sites. Overall, website monitoring helps analyze user experiences to inform optimization efforts. Below are a few of the best tools you can use.
25. Sematext Synthetics – End-to-end uptime, performance, and API monitoring
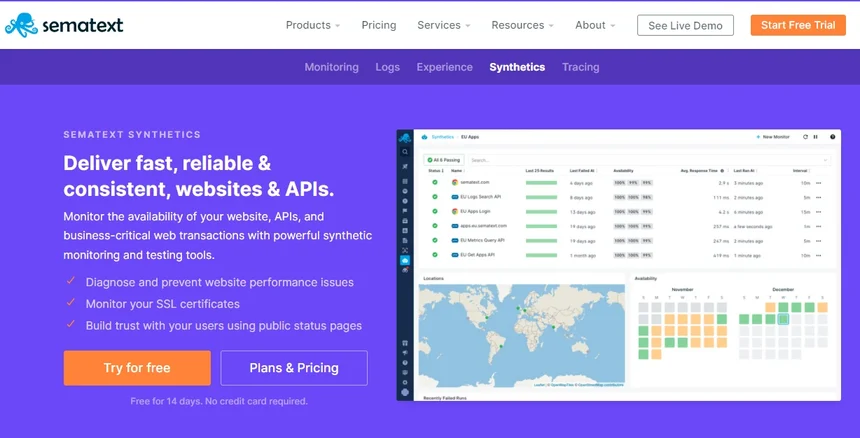
With Sematext Synthetics, you can monitor and test your website availability, web transactions, and APIs. You can also monitor traffic, uptime, user activity, and more insights from multiple locations, behind firewalls, and within private networks.
You’ll receive alerts via webhooks, Slack, email, etc. For real user monitoring and SEO, Sematext empowers you to track Web Core Vitals, SSL Certificate, page load performance, SLAs, third-party performance, etc.
26. Uptime – Website performance and real user monitoring
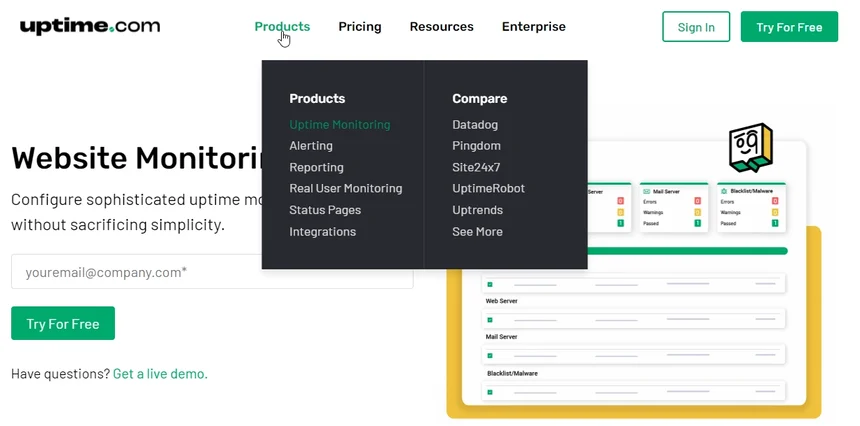
Uptime offers robust website availability, performance, speed, errors, and bounce rate monitoring. It also provides real user monitoring, which uncovers pathway and other user experience issues, alerting development teams to improve the front-end. Besides, you can test your website forms and flows and monitor public and private sites from private and external locations.
27. Calibreapp – Website page speed monitoring for teams
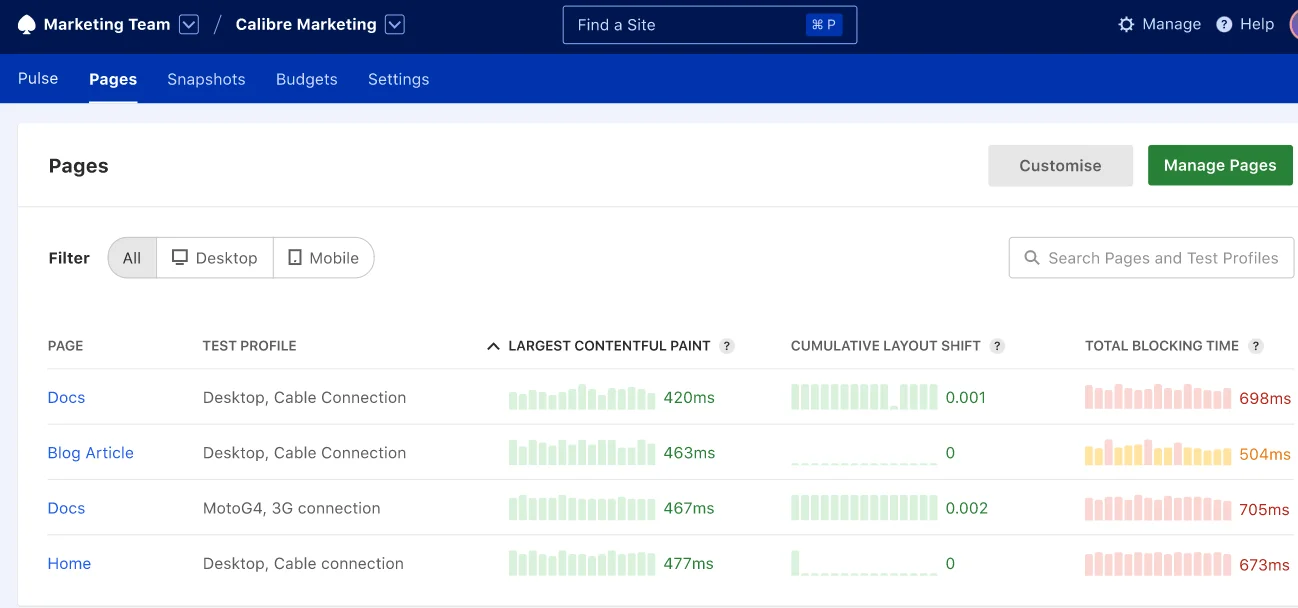
Calibre is ideal for website performance administrators who want a simple yet powerful platform to test, alert, and analyze their websites’ page speed. The tool lets you do that from 17 locations globally and can test password-protected sites and public ones. Also included are 40 different metrics you can use however you like, including Core Web Vitals.
Other website monitoring solutions include Uptrends, Calibreapp, Alertra, StatusCake, Uptime Robot, Dotcom-Monitor, DataDog Synthetics Monitoring, Site24X7, SolarWinds Synthetics Monitoring, etc.
Open-Source Cloud Monitoring Tools
There are many open-source cloud monitoring tools for specific services, like Cacti and Icinga for network monitoring. But few open-source tools provide comprehensive monitoring hassle-free.
The following tools offer that level of service, although full support comes at a fee. Here are suitable options if you have the skills and experience to collect custom metrics and build and maintain tailored solutions.
28. Grafana Cloud – Custom operational dashboards
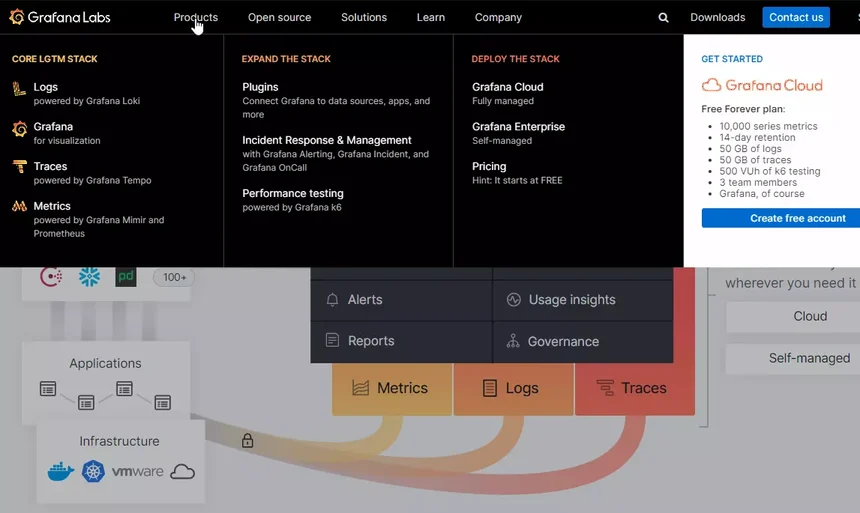
Grafana is one of the most popular open-source data visualization and monitoring stack for cloud and self-managed infrastructure. With Grafana, you get a powerful free plan you can use to collect insightful data into your cloud.
You can also use it to monitor your Kubernetes environment and performance testing projects. Ultimately, Grafana enables you to monitor any stack at any scale.
The Grafana system monitoring dashboard, for example, displays OS level telemetry and traces; all Linux and Windows stats, including Memory Usage, CPU Load, IOSTAT, NETWORK Stat, Disk Usage, etc.
29. Elastic/ELK – The Cloud Monitoring Stack
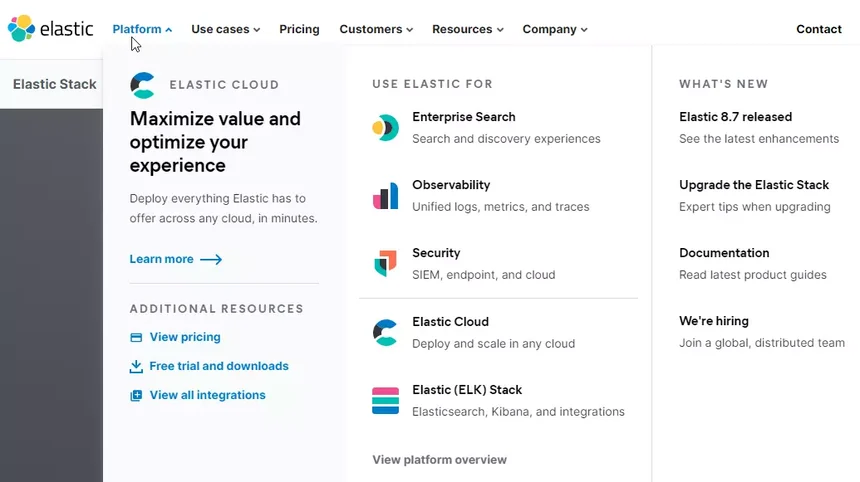
The ELK acronym stands for Elasticsearch, Logstash, and Kibana. The platform recently added another tool; Beats. Elasticsearch is the REST-ful, JSON-based, and distributed search and analytics engine. Logstash is the data processing pipeline on the serverside.
It ingests data from multiple sources concurrently, transforms it, and eventually delivers it to a “stash” (such as Elasticsearch). With Kibana, you can visualize your monitoring data with graphs and charts in Elasticsearch. Beats completes the equation as a lightweight data shipper (it’s single-purpose).
30. Chronosphere – Cost-conscious cloud monitoring platform
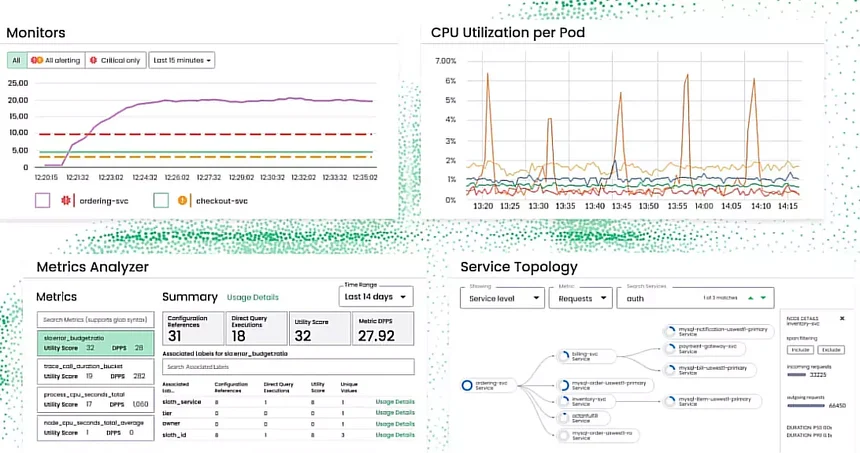
Chronosphere boasts a cloud-native observability platform that proactively tames rapid data growth. By reducing your cloud monitoring data by 50%, you will save money on storage and transfer fees, as well as time analyzing it.
The goal is to help engineers get priority views of the data they actually need to speed up Mean Time To Detection (MTTD) and remediation. The platform also supports distributed tracing, query acceleration, and its Chronosphere Collector is open-source compatible.
31. Zabbix – Feature-rich open-source cloud monitoring platform
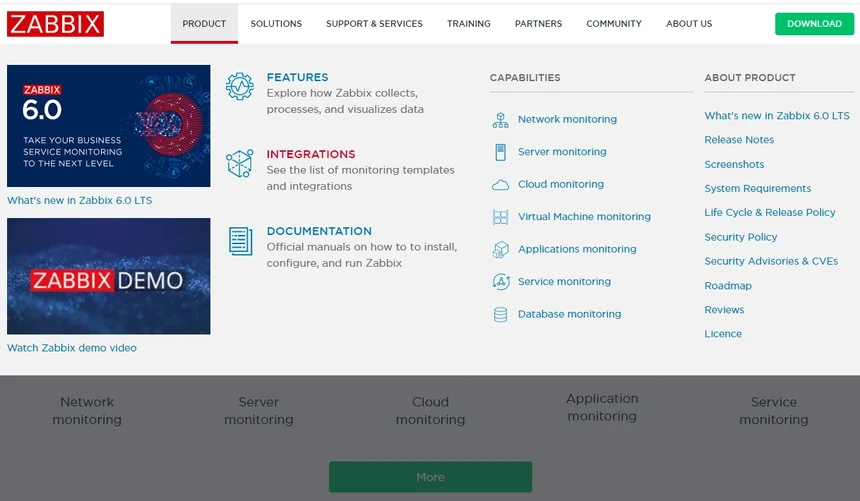
Zabbix provides multiple capabilities, ranging from infrastructure, applications, and service monitoring to server, virtual machine, and database health tracking. It is an enterprise-class platform, but you can also use Zabbix’s real-time tracking, multi-tenant, and SNMP capabilities for small and medium organizations.
Besides, Zabbix offers a vibrant community and free resources and subscriptions for advanced training. Google Cloud and real-time monitoring are not available, although Zabbix integrates with many tools for that. Zabbix also works on-premises and in the cloud.
32. Nagios Core 6 – Free, open-source monitoring engine

Nagios is most famous for its Network Analyzer tool. But it also offers valuable monitoring capabilities for small and large companies, including over 50 plugins, frontends, and add-ons.
Nagios’s Core 6 monitoring engine keeps tabs on most infrastructure components, such as web servers (Linux and Windows), applications (Windows, web, UNIX, and Linux), websites, networks, services, etc. If you need full support, consider the paid version, Nagios XI, which offers alerting, graphing, and reporting.
33. Sensu – Free and open-source monitoring for business KPIs
Developed in Ruby, Sensu offers adequate infrastructure, application, server, network, virtual machines, Kubernetes, and services monitoring. Sensu requires Redis or RabbitMQ for installation and infrastructure component communications via Transport. You can also seamlessly integrate it with your favorite alerting and messaging tools, from Slack and PagerDuty to IRC and HipChat.
Other open-source cloud monitoring tools include OpenNMS, Checkmk, Zenoss, and Prometheus + Grafana (data visualization).
Container Monitoring Tools
Containerized applications and microservices are highly extensible, allow distributed operations, and are highly resilient. But managing them can be challenging. The following container monitoring tools can help you continuously monitor microservices, Kubernetes, and containerized environments for optimal performance.
34. Kubernetes (native tools) – Production-grade container orchestration platform
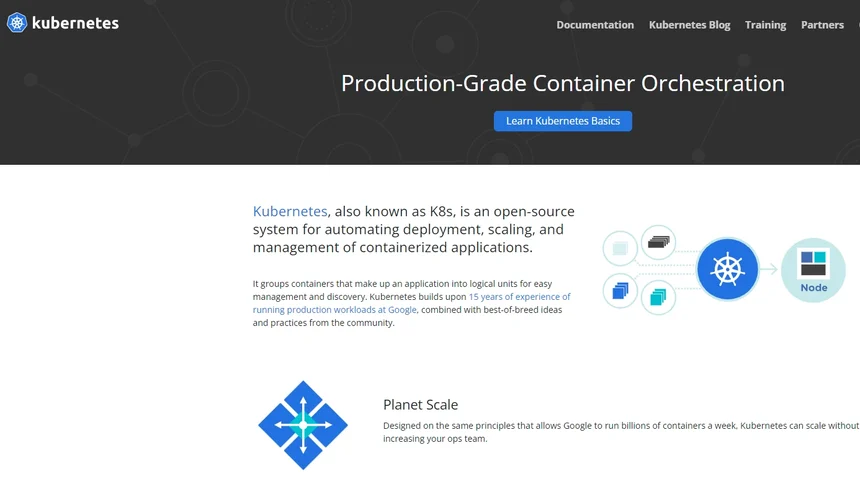
Kubernetes is an open-source container orchestration platform for deploying and managing containerized applications. Kubernetes is popular for its web interface, extensible nature, and self-healing capabilities. These traits help orchestrate containerized apps and microservices at a lean and massive scale without too much hassle.
Kubernetes has a few native tools for monitoring resources, including its resources metrics pipeline and full metrics pipeline.
Also known for its thriving developer community, Kubernetes enables developers to build on other engineers’ expertise. Also, with an advanced cloud cost intelligence platform like CloudZero, you can accurately collect, analyze, map, and optimize your Kubernetes costs.
35. CloudZero – Kubernetes cost intelligence
Cloud monitoring tools rarely provide granular, actionable cost insight. Not CloudZero. To prevent cost blindspots, CloudZero’s Kubernetes Cost Analysis approach collects cost data across your applications and infrastructure.
Have messy tags? No problem. CloudZero accurately reports the costs of your tagged, untagged, untaggable, and shared resources. It then breaks down the cost data into contextual metrics paired with common Kubernetes concepts, such as cost per service, deployment, and namespace label.
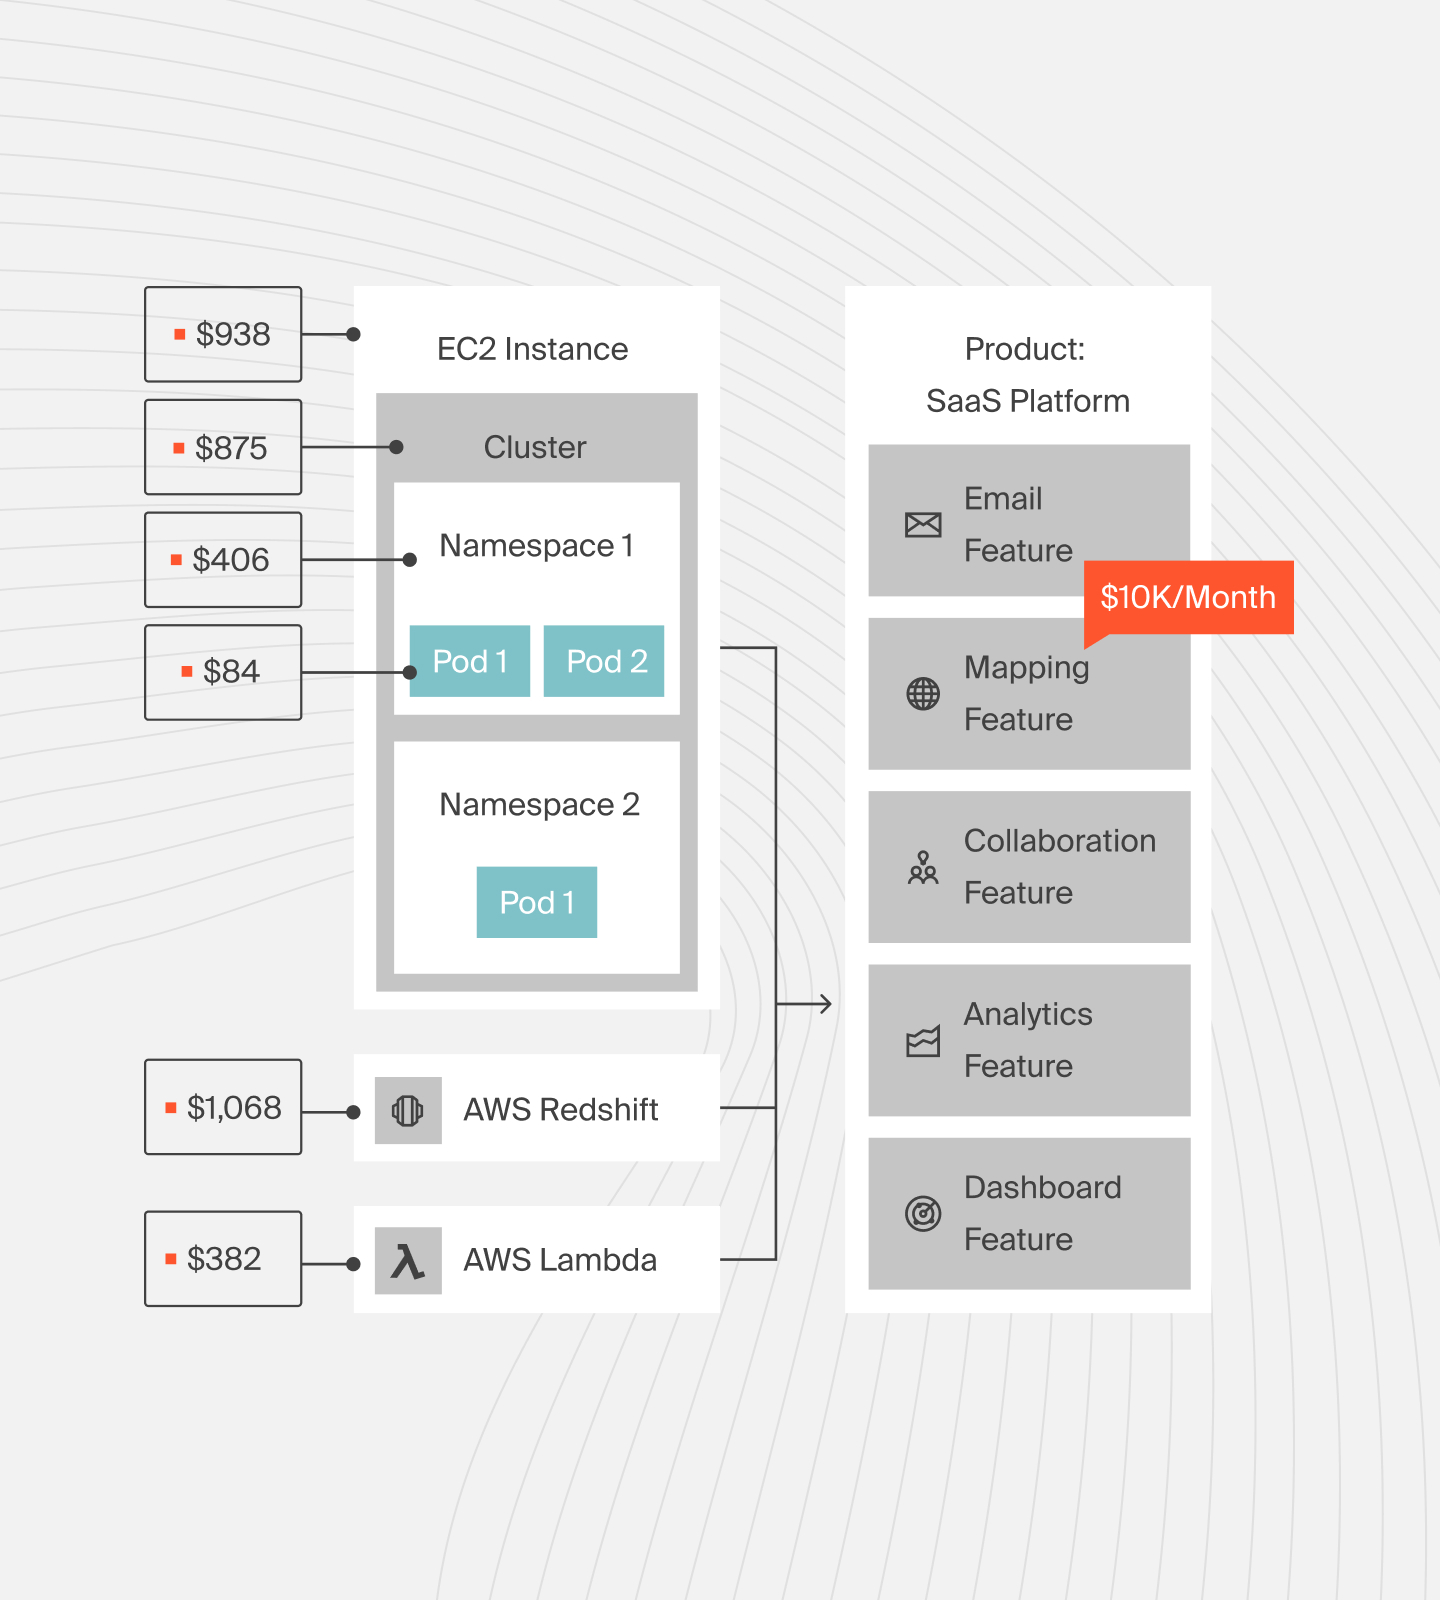
You can view your K8s costs across multiple clusters in a single pane of glass to ease analysis.
Better yet, you can combine, compare, and benchmark your K8s cost together with or against your AWS, Azure, and GCP costs — as well as platform costs from services like Snowflake, Datadog, and MongoDB. Ultimately, you get to view your costs per customer, team, feature, product, project, and even more dimensions to minimize overwhelm and promote better decision-making.
36. Densify – Container resource optimization
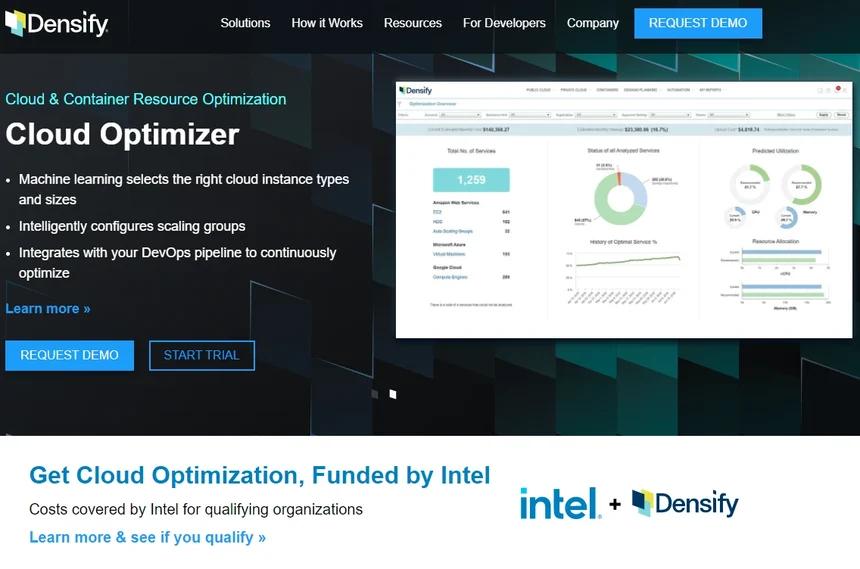
Densify’s Container Optimizer tool automatically sets container limits and requests. It also configures scaling groups to help you continuously optimize your Kubernetes environment. Densify also enables you to scale Kubernetes or containerized apps according to your needs by configuring the nodes with optimized resources as you scale operations.
For those tired of juggling multiple tools, Densify also integrates with numerous other tools to report your container stack’s health insights in one place. Those integrations include Slack, ServiceNow, Tableau, Docker, and Ansible.
Do you use Kubernetes or Docker to orchestrate your containerized apps or microservices? See these top 15 container monitoring tools for Docker and Kubernetes here.
Transform AWS Usage And Cost Metrics Into Actionable Business Insights You Care About
With CloudZero, you can:
- View your most and least expensive customers. Then determine how much to price your services to protect your gross margin.
- Study how customers use a specific product feature to tell which features to include in your highest pricing plan, which ones to repurpose, and which ones to scrap entirely if not needed.
- Learn how changes in your AWS environment might affect your AWS bill. For example, tie costs to events, such as deployments, so you can see the impact engineering activities have on profitability.
- Skip endless tagging to collect accurate AWS cost and usage information. CloudZero gives you a detailed view of the costs related to untagged, untaggable, and shared resources in multi-tenant environments.
- Automatically detect cost spikes and usage anomalies in your environment. Then, notify the right people or team via Slack to avoid going over budget.
- Put costs into context. You can see the people, features, and processes responsible for your costs, right down to individual customers, teams, product features, projects, environments, etc.
- Monitor AWS, Snowflake, and Kubernetes costs in one platform.
Seen enough?
It is time CloudZero helped you transform your AWS cost metrics into meaningful business insights.  now to see CloudZero in action.


