Since the first software-as-a-service (SaaS) company entered the market in 1999, Salesforce, the industry has exploded. The global SaaS market reached approximately $408 billion in 2025 and is projected to surpass $465 billion in 2026, with AI-powered features and usage-based pricing accelerating adoption across industries.
In order to play in this highly competitive space, SaaS companies need to have a deep understanding of their financial key performance indicators (KPIs)—the quantitative metrics that measure a company’s financial health, profitability, and operational efficiency over time.
Traditional financial KPIs simply do not provide the insights that growing SaaS companies need — as they were originally created for companies that sell one-off products and do not work well with recurring business models. SaaS financial metrics like monthly recurring revenue, cost per customer, and gross revenue retention give teams a more accurate picture of performance than legacy measures alone.
Fortunately, along with this growing industry, we have seen a growth in KPIs that are better suited to the SaaS business model. Here, we explore 21 financial KPIs that SaaS companies should be monitoring for financial and organizational success.
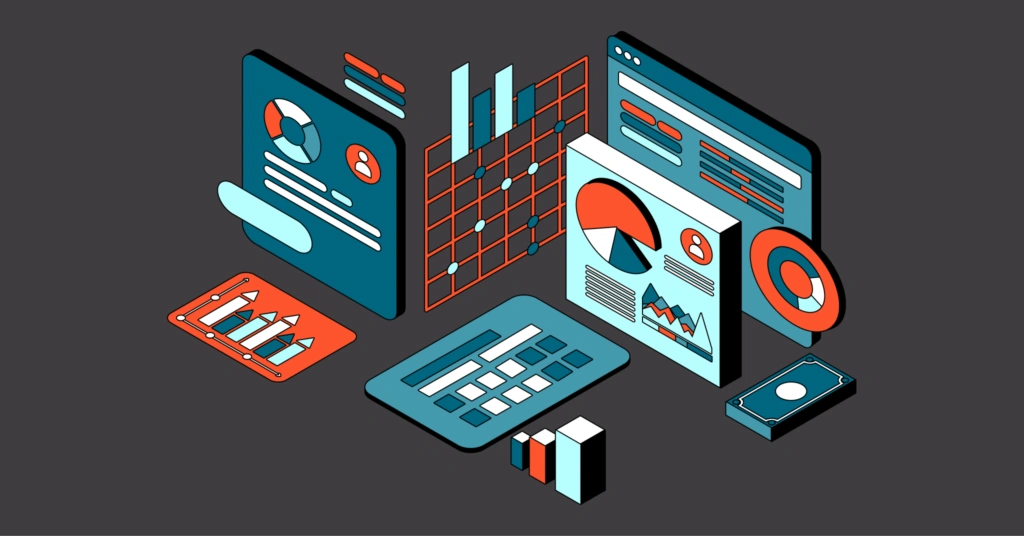
21 Financial KPIs That Your Organization Needs To Track
- Customer Acquisition Costs (CAC)
- Customer Lifetime Value (CLV)
- Cost Per Customer
- Net Profit Margin
- Monthly Recurring Revenue (MRR)
- Annual Recurring Revenue (ARR)
- Average Sales Price (ASP)
- Churn Rate
- Customer Engagement Score
- Cost Per Feature Ratio
- Lead Velocity Rate
- Lead To Customer Rate
- Average Sales Cycle Length
- Net Promoter Score (NPS)
- Average Revenue per User (ARPU)
- Quick Ratio
- Cost Of Goods Sold (COGS)
- Gross Revenue Retention
- Number Of Reactivations
- Accounts Payable Turnover
- Accounts Receivable Turnover
Report
Finance needs to prove AI’s return: CloudZero report
260 senior finance leaders (more than half CFOs) told us why the speed of seeing AI spend, not the size of it, separates who pulls ahead on AI from who gets burned.
1. Customer Acquisition Costs (CAC)
For SaaS companies, the cost of acquiring a customer can often be higher than the monthly revenue the customer generates. In this scenario, it can take months or even years to recoup this investment.
Customer Acquisition Cost (CAC) measures the amount it takes to attract new customers and specifies how long it takes the company to recover the initial investment.
This cost can be calculated by tallying the marketing and sales spend incurred in the pursuit of new customers (let’s say this is $25,000), and then divide this cost by the number of new customers acquired (let’s say you attract 7,000 new customers).
CAC = $25,000/7,000 = $3.57
2. Customer Lifetime Value (CLV)
Tracking customer loyalty gives you insight into how valuable customers may find your product and enables you to forecast how valuable your customers are over time to your business.
This is why Customer Lifetime Value (CLV) is such an important metric. CLV shows the typical net profit your business generates over the entire life cycle of a single customer. Ideally, you are able to recoup your CAC, plus much more.
The formula for calculating CLV is as follows:
Customer Value = Average Purchase Value X Average Number of Purchases
CLV = Customer Value X Average Customer Lifespan
Example:
Customer Value = $12.45 X 6 = $74.70 per year
CLV = $74.70 X 3 years = $224.10
3. Cost Per Customer
Understanding your Cost Per Customer can be incredibly valuable. Knowing how much specific customers — or segments of customers — cost your business, can help you make informed business decisions around pricing, sales, marketing, and go-to-market strategies.
For example, with cost per customer insight, you might decide to:
- Adjust your pricing to accommodate for different usage across customer segments
- Rearchitect your software to optimize costs for different segments
- Remove features that drive added costs from specific pricing tiers
- Adjust your contract for a specific customer come renewal time
The problem is, SaaS companies trying to understand and measure cost per customer can be extremely difficult. For SaaS, cloud costs are a big component of the total costs to support a customer and deliver a feature. Yet, trying to align spend on your AWS bill to customer usage is nearly impossible with native cost tools provided by Amazon.
That’s where a cloud cost intelligence platform can be handy. With a platform like CloudZero, you can align cloud costs to business metrics you care about like cost per customer, feature, product, team, and more.
You’ll never be in the dark about how much specific customers cost your business. You can see your average customer cost, your most expensive customers, and how customers use specific products or features in your business.
4. Net Profit Margin
Net Profit Margin is a critical financial KPI that measures how well your organization generates profit for each dollar of revenue that is brought in the door.
Net Profit Margin = (Net Profit / Total Revenue) x 100
For SaaS companies, healthy net profit margins typically range from 10% to 25%, though high-growth companies may intentionally operate at lower margins while investing in expansion. The better and more knowledgeable your business gets about, well, its business, the higher this margin should get. This is a key KPI that prospective investors tend to look at.
5. Monthly Recurring Revenue (MRR)
As a SaaS company, recurring revenue drives your pricing strategy and business model. So it’s important to understand how much money your company earns each month and how that revenue is changing over time.
Monthly Recurring Revenue (MRR) measures the amount your business earns each month through subscription renewals, new sales, upsells, and fluctuations on a monthly basis.
MRR = Sum of all monthly subscription revenue from active customers
You can also break MRR into components: New MRR (from new customers) + Expansion MRR (from upsells) – Churned MRR (from lost customers) = Net New MRR. Tracking these components separately reveals whether growth is coming from acquisition, expansion, or both.
MRR is critical to understanding your business growth to manage customer acquisition and exchange rates and is also helpful with predicting future revenue.
6. Annual Recurring Revenue (ARR)
Annual Recurring Revenue (ARR) is similar to MRR — except calculated on an annual basis versus monthly.
ARR = MRR x 12
ARR provides a long-term, stable assessment of your success while MRR provides insight into the step-by-step evolution of your business, allowing you to make relevant comparisons between recurring revenue and value.
It is helpful to understand how both ARR and MRR change over time, whether due to new business, customer flows, or updates to your pricing structure.
7. Average Sales Price (ASP)
The Average Sale Price (ASP) is a term that refers to the average price at which a good or service is sold.
ASP = Total New MRR in a Period / Number of New Customers in the Same Period
Tracking ASP over time helps SaaS companies evaluate whether they are moving upmarket or downmarket and whether pricing changes are having the intended effect.
8. Churn Rate
Churn Rate is the percentage of customers that cancel their recurring subscriptions over a given time period.
Current benchmarks show that median B2B SaaS annual churn sits between 3.5% and 5%, with enterprise SaaS companies (ACV above $100K) targeting under 5% annually. SMB-focused SaaS products tend to see higher churn in the 10-15% range. Companies consistently achieving under 5% annual churn are generally considered best-in-class, signaling strong product-market fit and customer stickiness.
9. Customer Engagement Score
Customer and user engagement is the lifeblood of any SaaS brand. Customer Engagement Score tracks the touchpoints between your customer and your product or service. This is not only limited to purchasing activities but may also include communication (potentially in-app, email, or live chat).
Calculating this score will vary from organization to organization, as it involves assigning individualized weighting to scoring metrics.
Based on the story that your customer engagement score metrics tell, your product team can:
- Refine and adjust product features
- Dramatically improve the user experience
- Identify potential upselling opportunities
- Predict — and prevent — fluctuations
- Cultivate enhanced relationships with customers
10. Cost Per Feature
Like cost per customer, Cost Per Feature is another cost metric that is often very difficult for SaaS companies to understand and measure. Cost per feature looks at how much a specific feature costs your business, based on usage and cloud costs.
This insight can be especially useful for companies to decide how to price their products or ways they can optimize certain features in their software for increased profitability.
For example, if you know a specific feature is quite costly to deliver to customers, you may decide to only include that feature in more premium pricing tiers. Or, maybe your engineering team can find a way to rearchitect that feature to reduce costs.
A cloud cost intelligence platform like CloudZero makes it possible to map infrastructure costs directly to individual features, giving product and engineering teams the visibility they need to make these decisions with confidence.
11. Lead Velocity Rate (LVR)
Lead Velocity Rate (LVR) is an up-to-date, real-time measure that indicates how well your lead pipeline is performing by calculating growth month-over-month.
LVR is calculated as follows:
(Number of Qualified Leads This Month – Number of Qualified Leads Last Month) / Number of Qualified Leads Last Month x 100
Example:
(1,002 – 945) / 945 x 100 = 6.03%
A positive and consistent LVR is one of the strongest predictors of future revenue growth because it measures real-time pipeline momentum rather than lagging indicators.
12. Lead To Customer Rate
The Lead To Customer Rate (also known as lead conversion rate) is the percentage of qualified leads for a company that convert to actual sales.
Poor performance in this area can indicate that your marketing or sales strategy should be revised. To calculate lead to customer rate, take the total number of customers for a period, divide them by the total number of leads and multiply them by 100.
13. Average Sales Cycle Length
The Average Sales Cycle Length is the time from the first contact with a prospective customer to the conclusion of a transaction (or, on average, the profit of a transaction). It helps to introduce predictability into your sales forecasts — allowing you to understand the average time it takes to close a possible customer.
To calculate average sales cycle length, determine when your sales cycle starts and count how long it takes a deal to close from that date. Some companies start their sales cycle with the first contact, others begin with the first push to collect leads.
14. Net Promoter Score (NPS)
Net Promoter Score (NPS) has long been considered an effective means of correlating corporate success. Harvard Business Review has referred to NPS as “the one number needed to grow”.
NPS is an indicator of success in other areas such as customer loyalty rates, customer satisfaction, and revenue growth potential.
Many organizations use NPS as a kind of general health indicator to gauge whether they are successfully serving their customers. Loyal customers are a tremendous asset to any business. NPS can help identify your customers as promoters, liabilities, or critics.
15. Average Revenue Per User
Average Revenue Per User (ARPU) is the average revenue generated per customer (either monthly or annually).
This financial KPI is especially helpful when making decisions around pricing increases or tiers, as well as for customer segmentation purposes. The ARPU calculation is straightforward, simply divide the total revenue in a given period by the number of customers in that same period.
16. Quick Ratio
The Quick Ratio is a litmus test that provides a short-term overview of a company’s liquidity situation relative to its short-term debt. This ratio offers a conservative view of the company’s ability to settle short-term liabilities with its short-term assets because it does not include inventory or other assets that are difficult to quickly convert into cash.
Quick Ratio = (Current Assets – Inventory) / Current Liabilities
Short-term assets are typically considered to be those assets that can be liquidated within 90 days. A Quick Ratio above 1.0 generally indicates that a company can meet its short-term obligations without selling inventory.
The quick ratio is also known as the acid test ratio in accounting circles. Historically, acid was used by miners in order to test metals for gold. If the metal passed the test, it meant it was pure gold. If it failed (through corrosion), it was not gold.
17. Cost Of Goods Sold (COGS)
SaaS Cost of Goods Sold (COGS) is the total cost of manufacturing and delivering a SaaS product. The following are examples of SaaS COGS:
- The cost of hosting customers’ workloads on AWS
- Software delivery costs
- Cost increases related to extra features or an increase in computing power
- Expenses associated with engineering experiments, including quality assurance
- Updates and patches for security issues
SaaS COGS Ratio = Total COGS / Total Revenue x 100
For SaaS companies, a COGS ratio below 20-30% of revenue is generally considered healthy, leaving a gross margin of 70-80% that funds growth, R&D, and operations. Since SaaS companies are subscription software companies and the business model differs from production companies, managing the various parts is critical to keeping your business profitable. Read more about what to consider in your SaaS COGS here and how to calculate it.
18. Gross Revenue Retention (GRR)
Gross Revenue Retention (GRR) is a high-level look at how well a company is retaining its customers based on revenue, excluding expansion. GRR is one of the most important indicators that investors check to measure a company’s health.
GRR = (Starting MRR – Churned MRR – Contraction MRR) / Starting MRR x 100
GRR is always capped at 100% (unlike net revenue retention, which can exceed it). Top-performing SaaS companies typically maintain GRR above 90%, while enterprise-focused SaaS often exceeds 95%. If you are unable to retain customers over the long term, your company likely has some serious challenges to overcome.
19. Number Of Reactivations
Where churn rates lead to sleepless nights, reactivations are the stuff of sweet, sweet dreams.
A reactivation refers to a customer who canceled their subscription and decides to sign up for your product or service again. Reactivation rates are important to monitor and warrant further investigation. Can you assess what has triggered the reactivation? And replicate this trigger with others?
20. Accounts Payable Turnover
Alongside Quick Ratio, Accounts Payable Turnover is another proven way to maintain a pulse on an organization’s short-term liquidity health.
While paying suppliers and creditors in a timely manner is important, organizations also need to balance this with putting their money to best use investment-wise.
21. Accounts Receivable Turnover
As important as it is to pay debts owed in a timely fashion, it is equally important for organizations to collect on debts owed to them.
While extending credit to customers is the norm for some organizations, doing so needs to be managed in such a way as to not negatively impact cash flow.
Your CloudZero Competitive Advantage
KPIs are all about using data to inform future business decisions. Choosing the right SaaS financial metrics to closely follow and monitor will help your organization to be successful.
Traditional financial KPIs like net profit margin, customer acquisition cost, customer lifetime value, etc. will always be important for companies to monitor.
Yet, for SaaS companies and organizations operating in the cloud, teams must also understand financial KPIs that directly relate to the cost of delivering their software. SaaS COGS, unit cost, cost per customer, feature, product, and more, are all critical cost metrics that will help companies stay competitive.
If for example, you know that a specific customer costs your business more than others, you may use that information to update their contract, change your pricing structure, or even rework your go-to-market strategy (to avoid similar expensive customers).
Whatever you decide, you first need the cost insight that will give you the data you need to make informed decisions — and CloudZero is a platform that can help.
CloudZero gives you the cost intelligence you need around COGS, unit cost, and cost per customer. Finance teams can see cost in the context of their business, improve cost predictability, and see the cost impact of product and business initiatives. Engineering teams can see the cost impact of their work and see exactly what is driving their cloud — and why.
Ultimately, CloudZero aligns finance and engineering teams on cloud spend — giving them the cost intelligence they need to make informed engineering, product, and business decisions that improve profitability. Request a demo today to see how it works.


