GCP Cost Reporting is one of several tools provided by Google Cloud Console. The more you know about them, the more you’ll understand your Google Cloud bill. In addition, knowing the drivers behind your costs will help you reduce waste and maximize your GCP spend.
This quick guide to GCP reporting tools will guide you on how to do it. We’ll also share how to get more detailed cost intelligence such as Cost per Customer or Cost per Feature on top of basics such as total and average costs.
What Are The Types Of GCP Cost Reports?
The Google Cloud Platform provides six main types of Cloud Billing reports. Each offers a unique view of your GCP costs, from overviews to details such as cost per service. The standard billing reports are:
1. Billing Report
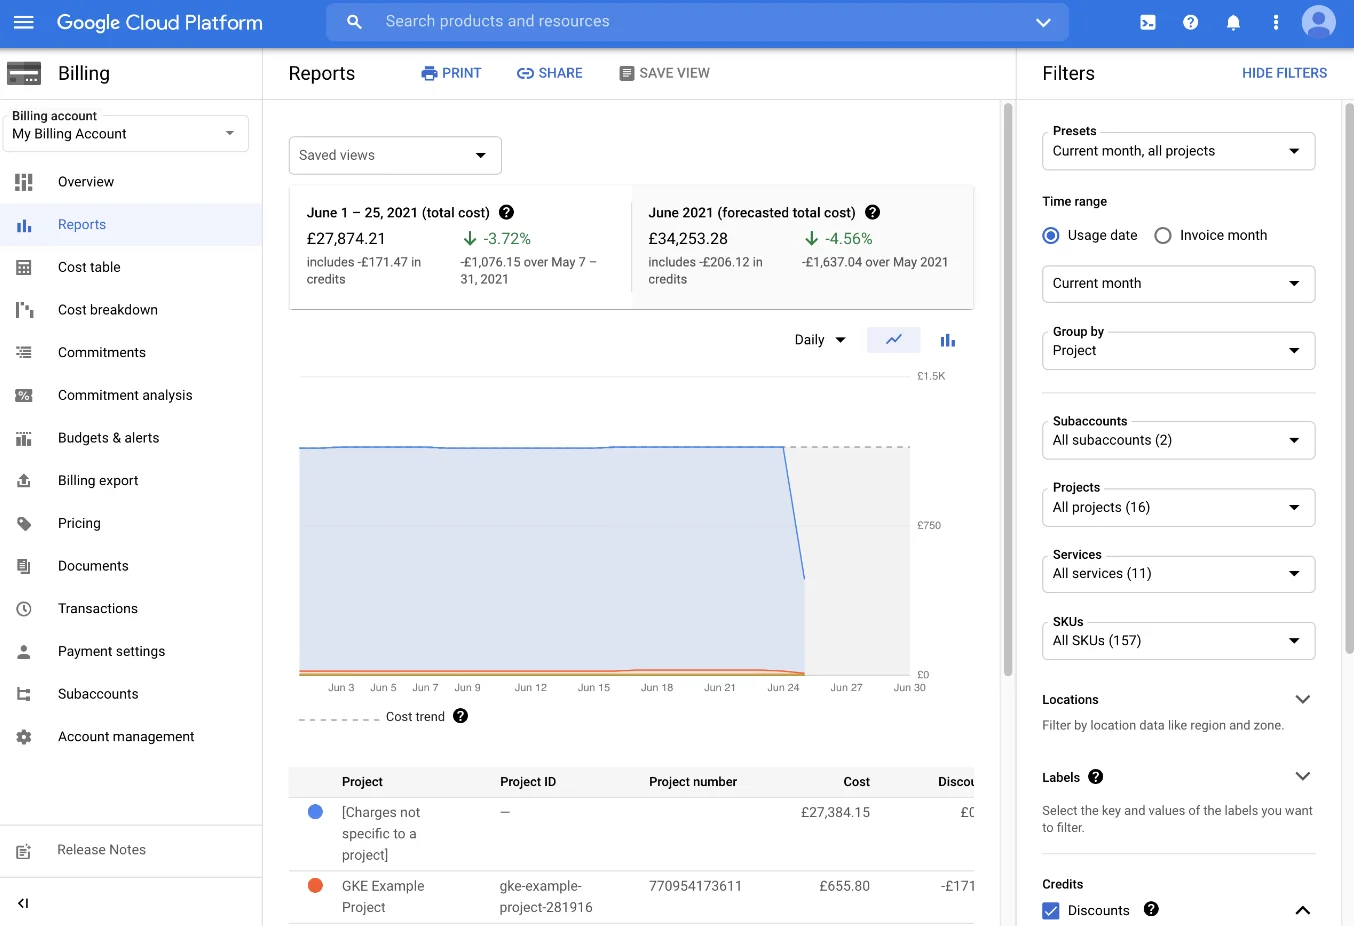
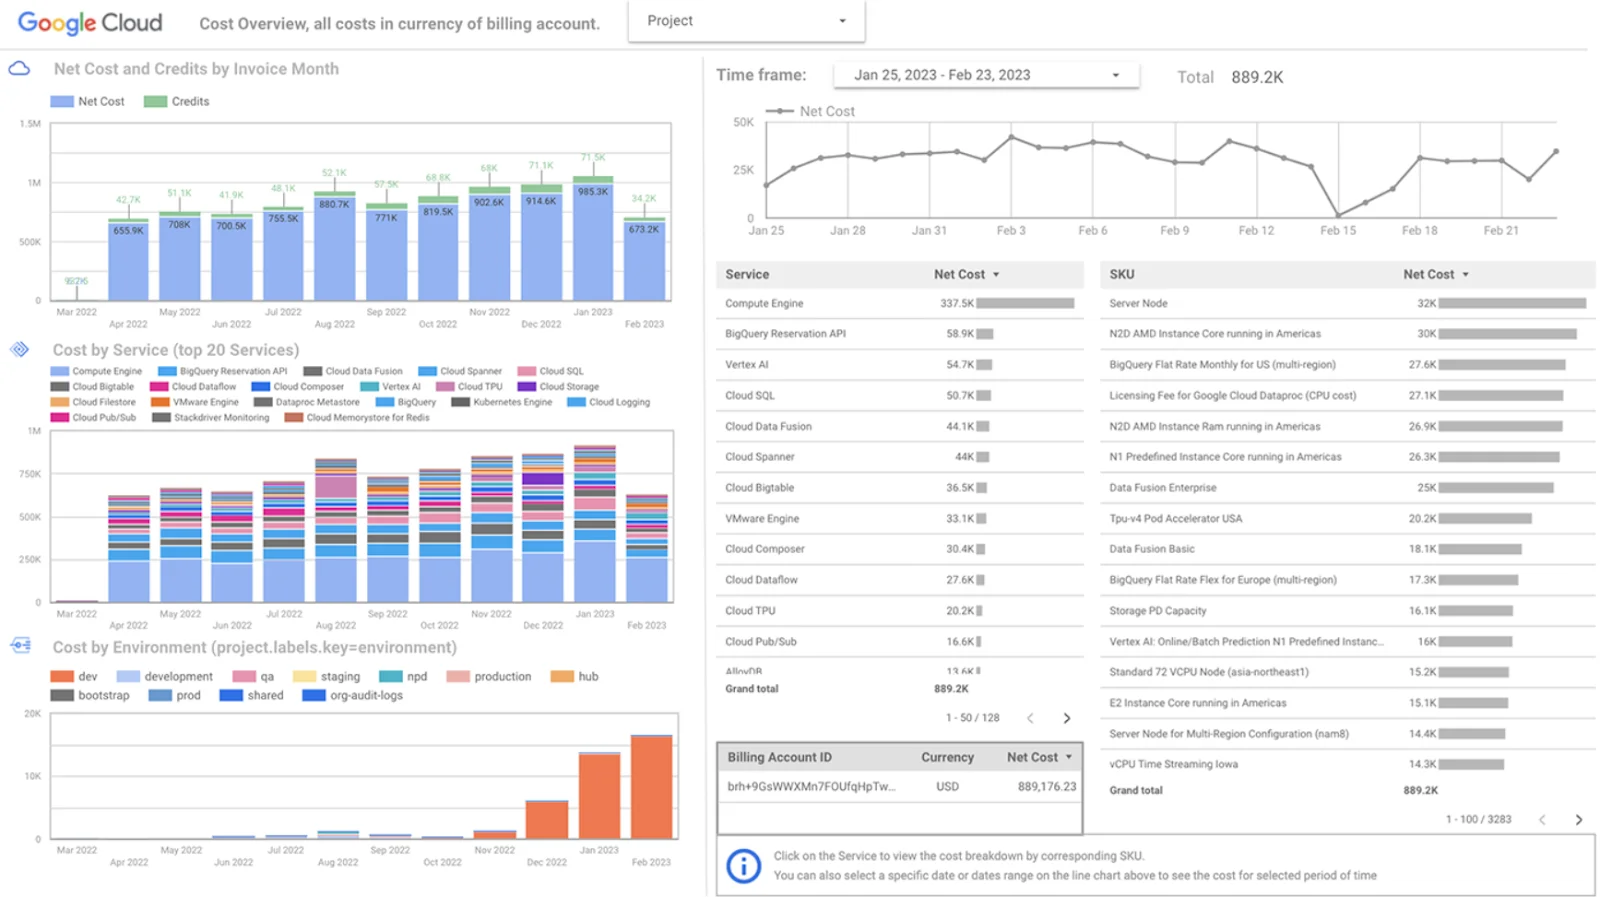
This is the default Cloud Billing report. The Reports page is the first cost management dashboard you’ll see when you log into your Google Cloud Console to explore costs. It displays all the resource usage, associated costs, and cost trends for a specific Cloud Billing account.
You’ll need to be assigned a Billing Account Viewer, Billing Account Costs Manager, and Billing Account Administrator role to access the billing report for a Cloud Billing account. If you just need to view the billing account of a single project, you’ll need to have Project Viewer, Project Owner, or Project Editor permissions.
Your billing report will provide an overview of your previous and current month’s spending. It will also provide your forecasted costs based on historical cost data.
You’ll get a chart that plots your usage costs for all projects related to the specific billing account. The default view organizes costs by service, but you can zoom into specifics by selecting a range (by data or time).
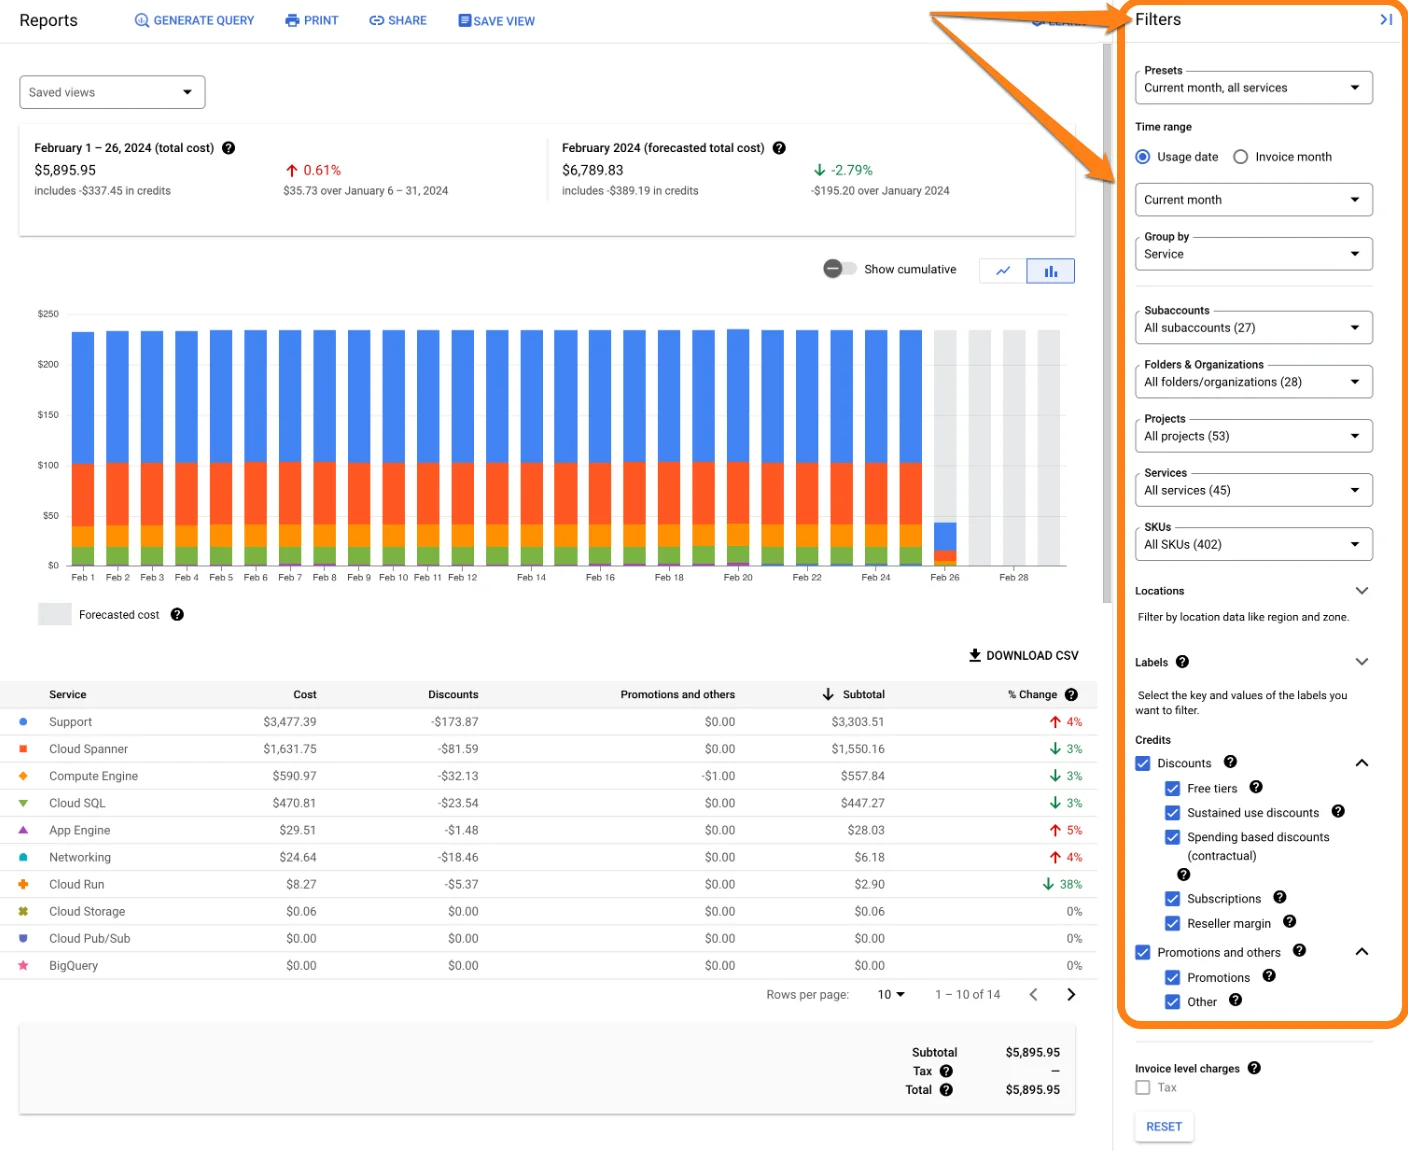
In the image, you’ll notice that you can use the chart filters to group your cost data however suits you best, from cost by project or service to cost by SKU or location/region.
2. Cost Table Report
The cost table reports on GCP provide detailed information about the costs included in your invoices and statements for an invoice month. This invoice month is the period covered by the GCP cost table report, not necessarily the calendar month.
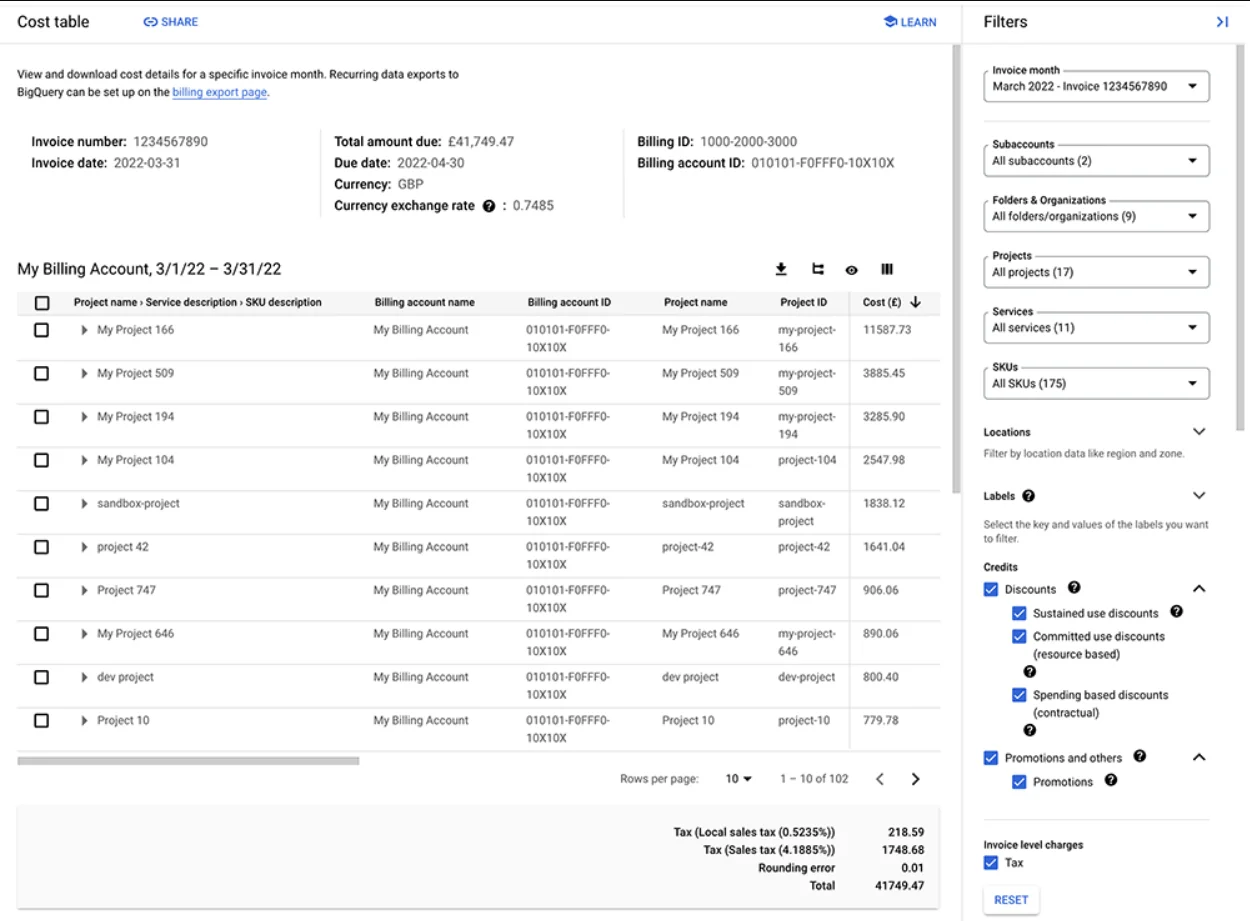
Each report displays project-level cost details, and requires similar permissions as a billing report. These include project SKU IDs, taxes by project, project numbers, and service IDs. It also gives you a tabular view of costs for a specific invoice.
Just as with a billing report, you can use filters here to view, analyze, and understand your costs in specific dimensions. And once you customize your report, you can share it or download it in PDF or CSV for further analysis.
You’ll also find details you typically do not find on your invoices these days, such as Cloud Billing account ID, remittance instructions, payment terms, and billing address. The goal of the cost report is to help you understand what you are paying for (and is included in your invoice).
3. Pricing Report
If you are keen to analyze your costs per Stock Keeping Unit (SKU) for GCP services, this is the report you’ll need. It covers SKU pricing across Google Cloud and Google Maps Platform.
Once you have Billing Account Administrator or Billing Account Viewer permissions, you have access details such as the current SKU list prices, contract price (for custom contract pricing), and effective discount percentage.
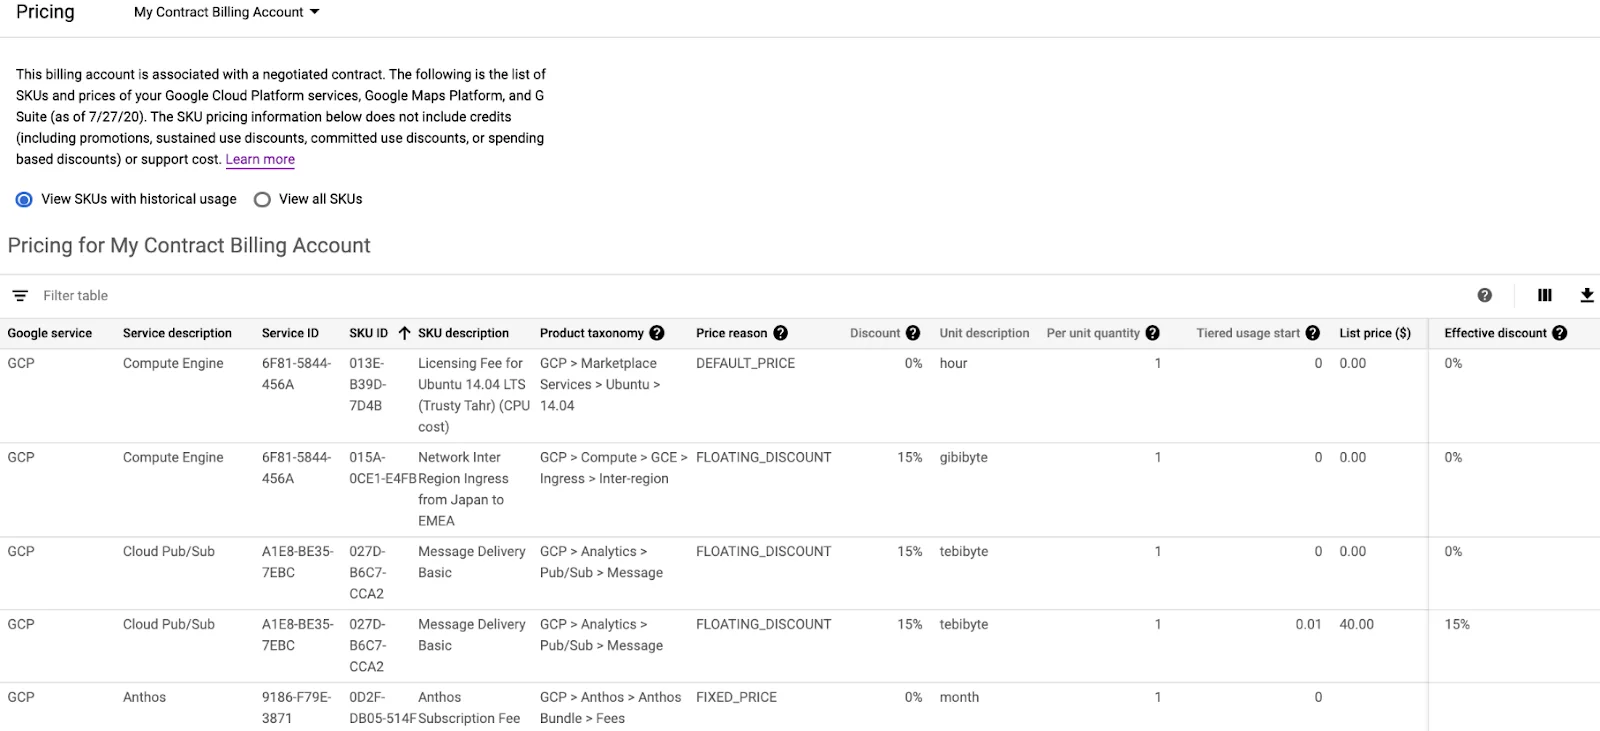
That’s not all. You’ll also get separate rows for each pricing tier for an SKU with tiered pricing, be able to download the report in CSV for offline analysis, and the currency will match the billing account.
4. Committed Use Discounts Analysis Report
Committed Use Discounts (CUDs) let you lock in a fixed minimum level of resource usage for one or three years in exchange for significant discounts. Depending on the commitment type and term length, savings range from 28% to 57% on most workloads, with discounts reaching up to 70% on memory-optimized machine types for three-year terms.
We explain how GCP CUDs work in more detail here.
The CUD Analysis Report shows your CUD scope (the percentage of eligible usage covered by commitments), total savings so far, and whether your commitments are fully utilized. This information helps you decide whether to continue specific CUDs, increase them for particular usage categories, or let underutilized ones expire.
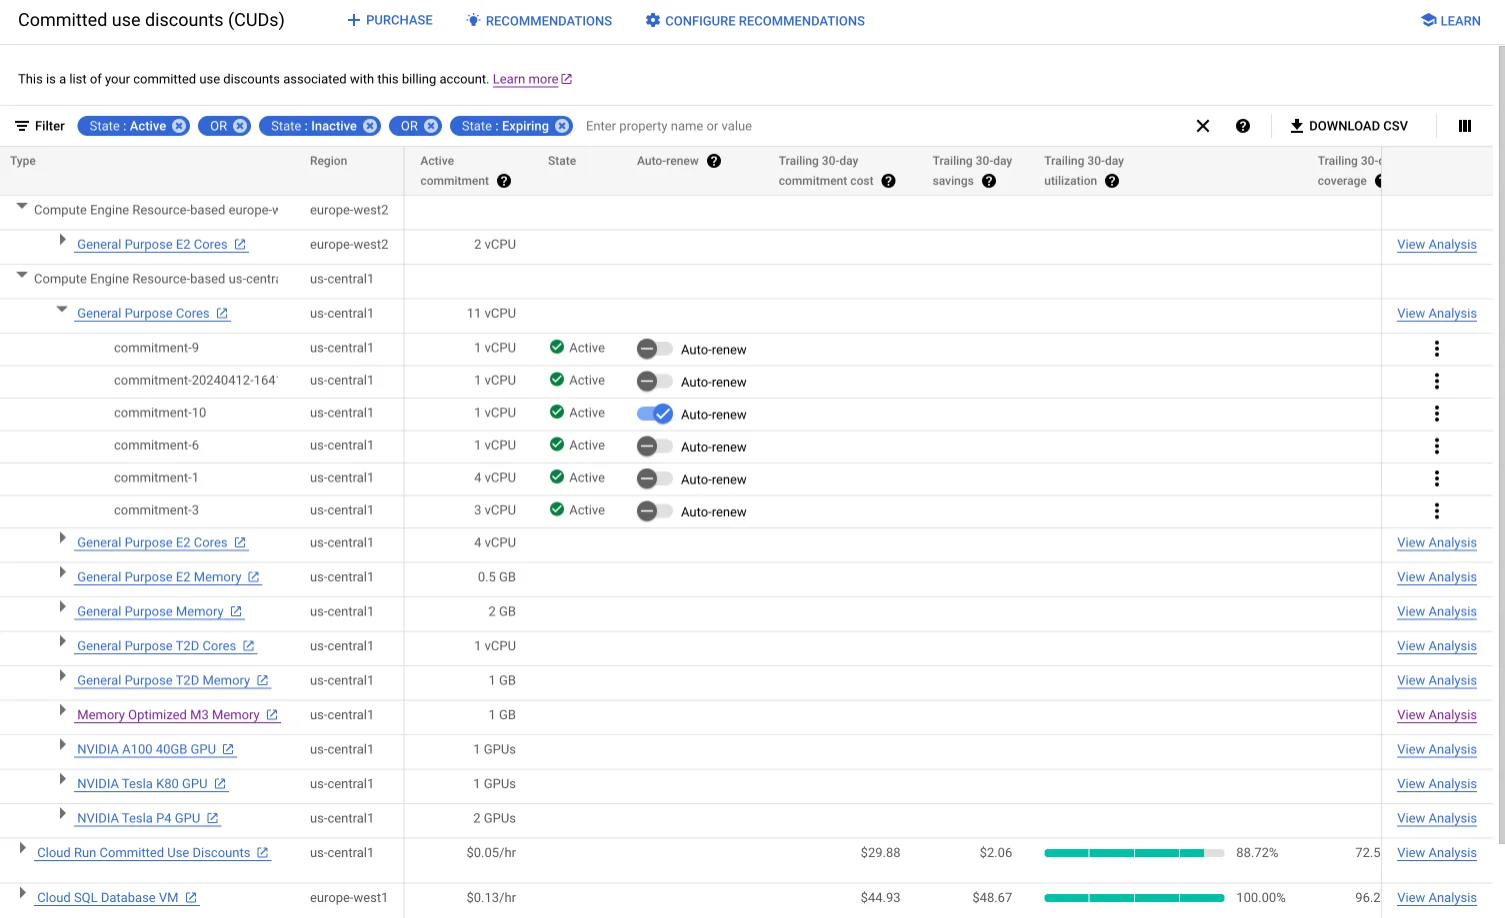
Google has also expanded CUD flexibility in recent updates. Compute Flexible CUDs now cover GKE Autopilot clusters and Cloud Run services alongside standard Compute Engine VMs, so a single commitment can cover your entire eligible compute footprint rather than requiring separate commitments per service. Additionally, as of January 2026, Google migrated legacy spend-based CUDs from a credit-offset billing model to a direct discount model, meaning discounts now appear directly on your bill rather than as separate credit line items.
5. GCP Cost Breakdown Report
A Cost Breakdown Report displays a quick “waterfall” view of your GCP monthly charges, discounts, and credits. Consider this:
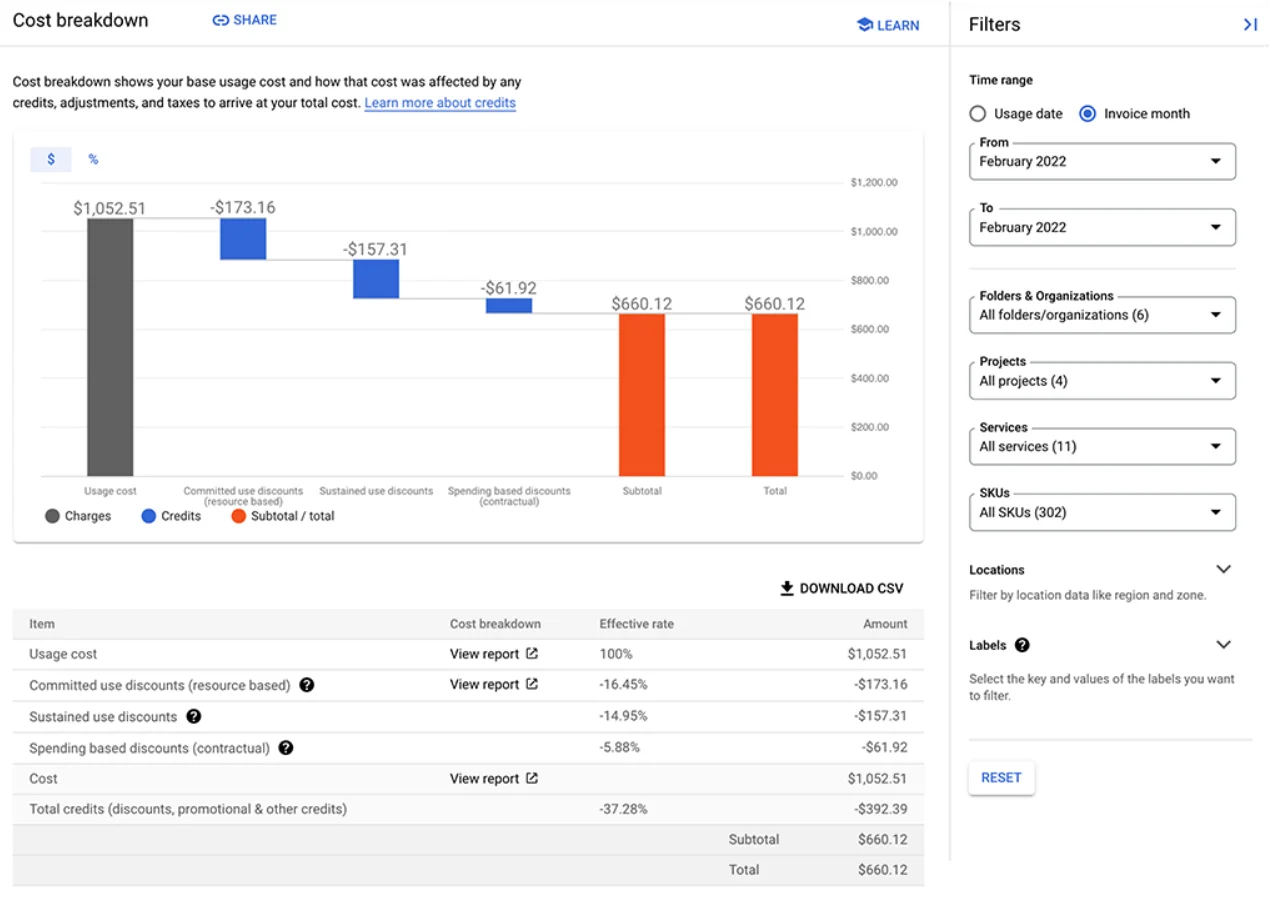
The report helps you organize costs by resource type, service, and other dimensions. This is meant to help you understand your Google Cloud cost drivers by providing a more detailed view of your spend in one place.
This is useful for identifying trends and patterns in your cloud usage and spending over time. You can also use the Cost Breakdown Reports to understand the impact of Committed Use Discounts, Sustained Use Discounts, and other savings on your bill.
To access these reports, head to the Billing section of the GCP console. Then select a billing account, and navigate to the Reports page under Cost Management. You’ll need to have a Billing Account Administrator, Billing Account Costs Manager, or Billing Account Viewer to access the reports.
When you do, you’ll be able to further customize your view using the filters on the right, copy the report’s URL for sharing, and download the CSV version for offline use.
6. Custom Cloud Billing report
But if the options available above aren’t adequate for your specific needs, GCP lets you choose how to view your cost data your way. You can do that by exporting your billing data to build your own Cloud Billing report.
You can export your detailed billing data to BigQuery and build custom reports using tools like Looker Studio for even deeper analysis. Check this out:
The first step is to enable Cloud Billing export to BigQuery. By doing this, you will be able to automatically export comprehensive Google Cloud billing data continuously into a BigQuery dataset of your choice.
From BigQuery, you can analyze your Cloud Billing data in detail. In addition, you can visualize your GCP costs using a tool like Looker Studio. Also, you can export data to a JSON file using this method.
To have access to a more comprehensive set of Google Cloud billing data for your analysis needs, GCP recommends enabling Cloud Billing data export to BigQuery at the same time you create a Cloud Billing account. This way, you’ll have a more well-structured dataset to work with, and you’ll be able to analyze your billing data more easily.
Additionally, you’ll have access to more advanced analytics, such as machine learning and artificial intelligence. And, you’ll also have the data around for longer, if you wish.
Research Report
FinOps In The AI Era: A Critical Recalibration
What 475 executives told us about AI and cloud efficiency.
Key Features Of GCP Cost Reports
GCP’s billing reports share several capabilities that make them useful for day-to-day cost management across your organization.
Granular filtering and grouping sits at the core of every report. You can slice costs by project, service, SKU, region, and labels, then combine filters to isolate exactly the spending segment you need. Label-based grouping is particularly valuable for teams that tag resources by environment, team, or application, since it turns a flat cost list into a structured view that maps to your org chart.
Discount and credit visibility is where GCP reports distinguish themselves from some competing platforms, including AWS and Azure. The Pricing Report surfaces your negotiated contract rates alongside list prices, the CUD Analysis Report quantifies commitment utilization and savings, and the Cost Breakdown Report shows exactly how Sustained Use Discounts, CUDs, and promotional credits reduce your bill. Together, these give finance teams a clear picture of effective spend versus sticker price.
Export and integration options extend reporting beyond the console. Every report supports CSV download for offline analysis, URL sharing for quick collaboration, and BigQuery export for SQL-based deep dives. Once data is in BigQuery, you can connect Looker Studio for recurring visual dashboards or feed it into your own data pipeline.
FinOps Hub is Google’s newest addition to the billing console and represents a significant step forward for GCP cost reporting. Launched as FinOps Hub 2.0, it includes a Utilization Insights dashboard that identifies underutilized resources and estimates the cost of waste, a visual Waste Map that surfaces top waste drivers by project and category, an Anomalies dashboard with root-cause analysis pinpointing which services, regions, and SKUs drove a cost spike, and Gemini Cloud Assist integration that generates natural-language summaries of your cost insights and can draft email reports for stakeholders. For teams practicing FinOps at scale, this consolidates several workflows that previously required third-party tooling or manual analysis.
IAM-based access tiers control what each team member can see. Full billing visibility requires Administrator, Costs Manager, or Viewer roles, while project-level roles limit the view to a single project’s costs. This lets you share relevant cost data with engineering leads without exposing the entire billing account.
How To Use GCP Cost Reporting
Getting value from GCP cost reports goes beyond opening dashboards. The teams that consistently control cloud spend build reporting into their operational rhythm rather than treating it as a one-off exercise.
Start with budget alerts. Before diving into reports, configure budget alerts in the Cloud Billing console. Set thresholds at 50%, 80%, and 100% of your monthly budget so you receive notifications before spend exceeds expectations. Pair these alerts with Pub/Sub triggers to automate responses, such as scaling down non-production environments when a threshold is breached.
Establish a labeling strategy early. GCP cost reports become significantly more useful when resources carry consistent labels for team, environment, product, and cost center. Use organization policies to enforce labels at resource creation, preventing untagged resources from entering your environment and creating cost attribution blind spots. Without disciplined labeling, you will spend more time deciphering reports than acting on them.
Build a regular review cadence. Weekly cost reviews using the Billing Report and Cost Breakdown Report help you catch anomalies early, while monthly deeper dives into the CUD Analysis and Pricing Reports let you evaluate whether your commitment strategy still matches actual usage patterns.
Move to BigQuery for trend analysis. Once your billing export is flowing, schedule recurring queries that surface week-over-week and month-over-month cost changes by service and project. Visualize these in Looker Studio dashboards that auto-refresh, so stakeholders get a current view without anyone manually pulling reports.
Use FinOps Hub for waste identification. The Utilization Insights dashboard highlights underused resources and quantifies the potential savings from right-sizing or decommissioning them. Make this a standing item in your cost review meetings.
That said, GCP’s native reporting tools have inherent limitations. They report on total and average costs by project, SKU, region, and service, but they cannot map spend to business constructs like cost per customer, cost per feature, or cost per deployment. For organizations that need to understand the unit economics of their cloud investment, a dedicated cost intelligence platform fills that gap.
The Smarter Way To Manage, Control, And Optimize GCP Costs
Native GCP billing tools provide solid visibility into what you are spending, but they are designed around infrastructure dimensions: projects, services, and SKUs. For organizations that need to answer business-level questions — such as which customers drive the most cloud cost, which features are most expensive to operate, or how a recent deployment affected per-unit economics — those native views fall short.
Shared resources compound the problem. When multiple teams, products, or customers share the same GCP projects or services, native reports cannot attribute cost changes to the specific people, products, or processes responsible. This makes it difficult for engineering and finance to collaborate on optimization decisions.
CloudZero bridges that gap by ingesting cost data from GCP (alongside AWS, Azure, Kubernetes, Snowflake, Datadog, and other platforms) into a single normalized model through its AnyCost engine. Combined with CostFormation’s code-based allocation rules, engineering and finance teams share the same trusted cost data without requiring perfect tag coverage.
With CloudZero, you get:
- Per-unit cost views that let you explore costs by immediately actionable dimensions like Cost per Customer, Cost per Project, Cost per Service, Cost per Team, and Cost per Customer per Feature.
- Engineering-led optimization with insights such as Cost per Deployment, Cost per Feature, and Cost per Environment, making it straightforward for your team to build cost-effective solutions.
- Hourly reporting instead of daily, enabling faster identification and resolution of cost anomalies before they compound.
- 100% cost allocation within minutes to hours, so your team stays audit-ready without manual spreadsheet work.
- Multi-cloud cost reporting across GCP, AWS, Azure, Oracle, Kubernetes, Snowflake, MongoDB, and more in a single pane of glass.
- AI-powered investigation through CloudZero’s AI Hub, where engineers can diagnose anomalies, investigate spend drivers, and understand cost impact using natural language, without leaving their workflow.
- Real-time cost anomaly alerts that prevent overruns with timely, noise-free, and context-rich notifications.
- Certified FinOps professionals supporting your team from Day 1.
CloudZero customers average 22% cloud cost savings in their first year, and the platform typically pays for itself by Month 3. Upstart, the AI lending marketplace, used CloudZero to reduce annual cloud costs by $20 million, doubling their original savings target without slowing down their pace of innovation.
 to see CloudZero in action for yourself.
Software and pricing information last verified May 2026. Features, pricing, and availability may have changed. Please verify current details with vendors before making decisions.


FinOps In The AI Era: A Critical Recalibration
What 475 executives told us about AI and cloud efficiency.