Quick answer: IT cost optimization is the ongoing process of reducing wasted technology spend while maintaining — or improving — the business value technology delivers. It applies across cloud infrastructure, SaaS applications, software licenses, and on-premises systems. The goal is not to minimize IT spend. It is to ensure every IT dollar is justified by a measurable outcome.
IT cost optimization used to mean renegotiating vendor contracts, auditing software licenses, and deferring hardware refresh cycles. For most organizations today, that playbook falls short.
Cloud has become the dominant and fastest-growing line item in IT budgets, and unlike fixed infrastructure costs, cloud spend is variable, distributed across dozens of teams, and largely invisible without dedicated cost attribution.
Gartner projects worldwide IT spending will reach $6.15 trillion in 2026, up 10.8% from 2025, with AI infrastructure and cloud services driving the majority of that growth. For the finance and IT leaders responsible for IT budgets, the question is no longer whether the cloud is the dominant cost driver. It’s whether the organization has the visibility to manage it well.
This guide covers what IT cost optimization means in a cloud-first environment, a practical five-stage framework, and the strategies that give finance and engineering leaders shared visibility into where spend is going, and whether it delivers value.
What Is IT Cost Optimization?
IT cost optimization is the ongoing process of reducing wasted technology spend while maintaining, or improving, the business value technology delivers. It applies across cloud infrastructure, SaaS applications, software licenses, and on-premises systems. The goal is not to minimize IT spend. It is to ensure every IT dollar is justified by a measurable outcome.
Cost Cutting | Cost Optimization | |
Goal | Reduce total spend | Improve spend efficiency |
Approach | Eliminate regardless of value | Eliminate waste, protect value |
Risk | May cut growth-enabling investment | Low — targets genuine waste |
Measure of success | Lower bill | Better unit economics |
When to use | Crisis response | Continuous practice |
The key distinction is between cost cutting and cost optimization: cost cutting reduces spend without regard for what gets lost, while cost optimization reduces waste while protecting the investments that drive growth, efficiency, or competitive advantage.
Done well, IT cost optimization creates room to invest more deliberately — it does not slow the business down.
For most modern organizations, cloud is the largest and fastest-growing IT cost category. Any serious IT cost optimization effort starts with cloud visibility.
Research Report
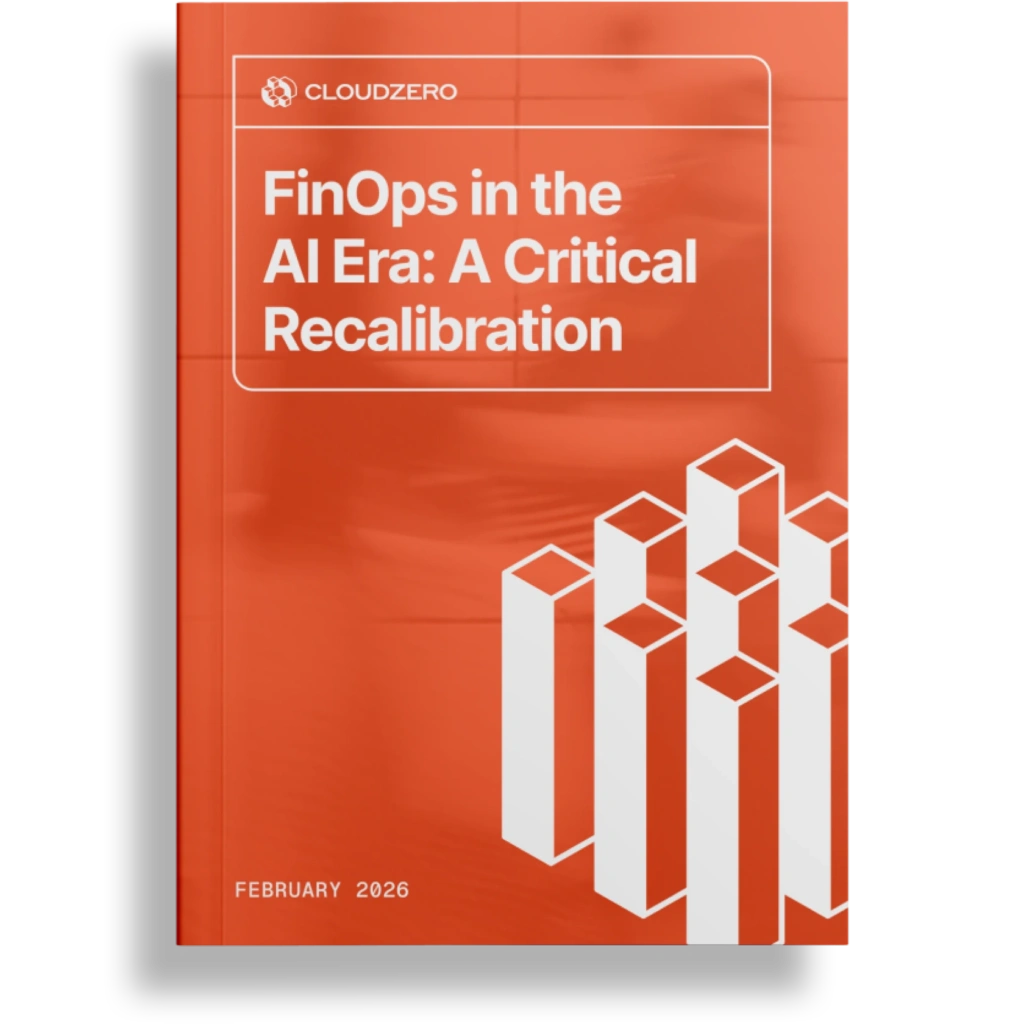
FinOps In The AI Era: A Critical Recalibration
What 475 executives told us about AI and cloud efficiency.
Why Is IT Cost Optimization Harder Than It Used To Be?
Traditional IT budgeting was built for fixed costs — hardware depreciated on a schedule, software licenses renewed annually, and data center costs were predictable. Cloud changed that model entirely. Finance teams could plan IT spend like any capital expenditure, known amounts, known timelines, clear ownership.
Cloud changed that model. Cloud costs behave like a utility bill: they scale with usage, fluctuate in real time, and are generated by dozens of engineers and teams making provisioning decisions independently.
A single misconfigured service or an unwatched development environment can drive unexpected spend before finance teams ever see it in a report.
The visibility problem runs deeper than most organizations realize. CloudZero’s 2025 State of Cloud Cost Intelligence report found that only 30% of organizations know exactly where their cloud budget is going. For larger organizations, attribution is harder still. Costs pool across shared services, Kubernetes clusters, and multi-tenant architectures that traditional tagging strategies can’t fully untangle.
AI spending is compounding the problem. CloudZero’s FinOps in the AI Era: A Critical Recalibration report found that formal cloud cost programs nearly doubled year over year, from 39% to 72% of organizations. Yet the mean Cloud Efficiency Rate (CER) fell from 80% to 65% over the same period. AI spend, now exceeding $10 million annually at 40% of surveyed companies, is driving the gap. Organizations are becoming more FinOps-mature and losing efficiency ground at the same time.
The result is a new kind of IT cost problem: not just overspending, but invisible spending, costs that can’t be traced to the teams, products, or business outcomes generating them. That is a visibility problem before it’s a strategy problem.
What Is The IT Cost Optimization Framework?
An IT cost optimization framework is a continuous cycle — not a one-time project — that progresses through five stages: visibility, attribution, rightsizing, unit economics, and governance. Each stage depends on the one before it.
Stage | Name | Core question | What it delivers |
1 | Visibility | What are we spending and where? | Complete, real-time view of IT spend |
2 | Attribution | Who owns each dollar? | Showback and chargeback by team, product, or business unit |
3 | Rightsizing | Are we using what we’re paying for? | Elimination of idle and overprovisioned resources |
4 | Unit economics | Is the spend generating value? | Cost per customer, feature, inference, or transaction |
5 | Governance | How do we lock in the gains? | Policies and workflows that make cost discipline structural |
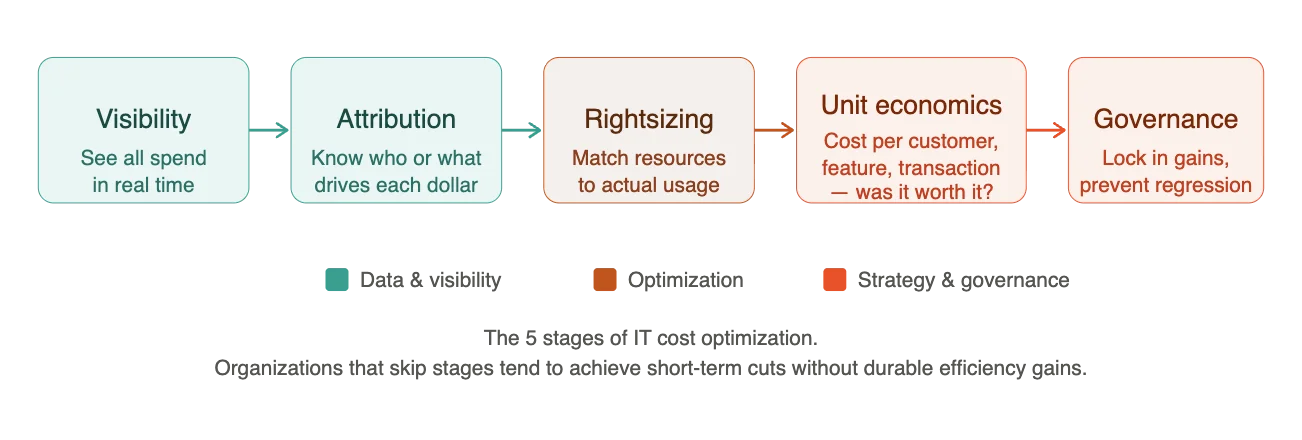
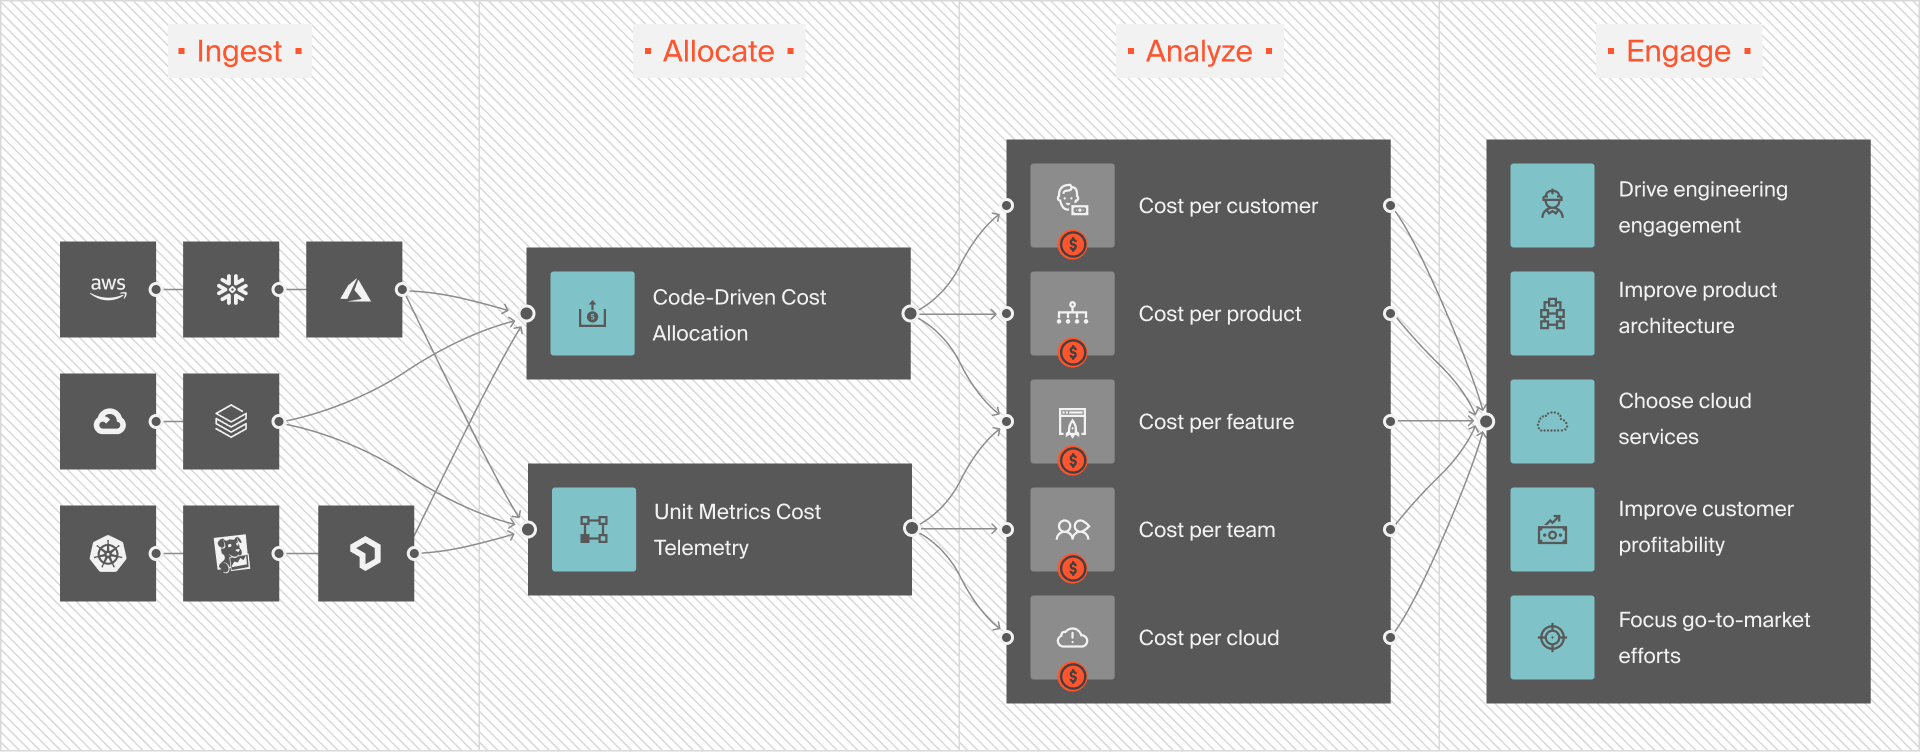
Stage 1: How do you establish IT cost visibility?
You can’t optimize what you can’t see. The first stage is establishing a complete, real-time view of IT spend across cloud providers, SaaS tools, and on-premises infrastructure. For cloud environments, this means going beyond the native billing dashboards that major providers offer.
AWS Cost Explorer, Azure Cost Management, and Google Cloud’s billing tools show spend at the account or service level, not at the level of the teams, features, or customers driving that spend.
CloudZero gives finance and engineering teams a shared view of what’s driving spend, down to the product, team, or feature level, without complete tag coverage as a prerequisite.
This shared view is the foundation everything else builds on. According to the FinOps Foundation’s State of FinOps 2025, workload optimization and waste reduction are the top priority for 50% of FinOps practitioners, and visibility is the prerequisite to both.
Stage 2: How do you attribute IT costs to the right owners?
Visibility shows you the totals. Attribution answers the more important question: who or what is responsible for each dollar? This stage involves implementing a consistent cloud cost allocation strategy, tagging resources with team, environment, application, and business unit metadata, then using that data to build showback and chargeback models.
Showback makes costs visible to the teams generating them without billing them directly. Chargeback takes the next step, allocating actual costs to business units against their budgets.
Read more about the difference between chargeback and showback and how to choose between them.
Both models create accountability and drive more deliberate spending behavior. Without attribution, optimization stays centralized in a finance or FinOps function, with little incentive for the engineering teams making provisioning decisions to change their behavior.
Tagging alone rarely achieves full attribution. Shared services, Kubernetes workloads, and untaggable resources create gaps that rule-based allocation can’t close.
Modern cost intelligence platforms address this by combining tag-based allocation with business logic to attribute 100% of spend, including the portions that traditional tools leave unallocated.
Stage 3: How do you rightsize IT resources?
Rightsizing matches resource allocation to actual usage — eliminating overprovisioned instances, shutting down idle resources, and adjusting storage, compute, and networking to reflect real demand. It is one of the highest-ROI IT cost optimization strategies available.
According to the FinOps Foundation’s State of FinOps 2025, more than 40% of practitioners identify workload optimization as their primary focus, and rightsizing is the core mechanism for achieving it.
CloudZero’s guide to cloud cost management tools covers the key capabilities to look for when evaluating platforms.
Effective rightsizing is a continuous process, not a quarterly audit. Usage patterns shift as products evolve and teams scale. Rightsizing recommendations made in January may be outdated by March. Organizations that do it well have embedded rightsizing reviews into regular engineering workflows, with tooling that surfaces recommendations in context rather than in a separate finance dashboard.
Stage 4: How do you measure IT cost per unit of business output?
Unit economics is where IT cost optimization shifts from tactical to strategic. The relevant question is no longer “how much did we spend?” — it is: what is our cost per customer, product, team, model, or per AI? These metrics integrate cloud spend to business outcomes and answer the question that matters most: was it worth it?
Cost per unit, sometimes called a unit cost metric, is calculated by dividing a subset of cloud spend by the business activity it supports. A SaaS company might track cost per active user to monitor whether engineering efficiency improves as the product scales. A company deploying AI features might track cost per inference to evaluate whether those features are economically viable at current prices.
This is the center of CloudZero’s unit economics capability, connecting cloud and AI spend directly to business outcomes so cost per customer, cost per feature, and cost per transaction are operational metrics, not estimates.

According to CloudZero’s 2024 State of Cloud Cost report, only 43% of organizations track cloud costs at the unit level — meaning the majority still can’t answer basic questions about which team, product, or customer is driving spend.
Stage 5: How does governance lock in IT cost gains?
Governance locks in the gains from the previous four stages and prevents regression. It includes the policies, workflows, and cross-functional structures that make cost accountability part of how the organization operates, not a quarterly exercise. The FinOps Foundation’s 2025 framework update elevated governance and policy enforcement as the top future FinOps priority, reflecting the maturation of the discipline beyond pure cost reduction.
Practical governance includes tagging policies enforced at deployment, automated budget alerts and anomaly detection, regular cost reviews shared between finance and engineering, and clear cost ownership at the team or product level. Organizations with mature governance catch cost anomalies in real time and have clear processes for resolution.
What Are The Most Effective IT Cost Optimization Strategies?
The framework above provides the structure. The following strategies move an organization through it. Most organizations are already doing some version of several, the goal is to do them systematically.
1. Audit and consolidate SaaS spend
SaaS sprawl is one of the most common sources of preventable IT waste. Departments procure tools independently, licenses accumulate, and renewal cycles arrive without anyone verifying actual usage.
A regular SaaS audit, quarterly is the right cadence for most organizations, should identify unused licenses, redundant tools serving the same function, and applications that can be eliminated. The FinOps Foundation’s State of FinOps 2025 found that managing costs beyond public cloud, including SaaS, is now a top-five priority for FinOps teams, reflecting how quickly SaaS has become a significant cost management challenge in its own right.
2. Optimize cloud commitment coverage
On-demand cloud pricing is the most expensive way to run predictable workloads. Reserved Instances, Savings Plans on AWS, and equivalent commitment-based discount programs on Azure and Google Cloud offer savings on steady-state compute, often 30–60% compared to on-demand rates. The challenge is matching commitment coverage to actual usage.
Overcommitting locks organizations into resources they don’t need; undercommitting leaves savings on the table. Commitment optimization works best as a dynamic process adjusted as workloads evolve, not a one-time purchasing decision.
3. Enforce consistent resource tagging
Every cloud resource should carry metadata identifying its owning team, environment, application, and cost center. Without consistent tagging, attribution is impossible, and without attribution, accountability collapses.
Tag policies enforced at deployment prevent the attribution gaps that make cost allocation unreliable. Automated compliance checks that flag untagged resources before they generate spend are more effective than retroactive tagging campaigns.
4. Automate non-production environment shutdowns
Development, testing, and staging environments don’t need to run around the clock. Automating shutdown policies for non-production resources during off-hours and weekends is among the fastest IT cost reduction strategies available, with low technical complexity and no production impact. For organizations that implement this systematically, idle compute spend in non-production drops substantially.
5. Build showback before chargeback
Making teams aware of the costs they generate through showback reporting is often more effective than billing them directly, at least early in a cost accountability program.
Showback creates transparency without the friction that chargeback can introduce when cost allocation methods are still being validated.
Once teams understand what they’re spending and why, the transition to chargeback is smoother and more credible. The goal in both cases is the same: engineering accountability for cloud costs, so optimization happens where infrastructure decisions are made.
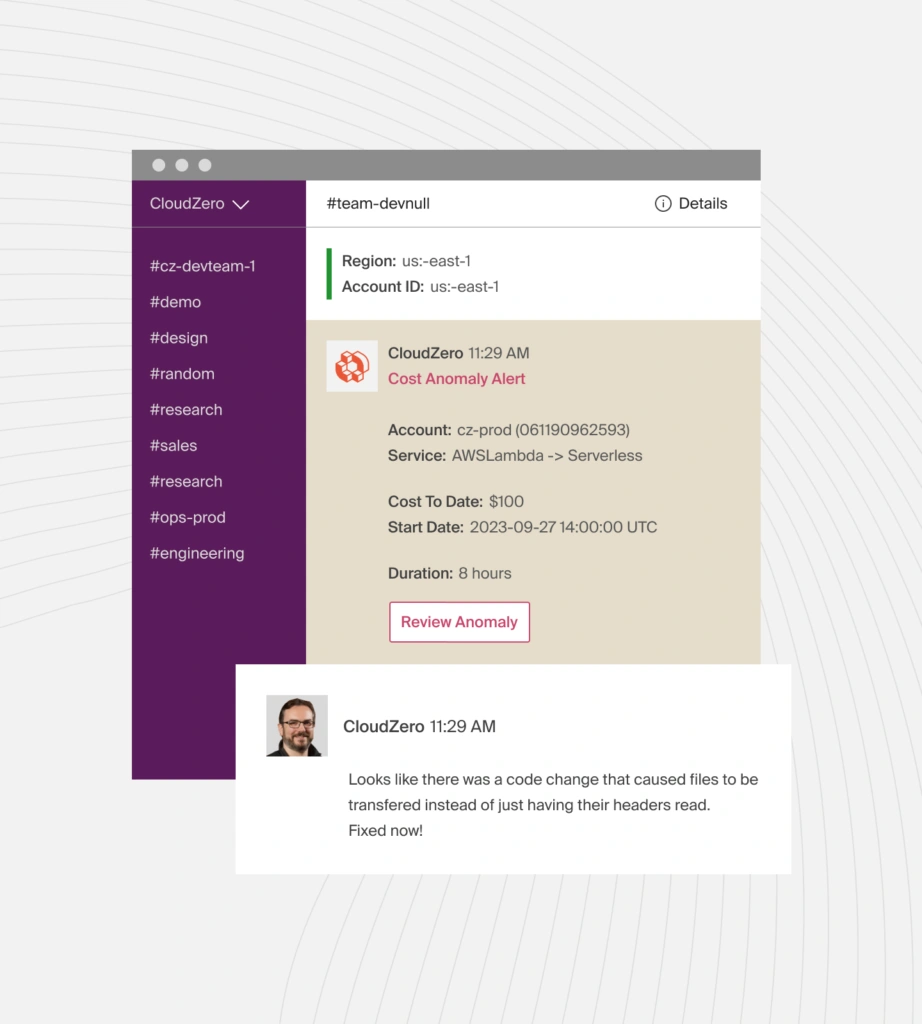
6. Set up real-time anomaly detection
Cost anomalies — a misconfigured service, an unintended data transfer, a development environment left running, can generate significant spend before surfacing in a monthly report.
Real-time cloud cost anomaly detection surfaces unusual spend patterns within hours, giving teams a chance to investigate and remediate before costs compound. Effective alerts are specific: they identify the service, team, and likely cause, not just a generic cost increase.
CloudZero’s cost anomaly detection
7. Measure cost per unit, not just total spend
Total cloud spend going up is not necessarily a problem. It may mean the business is growing.
Total cloud spend going down is not necessarily good. It may mean engineering velocity has slowed.
The metric that reveals whether IT spend is efficient is cost per unit of business output: cost per customer, transaction, feature, model, etc. When those numbers hold steady or improve as the business scales, IT costs are optimized in the truest sense. When they rise faster than business output, that is where optimization work needs to focus.
How Do You Measure IT Cost Optimization Success?
IT cost optimization success is measured not by how much spend was cut in absolute terms, but by efficiency gains relative to business output — unit cost trends, waste percentage, commitment coverage, and forecast accuracy.
The following KPIs give finance and engineering leaders a shared language for tracking progress.
KPI | What it measures | Why it matters |
Cloud Efficiency Rate (CER) | Cloud spend as a percentage of revenue | Single metric connecting cloud investment to business scale |
Cost per unit | Cost per customer, transaction, feature, or inference | Reveals whether spend is efficient relative to business output |
Waste percentage | Share of spend on idle or overprovisioned resources | Tracks whether rightsizing and governance efforts are holding |
Commitment coverage rate | Percentage of eligible spend on reserved or committed pricing | Measures rate optimization maturity |
Budget variance | Gap between forecast and actual cloud spend | Indicates whether attribution and forecasting processes are maturing |
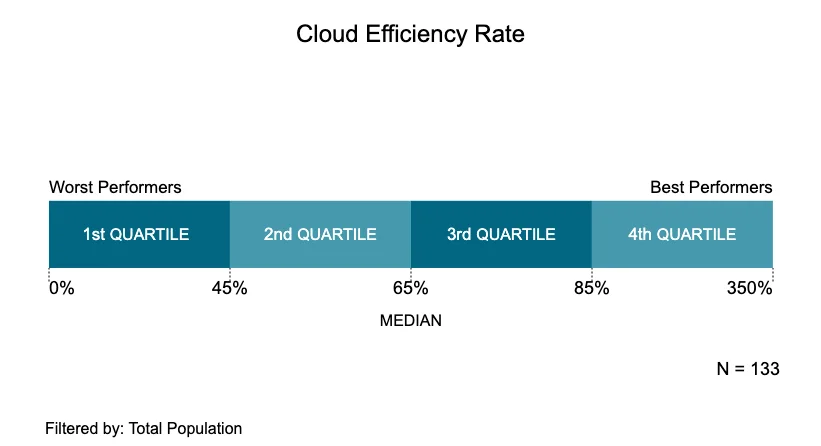
- Cloud Efficiency Rate (CER). Measures cloud spend as a percentage of revenue. A CER of 92% means cloud costs represent 8% of revenue, elite performance. CloudZero’s benchmarks show top-quartile CER at 85% in the most recent reporting period, while the median has fallen to 65% as AI spend grows.
CER gives finance leaders a single efficiency metric that connects cloud investment directly to business scale. Read more in CloudZero’s cloud unit economics 2026 guide.
- Cost per unit metrics. Cost per customer, transaction, feature — whichever unit is most meaningful for the business. These metrics make IT cost optimization visible to product and engineering leaders in terms they recognize.
- Waste percentage. The proportion of cloud spend attributed to idle, overprovisioned, or unoptimized resources. The FinOps Foundation identifies waste reduction as the top priority for 50% of practitioners. Tracking this figure over time shows whether rightsizing and governance efforts are taking hold.
- Commitment coverage rate. The percentage of eligible cloud spend covered by reserved or committed pricing. Higher coverage on steady-state workloads means lower effective rates. Effective Savings Rate (ESR), a FinOps Foundation KPI, measures actual savings against the maximum possible and is a useful benchmark for rate optimization maturity.
- Budget variance. The gap between forecast and actual cloud spend. Tightening this variance over time is a direct indicator that cost attribution and forecasting processes are maturing.
Frequently Asked Questions About IT Cost Optimization
The median Cloud Efficiency Rate just fell to 65%. Where do you stand? Half of organizations now send 35 cents of every revenue dollar to cloud providers, and most can’t explain why. CloudZero shows you exactly what’s driving your spend, who owns it, and whether it’s delivering value. Calculate your CER and see how you rank.


FinOps In The AI Era: A Critical Recalibration
What 475 executives told us about AI and cloud efficiency.