Measuring and monitoring unit economics can help your SaaS brand make smarter, faster decisions across product, finance, and engineering.
But according to Capgemini’s Sept. 2025 global survey, only 29% of organizations report achieving the cost savings they expected from their SaaS investments. That’s a staggering miss, and it reflects a growing disconnect between cloud adoption and business impact.
SaaS teams today aren’t struggling with access to data. They’re struggling with the wrong data or overly nascent data. Traditional cost metrics are too high-level, too delayed, or too disconnected from how your product actually works. To drive profitable growth, you need real-time visibility into the cost and value of your work.
That means seeing your spend at the unit level.
But how do you get that data, and what exactly are SaaS unit economics? We’ll cover exactly what SaaS unit economics are, metrics you should monitor, how to calculate your unit economics, and the tools you can use to be successful.
What Is SaaS Unit Economics?
Unit economics refer to the revenue and costs of a business measured on a per-unit basis. Often, they describe how a specific unit will impact a company’s costs, revenues, and other essential financial metrics.
Within the SaaS industry, this usually refers to how the addition (or loss) of a new customer will influence the company’s bottom line and financial performance.
But what exactly is a “unit”?
A unit will always represent a customer in one way or another. How this is defined depends on the business and industry.
SaaS typically uses a “units-as-customers” model, where each customer is considered a single unit, regardless of the number of subscriptions they purchase.
For example, say you have a large organization that purchases several subscriptions of your software (or several user seats). Although this company has purchased several subscriptions, they are still treated as a single unit.
Compare this to the “units-as-products-sold” model, where each subscription is counted as one unit. This model is more common for physical products, where production costs are associated with each item sold.
Why Should SaaS Companies Track Unit Economics?
We’ve covered how SaaS unit economics are defined and highlighted a few benefits, but let’s dive deeper into this topic. Why should you care about SaaS unit economics, and why are they important for your business to track?
Ultimately, the answer is simple. Understanding your unit economics will allow your company to make informed business, product, and engineering decisions with cost in mind. For example, if you know that a specific customer segment costs your business more, you can:
- Adjust your pricing to accommodate different usage across these segments
- Re-architect your software to optimize costs for different segments
- Remove features that drive these added costs from specific pricing tiers
There are several moves you can make, but you won’t know how to move forward unless you understand your unit costs. Understanding your unit costs becomes even more critical as your business scales.
Take what happened during the COVID-19 pandemic, where many companies saw a drastic increase or decrease in usage of their software.
For companies that saw a dramatic increase in usage, they’d want to know:
- What percentage of new users are using the free tier? Is that out of whack with the usual user breakdown?
- Are users behaving differently than before? If so, has the cost of operating the software increased, decreased, or stayed the same?
- How much does it cost per user at each price tier? Have costs increased in any way that seems unusual?
- Have there been any cost spikes? If so, what caused them?
- How resilient has the system been technically? Has the team had to invest more time than usual in incident management?
- If users increased by 100x, have profits increased as well?
Increasing the number of users is only good news if each new user can be served profitably. Companies don’t want to find themselves in a situation where they are scaling up but losing more money with each additional customer, or scrambling to address the tech debt from an inefficient system amid a usage explosion.
While you grow and bring on more and more customers, it’s natural that your costs will increase. What’s important to know is how your unit economics are affected by this growth (whether they remain flat, increase, or decrease), so you can ensure profitability for your company.
On the other hand, what about the businesses that saw their customers nearly disappear overnight?
In this case, ideally, cloud costs would have also scaled down. If they didn’t, though, it’s because these companies had some fixed capacity (often related to storage) that doesn’t scale down automatically. While scalability and elasticity are core advantages of using the public cloud, it’s also a mistake to think that they are out-of-the-box features.
The reality is that cost elasticity has to be a part of the architectural design — it’s not an automatic result of moving to the cloud. In most cases, though, as long as you have visibility into the system to see where the costs are coming from, you can scale down manually.
If users decline, a detailed understanding of your unit economics, including your fixed costs and variable costs, as well as strategies to minimize costs as much as possible during the downturn, can be the difference between scaling back up in six months or permanently closing your doors.
Let’s look at one more example of how understanding your unit economics can be beneficial — determining your free tier offerings.
At face value, giving away anything for free might seem like an economically irrational decision. However, the freemium model has proven effective within the SaaS industry and may yield long-term dividends for your business. The key here, however, is to understand how customers use your free tier and what it costs your business to offer specific features or products for free, per customer.
A free tier can be a great way to attract new signups, but it can also be dangerous, as the company isn’t generating any revenue from these new users.
Take, for example, Drift in March 2020.
During this time, the company saw a significant increase in free-tier users of their chatbot — and suddenly, their unit economics were totally off. Too many free-tier users could tank the company if increasing cloud costs were left unchecked.
Luckily, Drift already had visibility into their costs, so they were able to:
- Recognize that having so many free-tier users was a problem for the company’s margin immediately, rather than at the end of the month when the AWS bill showed up
- See where the problem was — in the chatbot tool — and have specific conversations about what to do about it
- Re-architect the chatbot (instead of eliminating it from the free tier, which could have alienated users), reducing the cost of running the chatbot by 80% and making it viable to offer for free
Again, understanding your unit economics and knowing just how much specific features, products, and customers cost your business allows you to make informed decisions that drive profitability for your company.
10 Essential SaaS Unit Economics Metrics To Track
Utilizing the right unit economic metrics can help SaaS companies identify opportunities and plan for the future.
Some key SaaS unit economic metrics to pay attention to include:
- Cost per customer – For SaaS companies, this cost is often defined by how customers use specific features within your software and the cloud cost that drives those features.
- Cost per feature – Understanding your cost per feature is also important as it will indicate which features of your business cost you the most and why.
- Lifetime value (LTV) – As suggested, this important metric indicates how much value each customer creates for your company over time. When LTV increases, most other (positive) metrics will also increase.
- Customer acquisition costs (CAC) – On the flip side, CAC reveals how much you are spending to gain an additional customer. SaaS companies with high CAC will struggle to perform on the margin.
- Churn rate – This figure represents the number of users who cancel (or fail to renew) their subscription within a specified period. The opposite of churn rate is retention rate.
- Total revenue – Revenue illustrates how much positive cash flow your business has been able to generate. Revenue will be especially important during any fundraising efforts.
- Number of customers (C) and transactions (T) – Examining your current volume of customers and transactions can help your business develop an effective scaling strategy.
- Average Customer Lifetime (ACL) – This figure describes how long, on average, a customer subscribes to or uses your software. When ACL is higher, it is easier to justify a higher CAC.
- Gross profit – This useful, universal metric illustrates the difference between your revenue and the cost of sales. Here’s how to calculate gross margin for SaaS.
- Gross margin per customer lifespan (GML) – GML helps you examine LTV on a per-margin basis, rather than looking at the customer throughout their lifetime.
For a deeper dive into SaaS performance tracking, check out this guide to 17 critical SaaS metrics every company should monitor.
How To Calculate SaaS Unit Economics (With Formulas)
Many of the metrics mentioned in the previous section use a consistent formula, making it easier to track your business’s performance over time and also compare it to similar organizations.
Some of the information needed to calculate and measure unit economics can be found on your two most important financial statements: the income statement and the balance sheet. The rest of the information can be found on your performance reports.
What are the most useful SaaS unit economic formulas to use today?
Lifetime value = Average revenue per unit (ARPU) / revenue
This formula helps you calculate the expected revenue from a customer over the lifetime of their subscription. This can help you understand and predict the total value of a customer. In turn, you can make well-informed decisions about how much to spend on acquiring and retaining customers.
You can also use this data to identify and target the most profitable customers. You can do this by segmenting customers based on their value to the business and then investing more resources into acquiring and retaining them.
Customer acquisition cost = (Total marketing expenses + total sales expenses) / number of new customers acquired
This formula indicates the average cost of acquiring a new customer. You can compare your CAC with those of your industry peers to determine if yours is healthy. If your CAC is high, you’re eating into your margins, leaving money on the table.
A low CAC can indicate that your product-market fit is excellent, allowing you to attract and retain customers with minimal conventional marketing effort. For example, a low CAC may indicate a high volume of referrals, such as those generated through word of mouth and positive online reviews.
Churn rate = Customers who left during period/customers at beginning of the period
This formula helps businesses measure customer retention, revenue stability, and overall customer satisfaction. By understanding your churn rate, you can track areas that could be leading customers to leave.
A high churn rate in SaaS may indicate poor customer service, poor product-market fit, low product value, or inadequate customer engagement. It can also be an indication of low customer satisfaction and ineffective retention strategies.
It is crucial to analyze the reasons behind a high churn rate to develop effective strategies to reduce it.
A low churn rate, however, can be an indicator of excellent product-market fit, smooth customer experiences, and effective customer retention strategies.
Average customer lifetime value = Average customer lifespan / average customer value
The ACLTV formula helps you understand how much revenue you can expect to receive from a customer throughout their subscription.
If your ACLTV is high, it means you are generating more revenue from each customer, and this is a good sign that your business is healthy. It may indicate that you have a strong product or service that customers are loyal to, and that they are willing to spend more money on.
A low ACLTV could indicate that you have a faulty pricing model or prices, high customer acquisition costs, or poor customer retention strategies.
Calculating metrics like cost per customer and cost per feature can help you identify these issues and adjust your pricing models or customer acquisition strategies accordingly.
Most SaaS unit economic metrics are simple ratios, or at least indirect derivatives of these ratios. Calculating these metrics is fairly straightforward, as long as the numbers you are inputting are accurate.
Identifying and measuring metrics, such as cost per customer or cost per feature, can be more challenging, though.
For example, if you use AWS as your cloud service provider, you may receive a bill at the end of the month showing what you spent on the various services you use, but you have no context for how those costs translate to your business.
For this, you will need a cloud cost intelligence platform that can map costs to specific features, products, and more in your business — and show you exactly what AWS services cost you the most and why.
For more on tracking cloud costs, see our complete cloud unit economics guide.
With that in mind, let’s move on to some different tools and software you can use to monitor your unit economics.
Tools For Measuring And Monitoring SaaS Unit Economics
Unit economics play an important role within the SaaS industry, so it’s no surprise that there are robust SaaS tools available to help you track and manage them.
Here are a few of the top options:
CloudZero
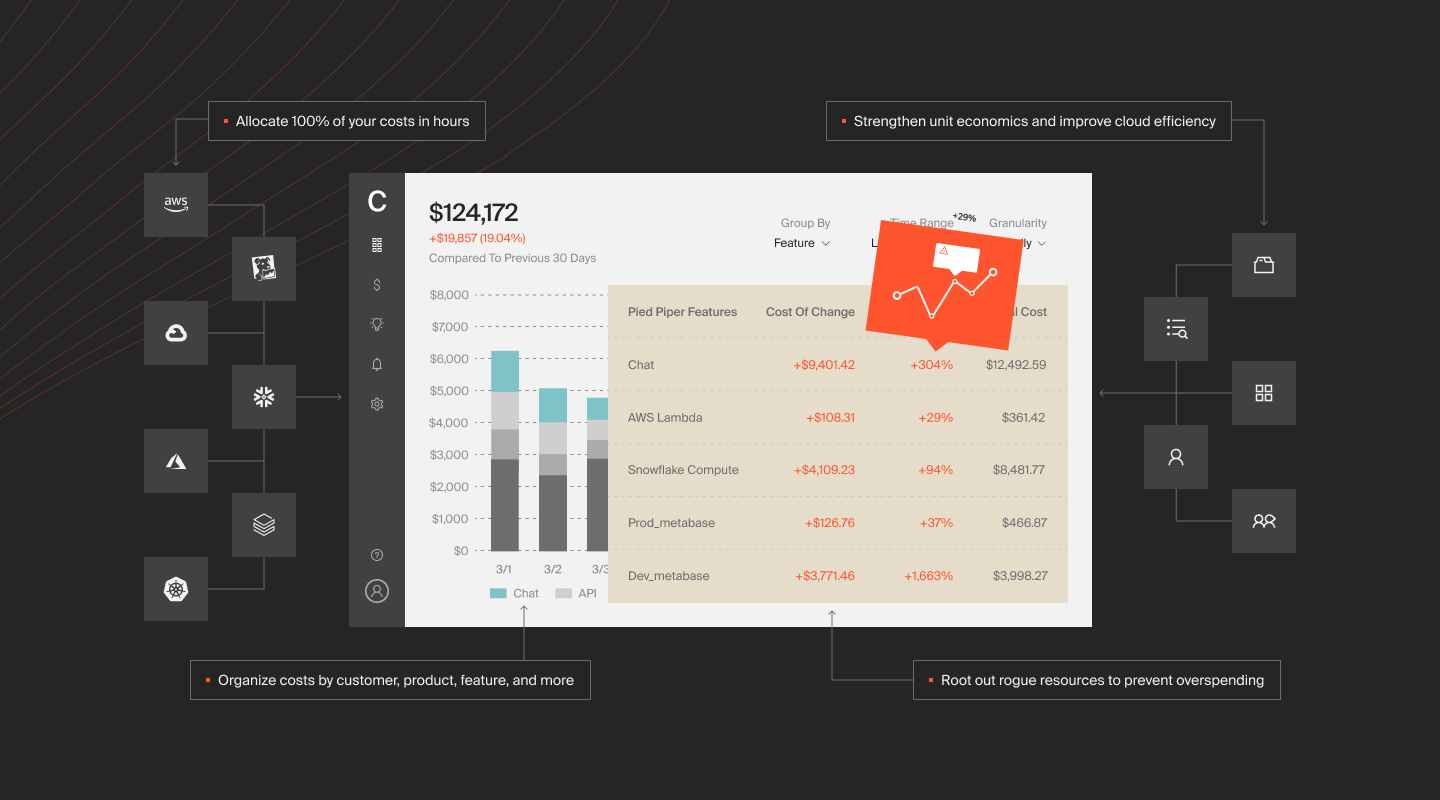
CloudZero is a cloud cost intelligence platform that enables SaaS companies to map cloud costs to products, features, teams, and more, as well as identify and monitor unit costs such as cost per customer.
For instance, CloudZero’s cost per customer report enables teams to see how individual customers contribute to their cloud spend and how specific customers impact their feature costs.
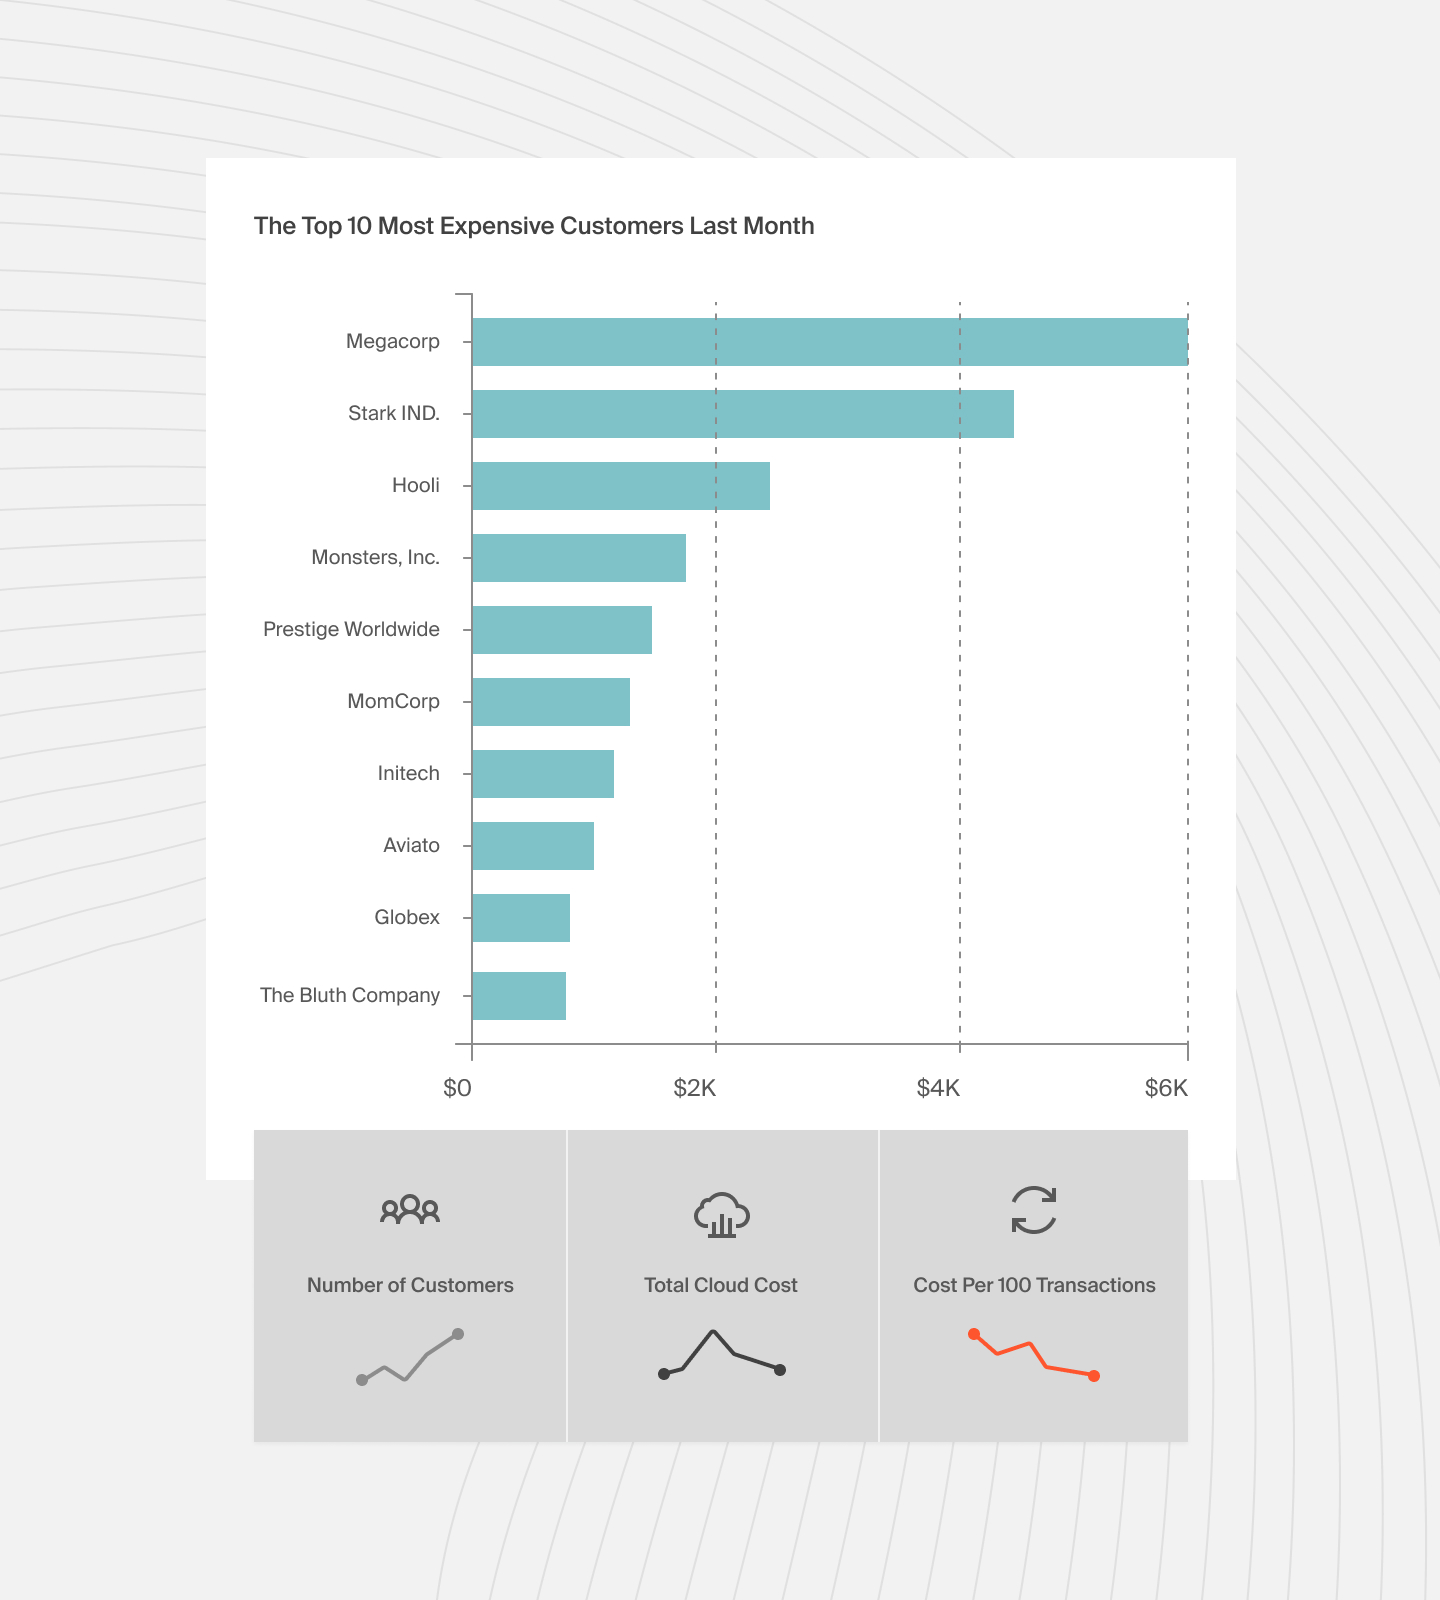
CloudZero also enables engineering teams to drill down into cost data from a high level to the individual components that drive their cloud spend — and see exactly which AWS services cost them the most and why.
With detailed cloud cost intelligence, you can make informed decisions to reduce spend or adjust infrastructure for profitability. To see CloudZero in action,  .
.
Related read: What Is Cloud Unit Economics (CUE)? A Comprehensive And, More Importantly, Fun Guide.
Updata

Updata offers a useful unit economic framework that specifically caters to SaaS companies. The framework can be used to break down expenses by unit, helping decision-makers gain deeper insights.
Chart Mogul
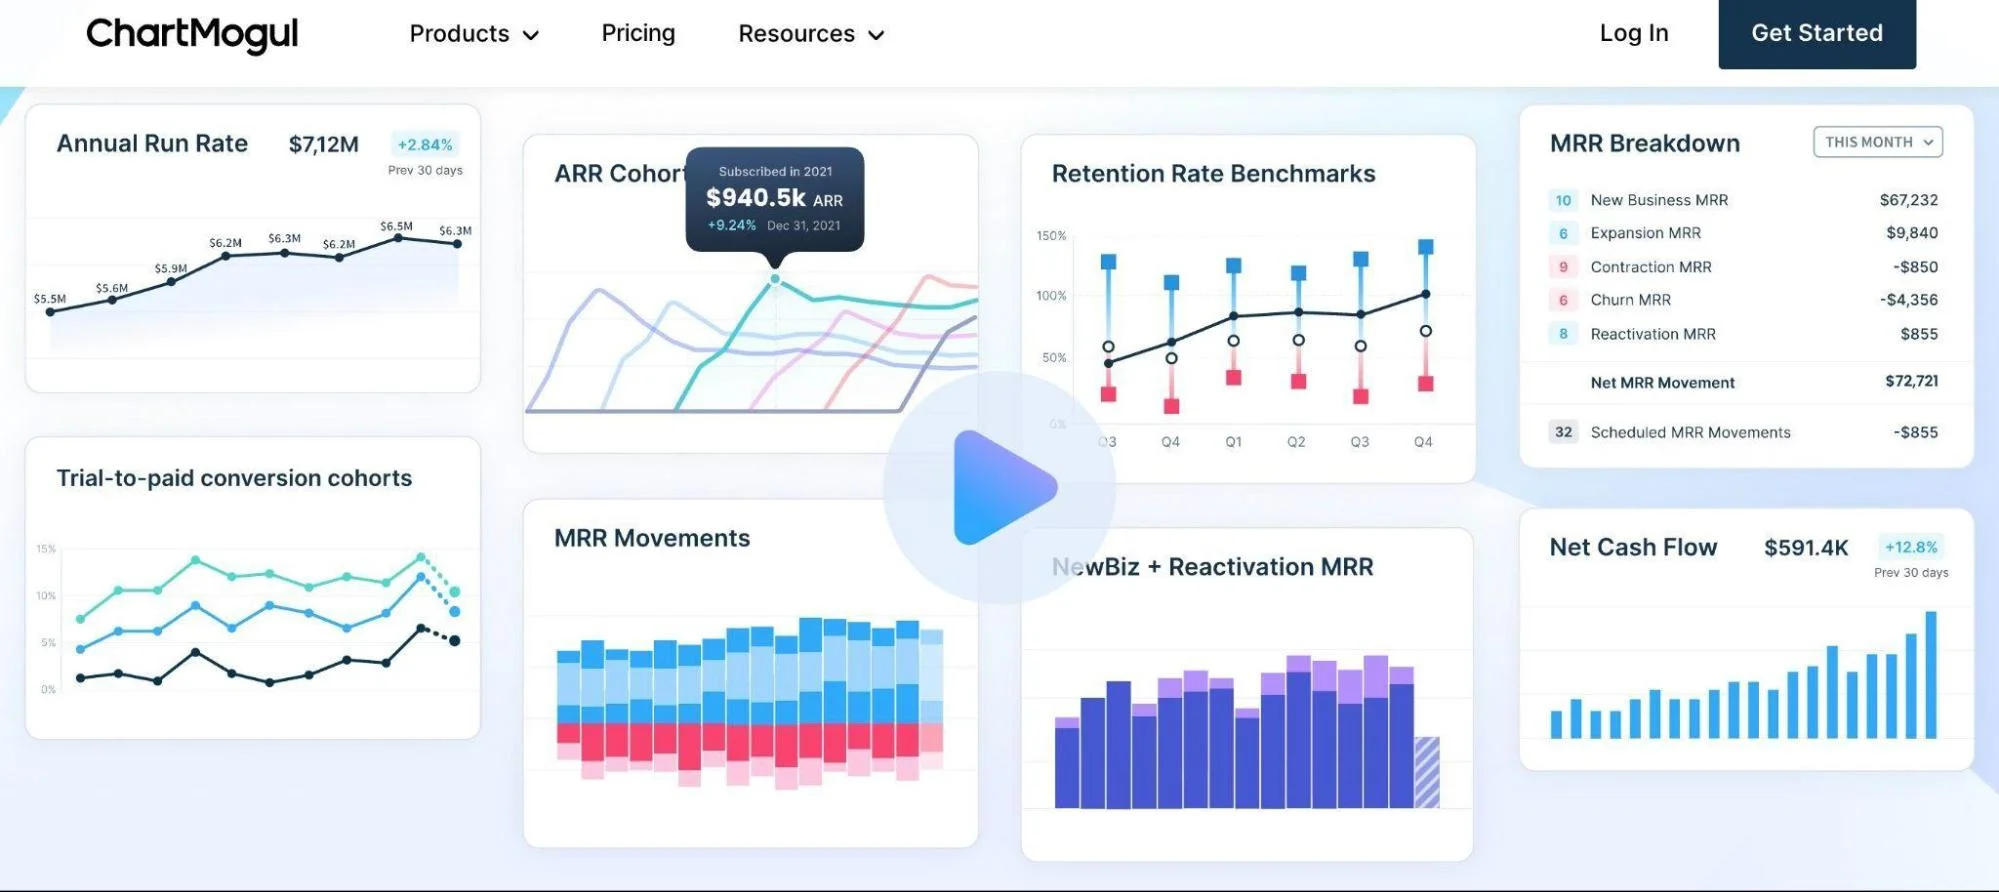
ChartMogul offers a straightforward platform that can help companies track a range of SaaS analytics. The easy-to-read dashboard, combined with clear charts, helps make this platform popular within the industry. The tool is specifically helpful for measuring SaaS metrics, such as the number of customers and churn rate.
Improving SaaS Unit Economics With Cloud Cost Intelligence
For SaaS businesses, cloud spend is a significant component of the cost per customer, and accurately identifying and measuring this metric is nearly impossible with traditional cloud cost management tools or those provided by cloud service providers. This is where a cloud cost intelligence platform like CloudZero comes in.
CloudZero can help your SaaS company map costs to specific products, features, teams, and more, as well as identify cost per customer. Now, picture this:
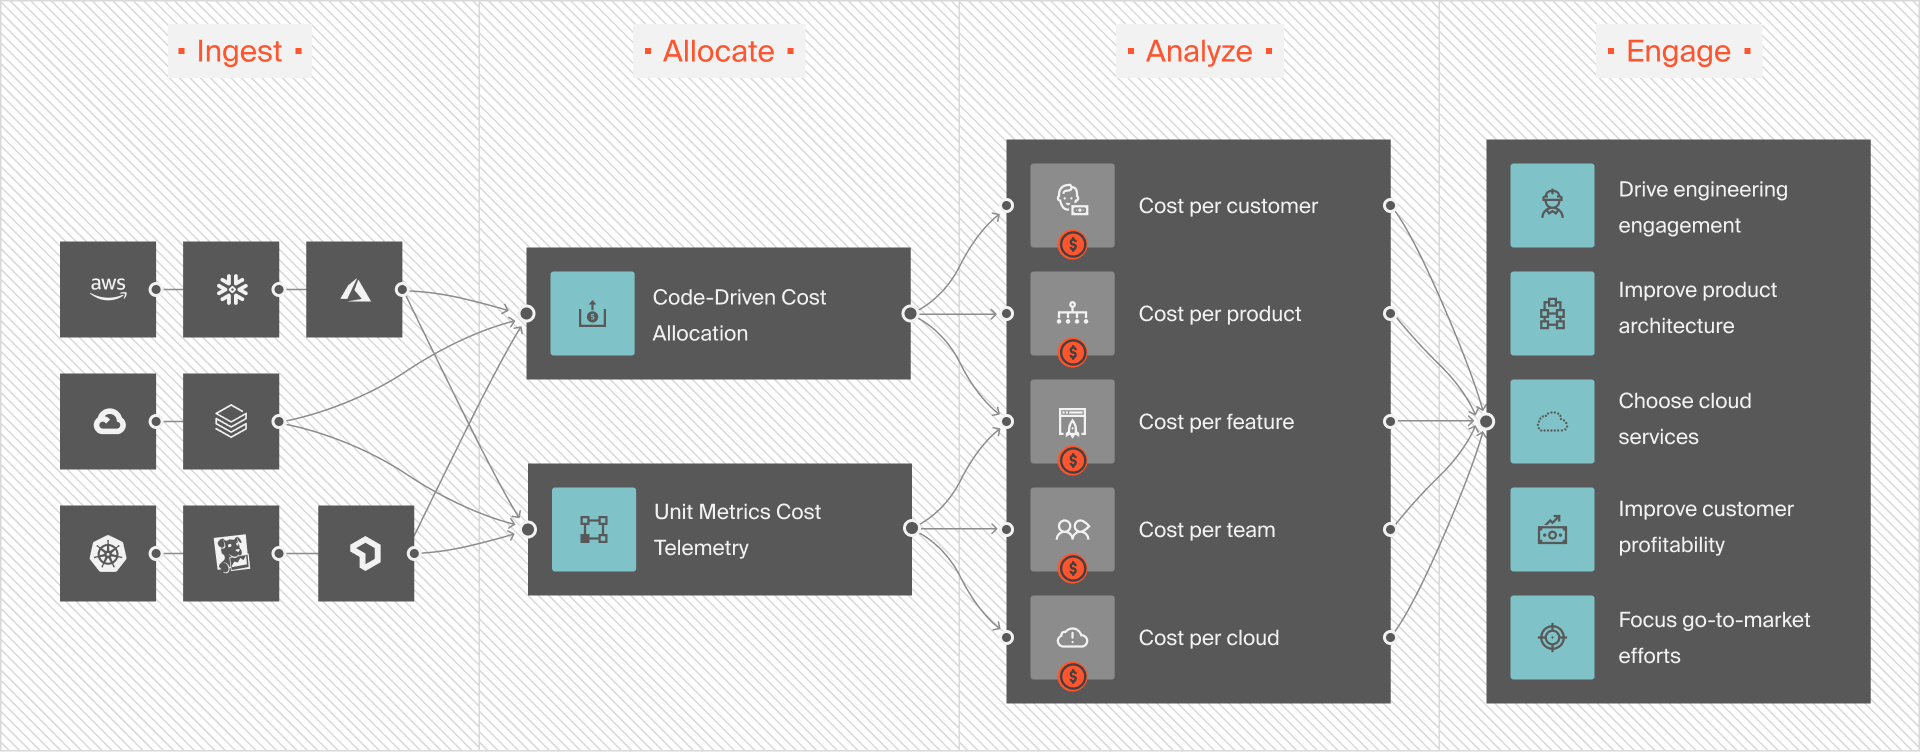
In addition, you can view costs from three perspectives:
- Engineering – cost per deployment, per feature, per team, per environment, per service, per project, and more.
- Finance – Cost per customer, per product or service, per project, per team, and more.
- FinOps – Cost of Goods Sold (COGS), gross margin analysis, profit, valuation, and more.
Using CloudZero, you can allocate 100% of your cloud spend in minutes to hours, track cost anomalies in real time, and create accurate budgets and forecasts.
These and more capabilities have helped customers like Drift, Remitly, Malwarebytes, and Upstart lower their annual cloud costs (Drift saved over $3 million) and understand exactly what is affecting their cloud costs — and why — and take action.
