
Downtime is brutally expensive and damaging. Enterprises can lose about $9,000 every minute systems are down, while smaller businesses lose hundreds of dollars per minute. A single outage can often cost over $100,000, and nearly a third of companies lose customers due to downtime.
That’s why many organizations turn to platforms like SolarWinds to maintain reliable systems and minimize the risk of costly disruptions.
In this guide, we’ll break down what SolarWinds is and its strengths to help you decide if it’s the right choice for your needs.
What Is SolarWinds?
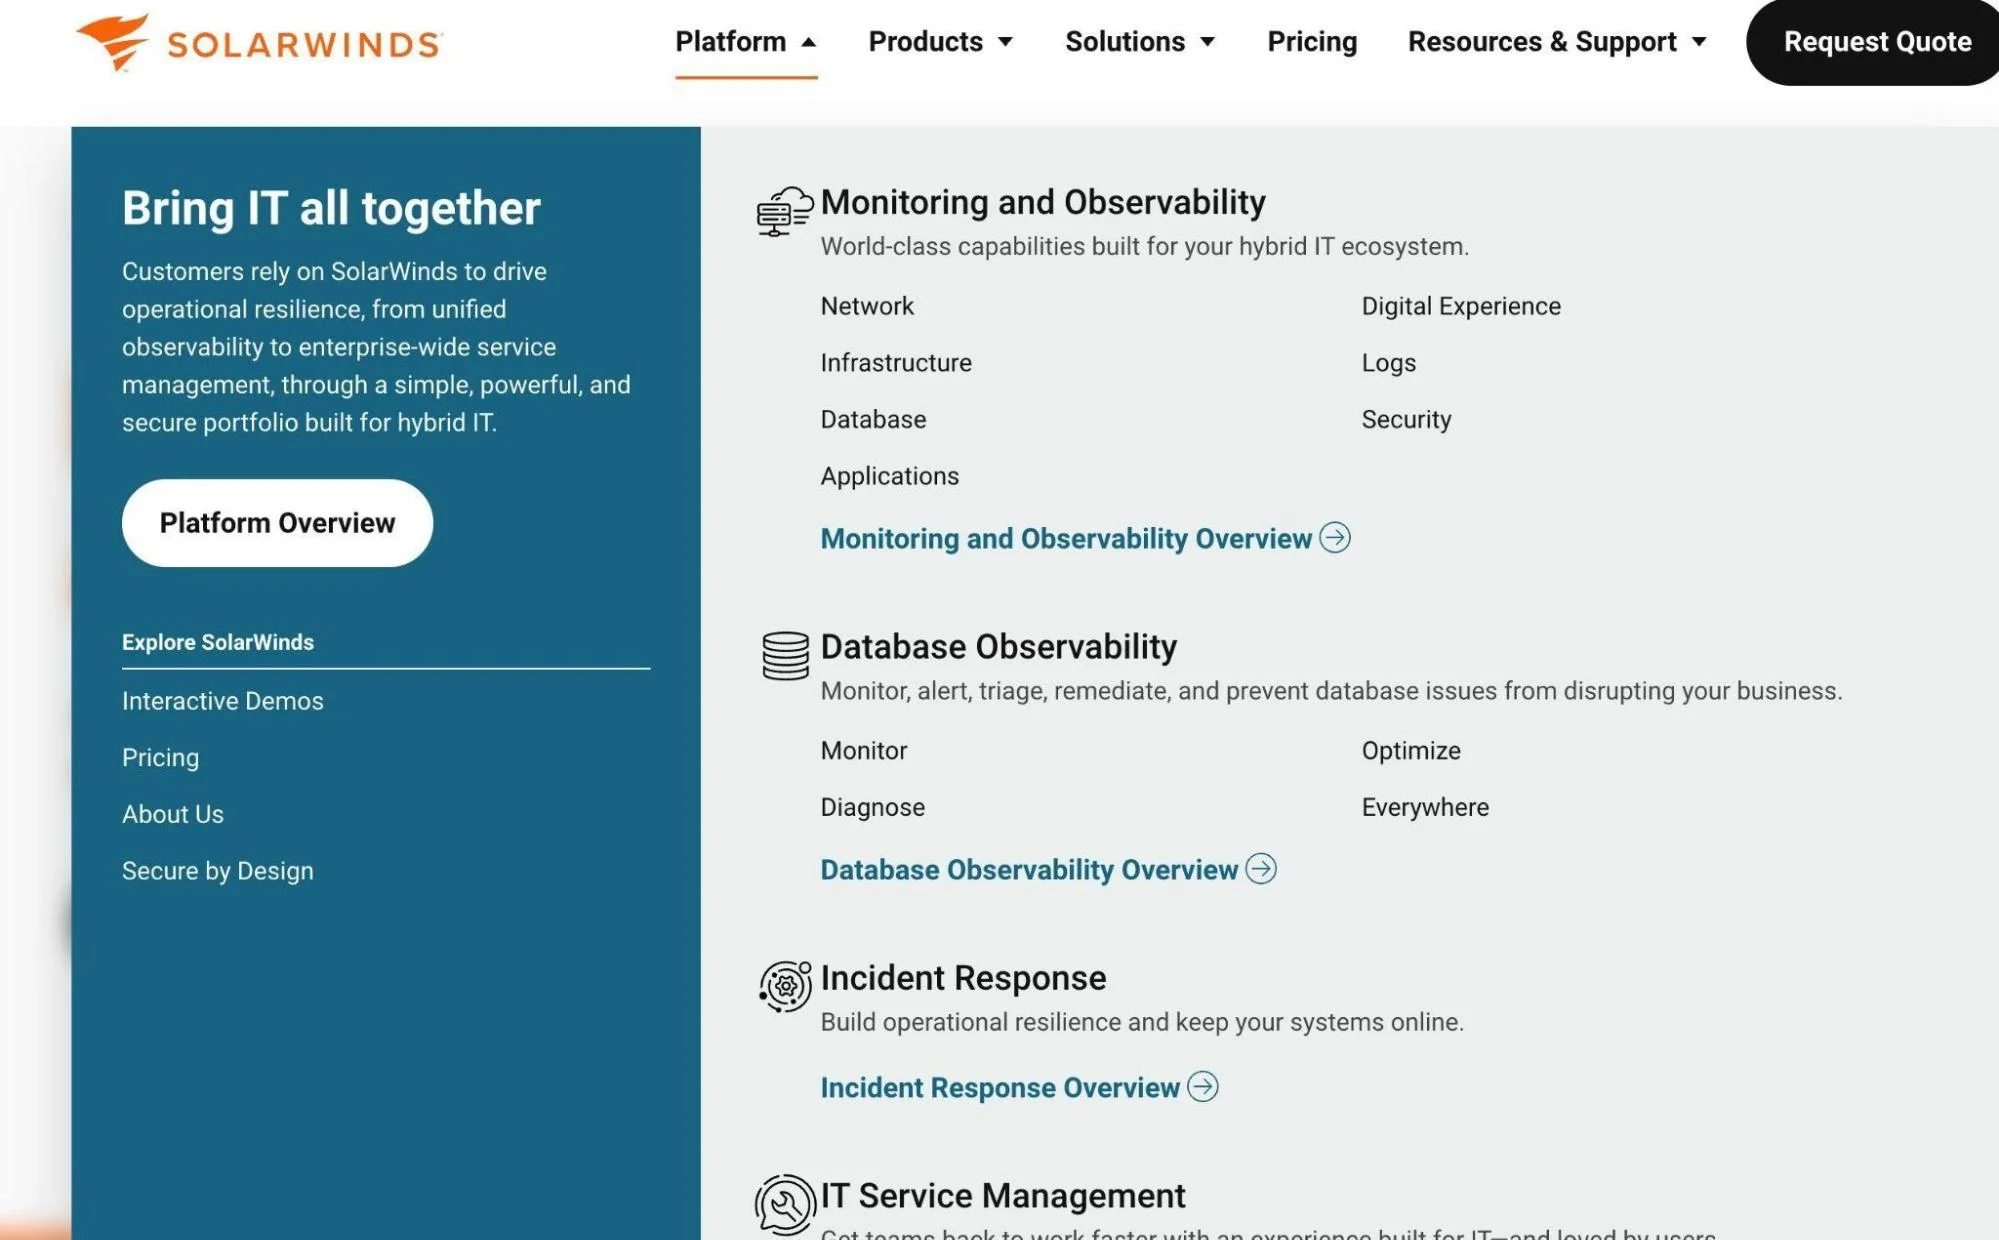
SolarWinds is a monitoring, observability, database, incident response, and IT service management platform — and one of the most widely used network monitoring software solutions in enterprise IT.
You can run SolarWinds on your own infrastructure or use it as a cloud service managed by SolarWinds. This provides teams with flexibility, depending on their specific security, compliance, or scaling needs.
SolarWinds is so widely adopted that it’s used by almost all Fortune 500 companies and many U.S. federal agencies.
Report
Finance needs to prove AI’s return: CloudZero report
260 senior finance leaders (more than half CFOs) told us why the speed of seeing AI spend, not the size of it, separates who pulls ahead on AI from who gets burned.
How Does SolarWinds Work?
The SolarWinds Platform (formerly known as Orion) serves as the foundation of SolarWinds monitoring. It serves as the central framework that brings together different modules, including network monitoring (NPM), server and application monitoring (SAM), and database performance tools. Everything is unified into a single web console with dashboards, alerts, reports, and role-based access.
At the heart of data collection are the polling engines. The primary polling engine is built in and continuously collects data from devices. Large environments can add Additional Polling Engines (APEs) to handle more load and extend coverage across multiple sites.
All monitoring data is stored in the database layer, which runs on Microsoft SQL Server. This database keeps metrics, configurations, and historical records. It powers reporting, trend analysis, and troubleshooting. For resilience, companies often pair it with SQL HA options since SolarWinds HA does not cover the database itself.
Users interact through the web console, a browser-based dashboard. It displays charts, alerts, and status updates in near real time, giving IT teams a clear view of infrastructure health.
SolarWinds also supports scaling and reliability options. High Availability (HA) provides failover for platform servers and polling engines. Additional Web Servers spread user access, boosting performance. For enterprises with multiple deployments, the Enterprise Operations Console (EOC) consolidates data into a single view.
SolarWinds Use Cases
Here are the main practical use cases of SolarWinds and why it matters in real operation:
Monitoring and observability
Network performance monitoring
When routers, switches, or firewalls start malfunctioning, outages occur quickly. SolarWinds NPM continuously watches those devices, detects packet loss, latency spikes, or interface errors, and alerts your team immediately. That means IT can intervene before people start calling the help desk.
Bandwidth and traffic analysis
Users complain that the network is slow, but what’s causing it? Using NetFlow Traffic Analyzer, SolarWinds identifies which applications, users, or protocols are consuming a significant amount of bandwidth. You can drill down into specific links or time windows to detect unexpected spikes or malicious traffic.
Hybrid-cloud bbservability
As workloads shift between on-premises and cloud environments, blind spots emerge. SolarWinds Hybrid Cloud Observability integrates AWS, Azure, GCP, and data center metrics into one view. IT can trace performance end-to-end, accelerating problem resolution and improving cloud governance.
Configuration management and compliance
A minor change in a router’s configuration can disrupt connectivity. SolarWinds NCM ensures device configs are backed up, tracks who changed what and when, and alerts you when a change deviates from your standard templates. That protects you from surprises and supports audits.
Incident response
Intelligent alerting
Too many alerts create noise and slow response. SolarWinds applies baselining and anomaly detection, highlighting only unusual behavior. This helps IT teams focus on real incidents, lowering false positives and reducing mean time to resolution (MTTR).
Security event correlation
Security breaches often hide in log data. SolarWinds SEM collects and correlates events, surfaces suspicious patterns, and supports automated responses or deeper investigations.
Database
Query and wait-time analysis
Slow databases cripple applications. SolarWinds DPA monitors query performance and wait times across SQL Server, Oracle, and MySQL. By surfacing the worst-performing queries, DBAs can tune workloads and deliver faster, more reliable applications.
Application-to-database correlation
It’s one thing to know the database is slow; it’s another to know which app action caused that. By integrating application metrics with database insights, SolarWinds lets you trace a slow user request back to a specific query or wait condition.
IT service management
ITIL-aligned service desk
Monitoring is one side — handling issues is another. SolarWinds Service Desk gives you incident, problem, change, and release management under one roof. Alerts from the monitoring side can feed into tickets, making workflows smoother.
Self-service portal and knowledge base
Many IT tickets are repetitive, such as password resets and common requests. SolarWinds provides a self-service portal and knowledge base. Users can find answers themselves, reducing load on your IT staff and speeding up resolution.
Now that we’ve looked at what SolarWinds is and what it does, the next step is to see how it supports the everyday workflows of cloud engineers.
How Cloud Engineers Use SolarWinds Today
Cloud engineering today is about automation, speed, and scale across hybrid and multi-cloud environments. Here is how SolarWinds supports these demands:
Validating Infrastructure as Code (IaC) deployments
Cloud engineers use Terraform, Ansible, or CloudFormation to build environments. SolarWinds steps in right after deployment, monitoring those resources to confirm they’re healthy and compliant. That post-deploy check keeps IaC runs from silently drifting off course.
Related read: Top Terraform Alternatives To Consider
Note: SolarWinds also supports monitoring across PaaS, SaaS, and Serverless (indirectly via integrations). CloudZero explains these models here.
Observing CI/CD deployments in real time
Every push to production carries risk. SolarWinds monitors test environments, short-lived containers, and new workloads as they go live. Engineers can spot performance regressions or runaway costs before they spread.
Related read: 50+ CI/CD Platforms To Streamline DevOps Workflows
Integrating cloud and on-premises systems
Most businesses still run hybrid. SolarWinds unifies data from legacy data centers and modern cloud-native services in one view. That visibility helps engineers follow issues across boundaries without losing time in silos.
Enforcing governance and reducing drift
Policies and baselines often erode under pressure. SolarWinds flags when configurations in cloud or network resources drift from standards and provides hooks for remediation. That lets engineers enforce governance without slowing delivery. Learn more about cloud governance here.
Right-sizing cloud resources
Auto-scaling isn’t perfect. SolarWinds displays actual usage for VMs, containers, and databases, allowing engineers to identify what’s oversized or underutilized. That evidence helps balance performance with cost efficiency.
Tracing incidents across the stack
When outages hit, minutes matter. SolarWinds consolidates signals from apps, databases, networks, and cloud providers into a single root-cause path. That shortens incident response and reduces the back-and-forth between teams.
Automating service desk tickets
When alerts are triggered, SolarWinds can automatically open tickets in the service desk. Engineers skip manual reporting and focus directly on resolution. This tightens the loop between monitoring and ITSM.
Supporting FinOps collaboration
Finance wants cost clarity, engineers want performance. SolarWinds surfaces granular usage data that FinOps teams can map to spend. This shared view aligns both sides and drives smarter resource decisions.
The Pros Of SolarWinds
The core strengths of SolarWinds include:
- Reliable network visibility. Quickly detects outages, slow links, and device failures. NetPath shows where traffic breaks down, even outside your network.
- Flexible deployment options. Run on-prem for control and compliance, or use SaaS to cut maintenance overhead.
- Safer configuration changes. Automatically backs up and tracks device configs. Reduces human error, eases audits, and allows quick rollbacks.
- Scales for large enterprises. Extra polling engines, web servers, and EOC make it fit for global, high-scale networks.
- Cloud and Kubernetes coverage. Monitors Kubernetes clusters and major cloud services alongside on-prem systems.
- Robust database support. Highlights slow queries and bottlenecks. Helps DBAs tune workloads and keep apps responsive.
- Ready-made templates and community. Ships with hundreds of monitoring templates, plus more from the THWACK community. This saves configuration time.
- One tool instead of many. Consolidates network, server, database, and log monitoring into a single platform.
The Cons Of SolarWinds
While SolarWinds offers robust features, it also has its limitations:
- Security history. The 2020 SUNBURST supply chain hack still shadows SolarWinds. Most regulatory cases have been resolved; however, customers must follow the hardening guides closely to minimize exposure.
- High cost at scale. SolarWinds can get expensive as you add devices, modules, and features. Licensing is node-based, so every device you monitor increases costs. Extra modules (such as NetFlow, Database Performance Analyzer, and Service Desk) are licensed separately. Large deployments often need Additional Polling Engines and High Availability licenses, adding to spend. SaaS pricing is subscription-based and may rise with data volume.
- Not a true AIOps platform. While SolarWinds SaaS offers anomaly detection, it lacks the advanced machine learning and predictive analytics that popular alternatives emphasize.
- Steep learning curve. The platform is powerful but complex. New admins often find the interface crowded, with many options and modules to configure before getting value. This makes SolarWinds less accessible than some competing IT monitoring tools.
- Windows-only servers. The main platform runs on Windows Server, which is not ideal for Linux-only shops.
- License server dependency. The main SolarWinds server manages licenses; extended downtime can cause issues.
- HA gaps. High Availability protects polling engines but not the SQL database. You must build SQL HA separately.
How Does SolarWinds Compare To Other Observability Platforms?
When comparing SolarWinds to its competitors, you don’t just line up features. You look at key decision factors that impact cost, usability, and fit.
Here’s a clear breakdown:
|
Competitor | Key Difference In Deployment | Where SolarWinds Wins | Where The Competitor Wins | Cost Angle |
| New Relic | SaaS only | Stronger in hybrid IT, network, and infrastructure | Robust in-app performance and cloud-native APM | SolarWinds: node-based + modules; New Relic: usage-based (data/users) |
| AppDynamics | Mostly SaaS | Broader infra + network visibility | Deeper transaction tracing and user experience | SolarWinds: modular licensing; AppDynamics: premium APM pricing |
Dat adog | SaaS-first | Ideal for device-level and hybrid environments | In containers, serverless, and DevOps toolchains | SolarWinds: predictable node licensing; Datadog pricing: usage-based, can spike with high data |
| Dynatrace | SaaS-managed | Strong in infrastructure and hybrid monitoring | AI-driven root cause, microservices, auto-instrumentation | SolarWinds: cheaper entry point; Dynatrace: premium but all-inclusive |
These observability platforms — and SolarWinds alternatives — help you understand performance, reliability, and scalability. But no matter which platform you choose, there’s always a common pain point: costs. And that’s where CloudZero comes in.
The Hidden Cost Of Observability And How CloudZero Can Help
Observability platforms generate vast amounts of data — logs, metrics, and traces. Collecting, storing, and indexing all of it consumes compute and storage resources. Agents, sidecars, and pipelines also consume CPU and memory. As workloads scale, these hidden overheads push cloud bills higher.
Running across AWS, Azure, and GCP also means duplicate pipelines and inconsistent tagging. This makes it challenging to identify which team, feature, or customer is actually driving costs.
You end up with great dashboards but no clear link between usage and spend.
CloudZero turns raw spend into unit economics. It maps costs to products, features, teams, or even Kubernetes pods, so engineering knows exactly what drives spend. It also flags anomalies early, helping teams cut waste and control the true price of observability.
 and step into a new era of cloud cost management with CloudZero.