
Microsoft Azure is the most popular cloud computing platform after Amazon Web Services (AWS). With over 200 services and resources available, there are plenty of ways to use Azure. This means the Azure public cloud allows hundreds, if not thousands, of unique configurations.
This flexibility is ideal for tailoring Azure to your workload’s requirements but also makes cloud management more challenging.
In this guide, we’ll cover the ins and outs of Azure monitoring, including why you should monitor your Azure costs, key considerations when choosing a monitoring tool, and the top Azure monitoring tools available today.
What Is Azure Monitoring?
In the Azure Cloud, monitoring involves capturing, analyzing, and interpreting metrics and logs generated by your Azure-based services, resources, and processes.
This is an essential cloud computing best practice that includes, among other aspects:
- Azure cloud cost monitoring
- Infrastructure monitoring
- Application performance monitoring
- Database monitoring
- Server monitoring
- End-user monitoring
It is crucial to monitor Azure for several reasons.
Report
Finance needs to prove AI’s return: CloudZero report
260 senior finance leaders (more than half CFOs) told us why the speed of seeing AI spend, not the size of it, separates who pulls ahead on AI from who gets burned.
Why Monitor Your Microsoft Azure Cloud?
Your Azure environment is constantly changing. Likewise, you need to continuously monitor your Azure infrastructure, applications, services, and more components to ensure their health and performance are optimal.
Monitoring Azure continuously has the following specific benefits:
- Analyze your resource consumption pattern to determine how to optimize your Azure costs.
- Analyze, interpret, and use Azure telemetry to make data-backed decisions — not speculative ones.
- Discover anomalies’ root causes so you can resolve them before they turn into costly problems.
- Optimize your Azure infrastructure, application performance, and dependencies by discovering and resolving bottlenecks.
These are just a few of the benefits of Azure monitoring. Yet, to achieve these goals, you need to implement and maintain best practices for Azure monitoring.
Effective Azure monitoring delivers four outcomes that compound over time. First, cost optimization: identifying idle resources, rightsizing underprovisioned or overprovisioned instances, and connecting cloud spend to business metrics like cost per customer or cost per deployment. Second, performance reliability: catching latency spikes, memory pressure, and network bottlenecks before they affect end users. Third, security posture: detecting configuration drift, unauthorized access patterns, and compliance gaps across subscriptions. Fourth, operational intelligence: building the data foundation for capacity planning, architecture decisions, and FinOps maturity.
The organizations that treat monitoring as a strategic capability rather than a checkbox tend to be the ones that scale cloud confidently without runaway bills.
10 Best Practices For Azure Monitoring Success
Azure monitoring best practices are a set of principles you should follow to maximize the effectiveness of your monitoring efforts. Here are some of the most important Azure monitoring best practices to deploy right away.
- Ensure end-to-end visibility into your Azure services, resources, and processes to reduce blindspots that could impact performance, security, and costs.
- Always aim to catch potential issues before customers report them.
- Continuously detect and diagnose issues across applications and their dependencies.
- Aim for as much granularity as possible, including measuring key performance indicators by user, team, location, environment, business unit, and project.
- Use metrics, traces, and events to detect anomalies and generate alerts. Then, the logs are analyzed to understand the problems more deeply.
- Release idle resources to save costs.
- Build custom dashboards based on your workload requirements to ease analyses.
- Set intelligent alerts and other automated actions for rapid auto-healing and high availability.
- Collect data from all Azure-monitored sources.
- Enable further automation by setting guidelines that utilize metrics to add resources as your load increases automatically.
See, it is nearly impossible to manage all your Azure cloud services manually. The task becomes even more challenging when you have dozens or thousands of dependencies to manage at any given moment.
To handle this complexity, choosing the right Azure monitoring tool is necessary.
How To Choose The Right Azure Monitoring Tool
These considerations will help you choose a monitoring tool that fits your needs in an Azure environment.
Understand your monitoring requirements
Determine if you need to monitor application performance, infrastructure, network traffic, or security. Then, identify how often you need data collection — real-time or periodic. It is also important to consider the scale of your Azure environment, from small to large enterprise-level cloud infrastructure.
Cost efficiency
Compare pricing plans of different tools to ensure the tool fits your budget without paying for features you may not use. Consider whether the tool has a free tier or offers flexible pricing based on usage.
Integration with existing systems
Ensure the monitoring tool integrates well with your existing Azure services and third-party tools. Choose a tool that supports automation for alerts, notifications, and resource scaling based on the collected data.
Scalability and flexibility
As your Azure infrastructure grows, the tool should scale accordingly without sacrificing performance. Additionally, consider if the tool is suitable for both cloud and hybrid environments.
Ease of use
Opt for tools with a clear, intuitive interface for effortless configuration and management. Tools offering customizable dashboards and reporting make it easier to track critical metrics.
Alerts and notifications
The tool should provide customizable alerts for key events or thresholds critical to your operations. Support for notifications through various channels, such as email, SMS, or third-party apps like Slack, is essential.
Security and Compliance
Ensure the tool meets your organization’s security needs, including encryption and identity management integration. If your industry requires compliance, ensure the tool supports relevant standards like GDPR, HIPAA, or SOC 2.
Using the right Azure monitoring tools for your workload enables you to monitor, interpret, and remedy issues before they disrupt your operations and undermine your SLAs.
What Are The Best Azure Monitoring Tools Right Now?
Here are more than two dozen of the best Azure monitoring tools you can integrate and use right away.
1. CloudZero – Unit cost monitoring and optimization for Azure Cloud
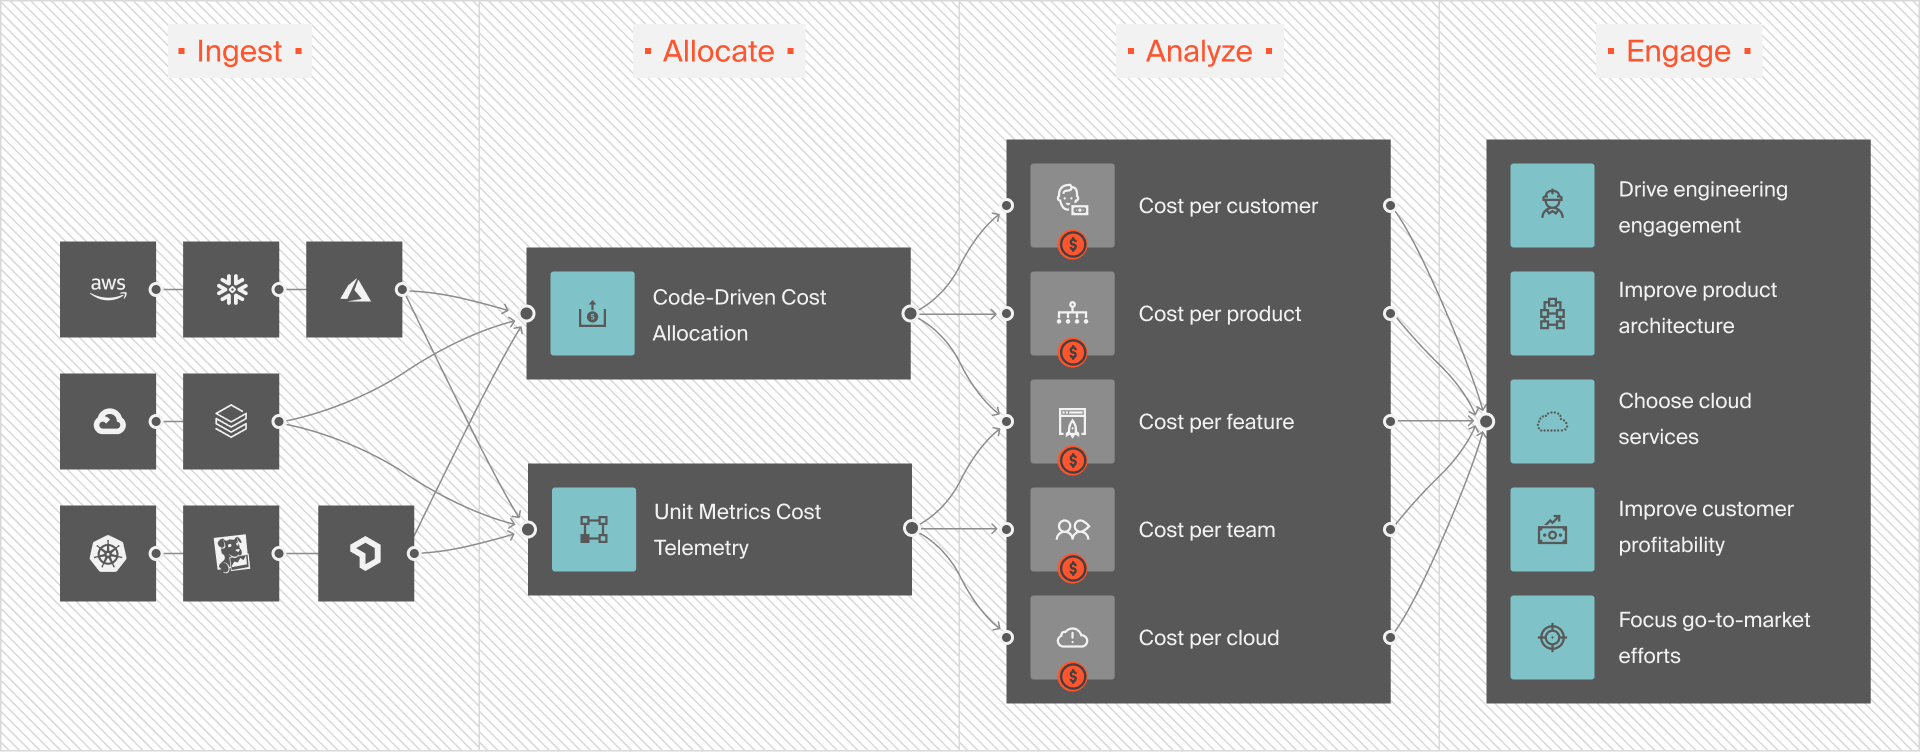
If you’re adopting a multi-service, best-of-breed cloud strategy rather than a mere multi-cloud deployment, CloudZero supports cost monitoring in virtually any cloud or software spend.
You can now combine, interpret, and understand your unit economics across Microsoft Azure, AWS, and Google Cloud Platform (GCP) — along with software, from New Relic and Databricks to MongoDB and Snowflake.
The CloudZero platform:
- Offers easy setup for the most popular cloud providers and allows you to build your own adapters.
- CloudZero shows you who, why, and what is driving your Azure costs. It does this by transforming telemetry into actionable business dimensions you actually care about, like cost per customer, cost per software feature, and cost per team.
- Accurately maps Azure, AWS, GCP, Kubernetes, and Snowflake costs to the people, processes, and products that generated them. No tagging is required.
- Measures SaaS cost of goods sold (COGS) in an easy-to-digest, granular, and actionable format.
- Aligns engineering, finance, FinOps, and management teams around a common cost language, cost-conscious, and continuous cost optimization culture.
- Empowers engineers to see the cost impact of their technical choices, enabling them to find more cost-efficient solutions without hurting velocity or innovation.
The CloudZero platform also offers budgeting and forecasting, real-time cost anomaly detection, and more.
Best for: Organizations that want to connect Azure costs to business outcomes (cost per customer, cost per feature) rather than just tracking raw spend.
 to see how CloudZero customers are optimizing their Azure costs without endless tagging.
2. Azure Monitor – Infrastructure, app, and network monitoring for Azure
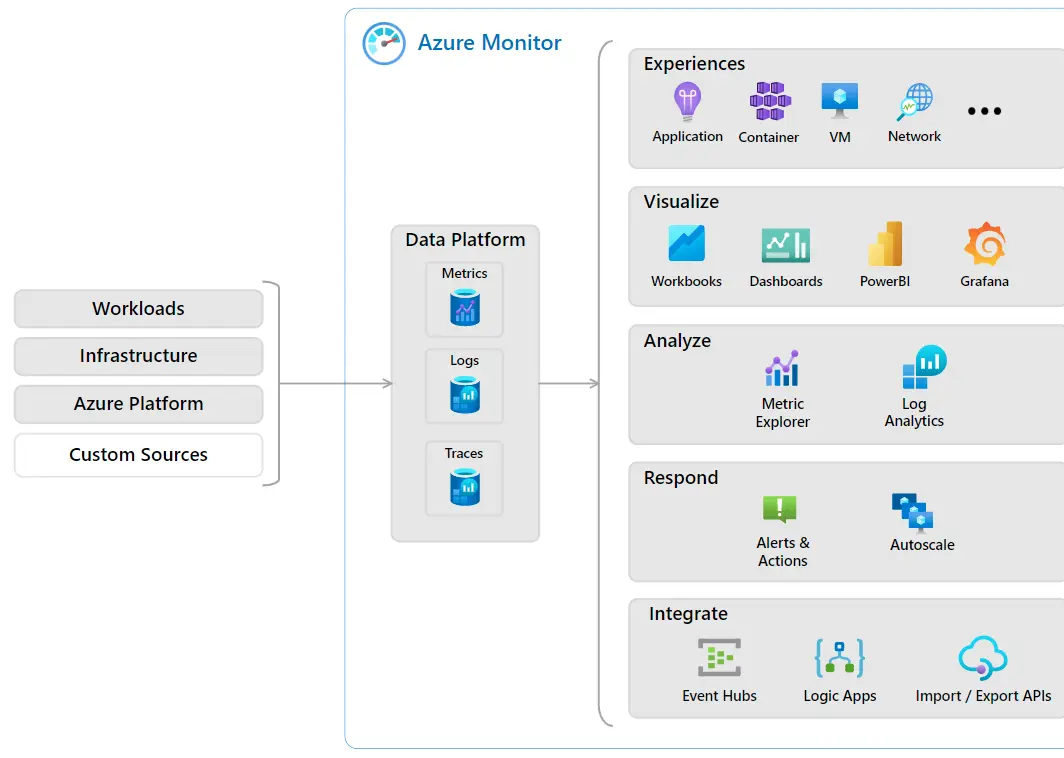
Azure Monitor is Microsoft’s native monitoring tool designed to help you continuously monitor your Azure public cloud infrastructure, applications, and network. It does this by analyzing metrics and logs. The tool stores metrics as numerical data in a standardized structure, unlike log data, which is stored in a variety of types, each with a unique structure. Thus, Azure Monitor Logs uses queries to analyze data.
Azure typically consists of virtual machines (VMs), application components, databases, networking, and web services. To ensure high availability, optimal performance, and seamless customer experience, Azure Monitor tracks the performance and overall health of these system components at all times.
To accomplish this, Azure Monitor works with other native monitoring tools, including Azure Advisor, Azure Application Insights, and:
- Application Insights – Detects and diagnoses incidents across apps and dependencies.
- VM insights and Container insights – Identify infrastructure issues with metrics and logs.
- Log Analytics – Get deeper insight from your log data to troubleshoot issues fast.
- Automated actions – Run cloud and on-premises operations at scale with less manual labor.
- Azure dashboards and workbooks – Visualize the health of your infrastructure, app, and networking components in a single platform for easier analysis.
- Azure Monitor Metrics – Gather and analyze metrics data from many Azure resources, such as Azure Backup, Azure Cosmos DB Insights, and Azure IoT Edge.
- Change Analysis – Examine change data for ongoing monitoring or incident management.
One more thing. You can also use Azure Monitor to track your AWS and Azure resources in one place, making it ideal for an Azure-AWS hybrid cloud setup.
Moreover, Azure Monitor integrates with many other tools, enabling you to link your favorite tools, from Grafana (data visualization) and JIRA (alerts and team collaboration) to CloudZero (modern cloud cost monitoring) and PagerDuty (incident management).
Best for: Azure-native organizations that want deep infrastructure and application monitoring without adding external dependencies.
3. Turbo360 – Azure cost monitoring and management platform
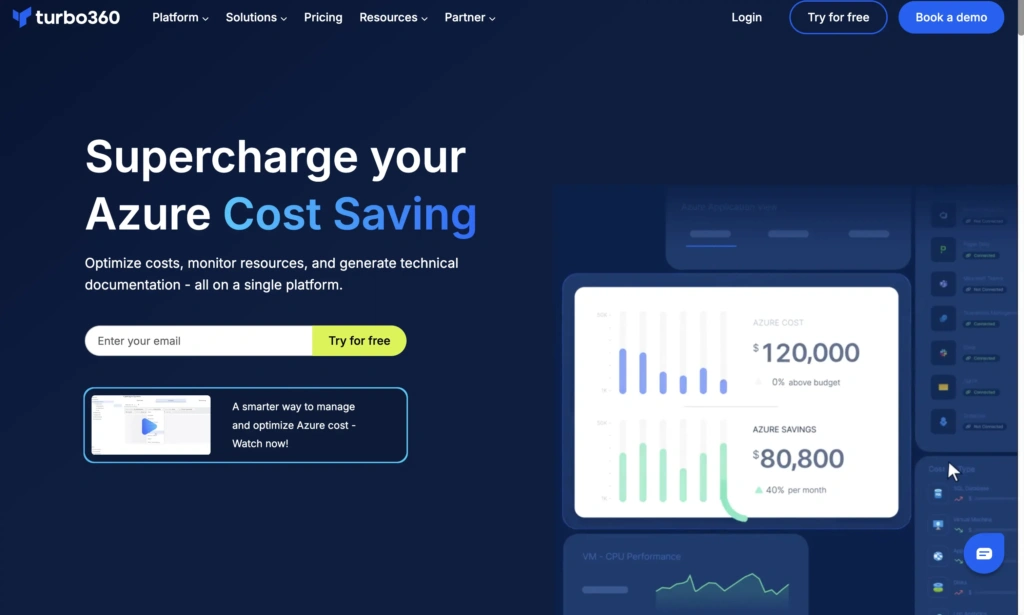
Turbo360 aims to provide end-to-end Azure monitoring. For this purpose, it offers a set of monitoring tools to track and interpret your Azure health and performance data. It also applies business process mapping across your Azure subscriptions.
This means you can conveniently monitor multiple Azure services in a single tool, including combinations of services and other platforms. Turbo360 comes as a SaaS package, a virtual machine for on-premises deployment, or an Azure cloud service.
Best for: Teams running complex Azure integration workflows (Service Bus, Logic Apps) that need deeper visibility than Azure Monitor provides.
4. SolarWinds Observability — Infrastructure and Application Monitoring
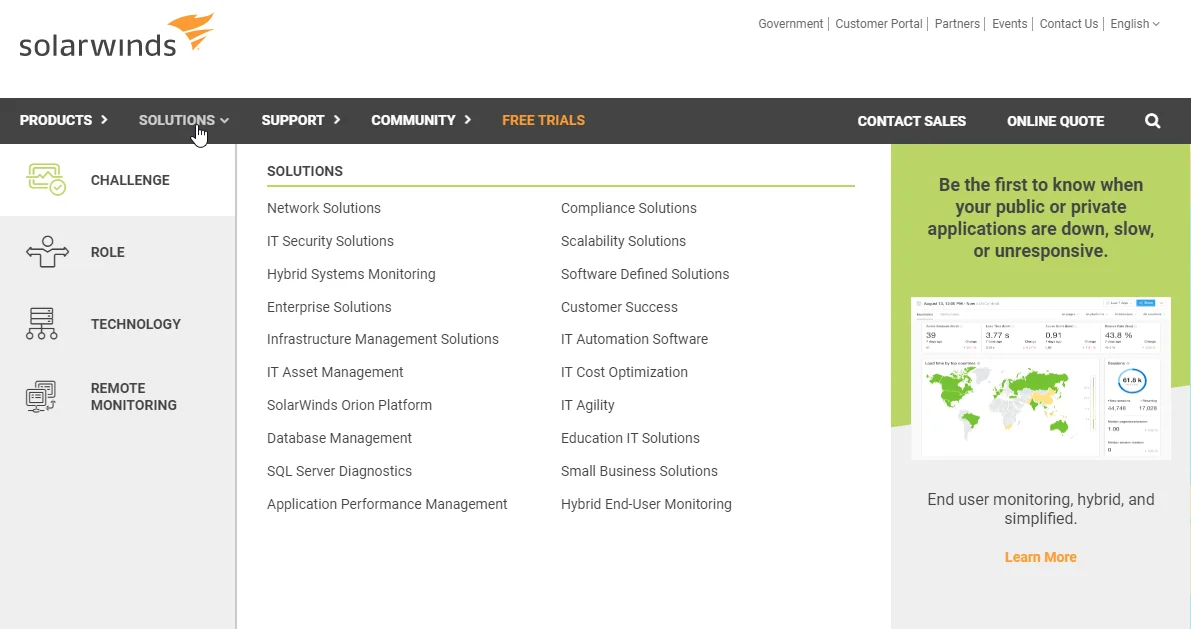
SolarWinds Observability (successor to the retired AppOptics platform, which reached end of service in January 2026) provides server, application, and database monitoring. The platform offers distributed tracing, host and container metrics, and custom dashboards.
SolarWinds is well-established in enterprise IT environments and offers on-premises deployment options alongside SaaS. Its strength lies in traditional infrastructure monitoring, particularly for organizations with hybrid or on-premises-plus-Azure environments.
Best for: Enterprise IT teams with hybrid infrastructure who need a single platform spanning on-premises and Azure.
5. New Relic – Enterprise Azure applications monitoring
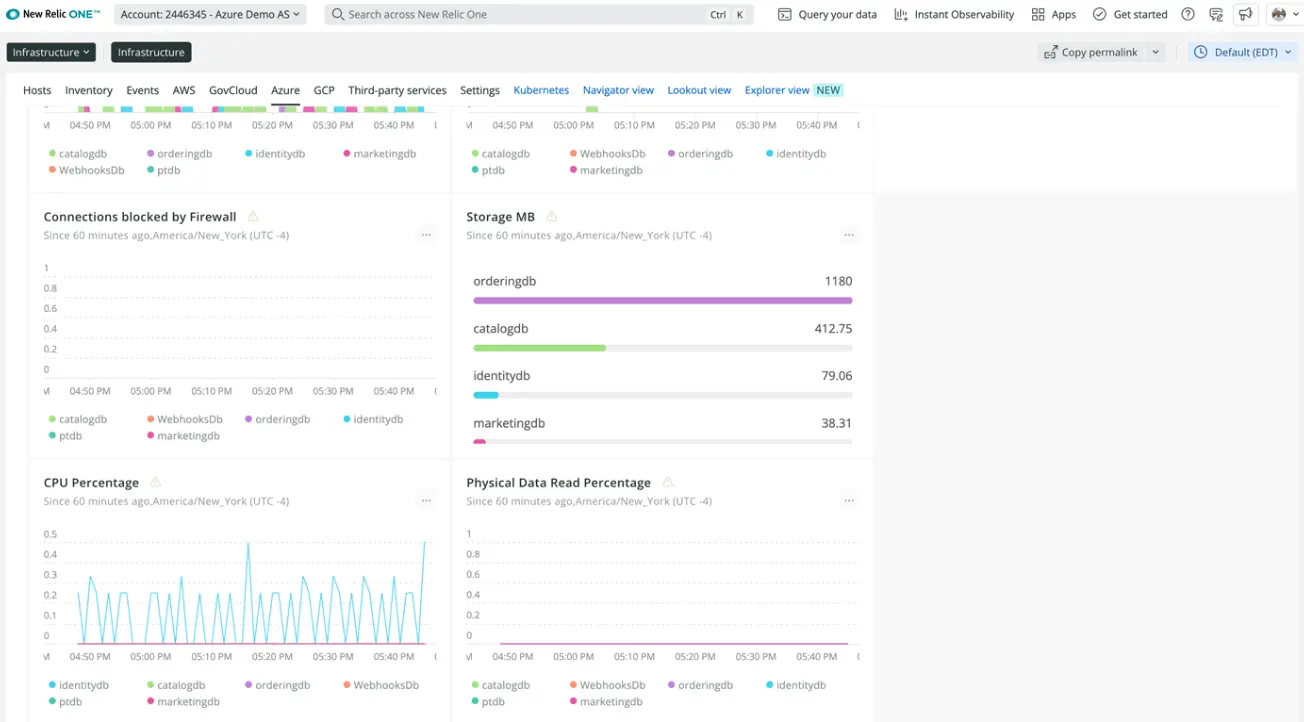
New Relic’s Azure monitor runs natively in the Azure public cloud. The platform focuses on quickly identifying, triaging, and delegating infrastructure and app issues among ITOps and developers. Once you activate your New Relic integration, the tool queries your Azure platform services based on a predefined polling interval.
But note that New Relic does not collect monitoring data for resources in Azure Government or those you created using the classic deployment model.
Best for: Engineering teams that want a single observability platform with transparent, consumption-based pricing.
6. Sematext – Monitor Azure along with on-premise and other cloud environments
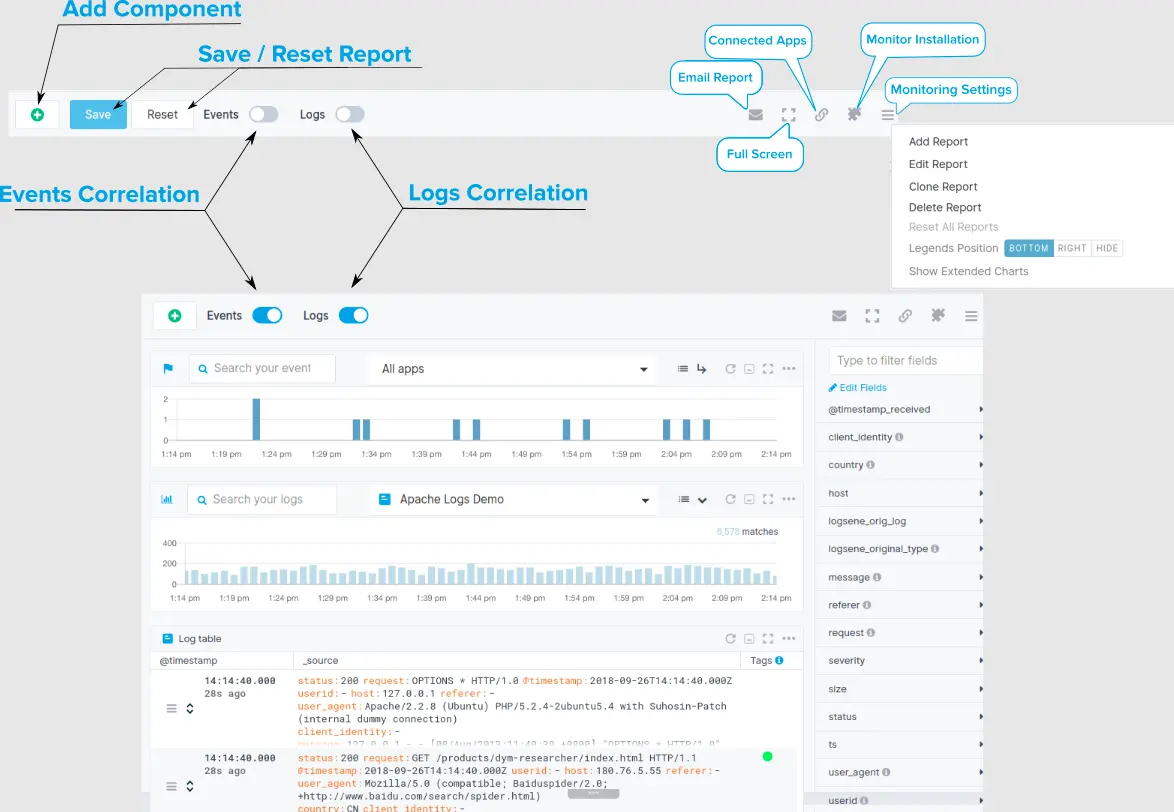
Sematext is a real-time Azure metrics, events, and logs monitoring platform for enterprises. Once you install the Sematext Agent in your Azure cloud, it’ll monitor multiple Linux infrastructure metrics, including CPU, disk utilization, memory, package inventory, and events.
To get started, Sematext provides dashboard templates, a split screen function for comparisons, and an alert management feature to quickly notify engineers of critical issues. Better yet, Sematext Monitoring covers containers, databases, transaction tracing, servers, and inventory monitoring.
Best for: Multi-cloud teams that need monitoring and log management without enterprise-scale pricing.
7. Paessler PRTG – Azure virtual machines monitoring and security
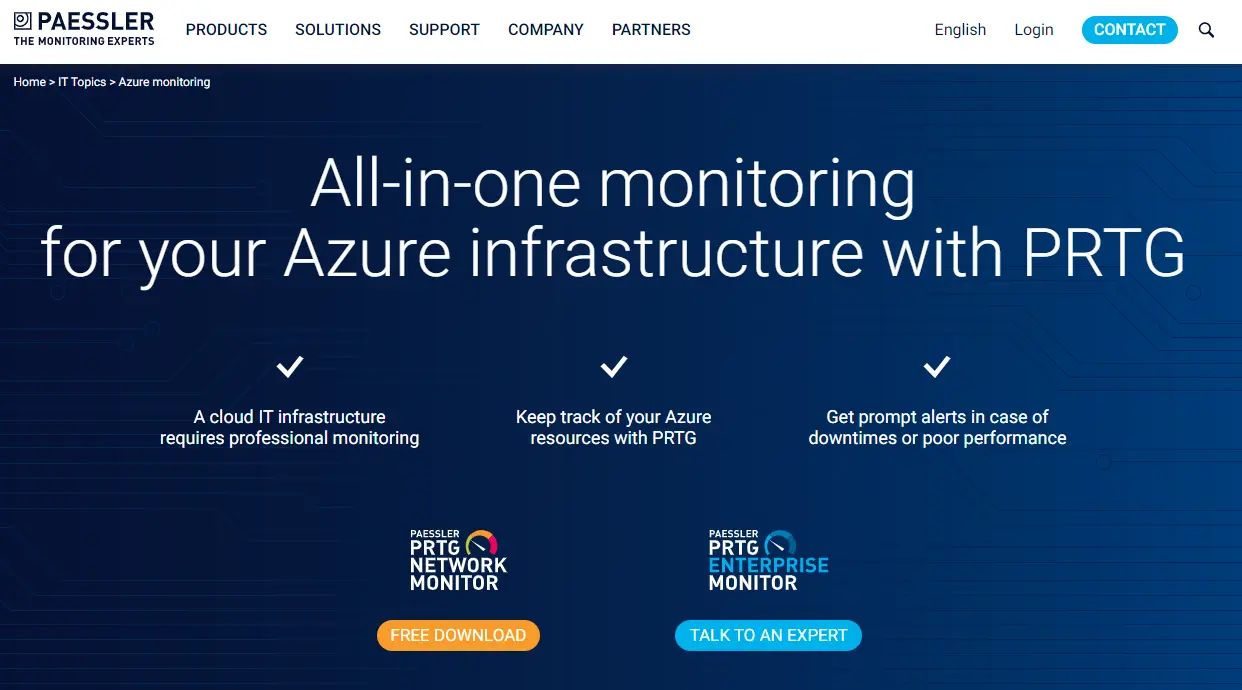
This platform aims to be your all-in-one Azure monitoring tool. As one example, the Microsoft Azure Virtual Machine sensor tracks the status of all Azure VMs in your Microsoft Azure account and reports CPU utilization for both used and remaining CPU credits. Its partner, AutomonX, distributes a suite of 18 Microsoft Azure sensors for PRTG.
You connect them to your Azure management environment using REST API, empowering you to collect metric values and other metadata. In addition, it reports relevant metrics to PRTG, providing custom error limits in a form that the EXE/Script Advanced sensor can understand.
Monitoring your Microsoft Azure cloud with PRTG is also possible on the go using its mobile tools.
Best for: IT teams with strong network monitoring requirements across hybrid Azure and on-premises environments.
8. AppDynamics (Cisco Splunk Observability) — Application Performance Monitoring
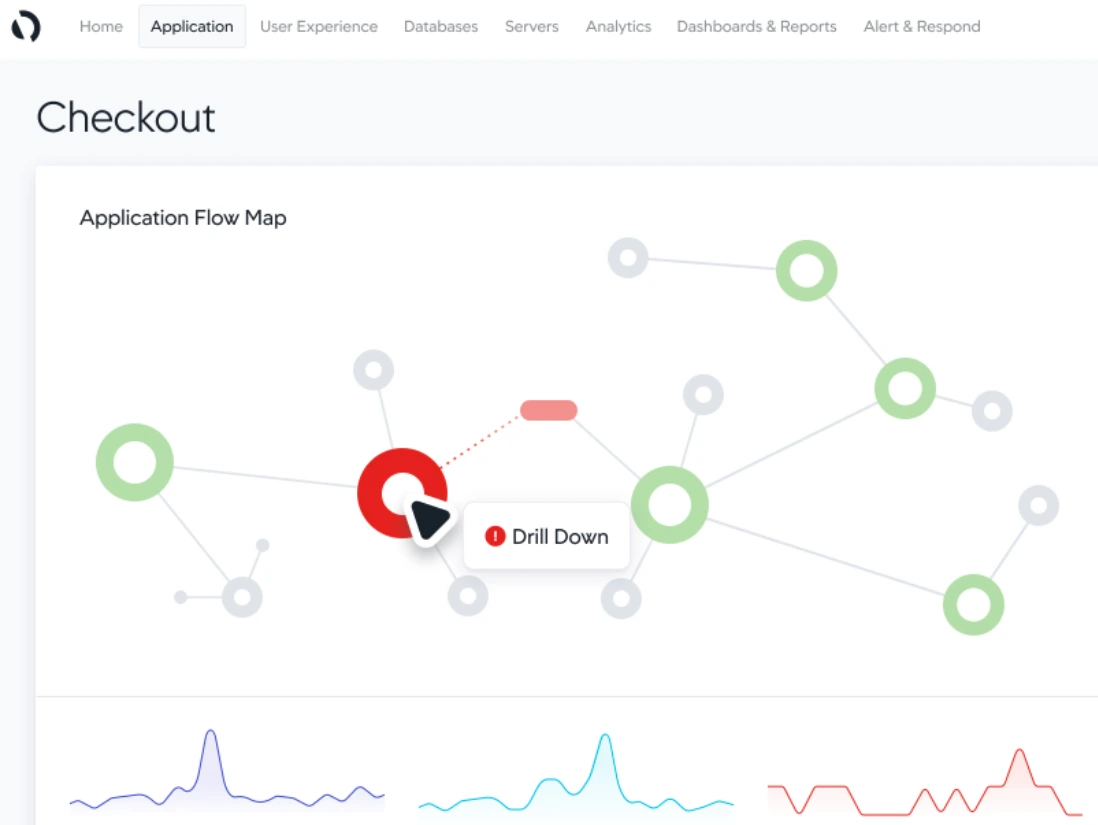
AppDynamics, now part of the Cisco Splunk Observability portfolio following Cisco’s $28 billion acquisition of Splunk in March 2024, provides deep APM with automatic application topology mapping, business transaction correlation, and real-time diagnostics.
The platform’s AI-powered root cause analysis and business-level performance correlation make it particularly suited for organizations running business-critical applications on Azure where application performance directly impacts revenue.
Best for: Large enterprises running revenue-critical applications on Azure that need business-correlated APM.
9. Site24X7 – Monitoring with Azure performance forecasting
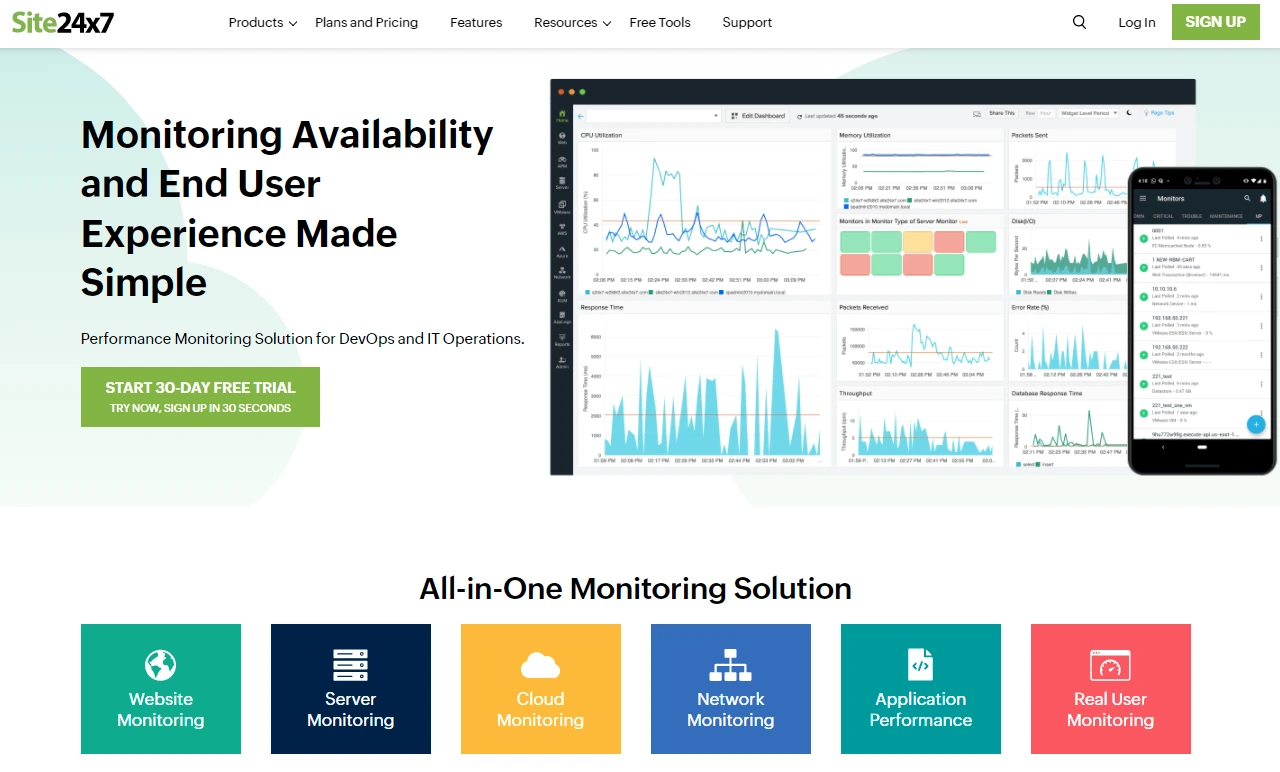
Site24X7 is an all-in-one, AI-powered monitoring service that integrates seamlessly into an Azure environment. Its monitoring capabilities cover over 100 Azure cloud services and resources. That means you can observe and measure the performance of your IaaS services, including VMs and Kubernetes.
You can also monitor your PaaS services, such as Event Hubs, SQL database, and App Service. The platform also lets you use historical data, machine learning models, and conventional time series forecasting approaches, like exponential smoothing, to forecast Azure performance patterns for resources like VMs, Databases, Sites, and App Service Plans.
Best for: Mid-market teams looking for an affordable, all-in-one monitoring platform with predictive capabilities.
10. LogicMonitor – Azure resource performance monitoring
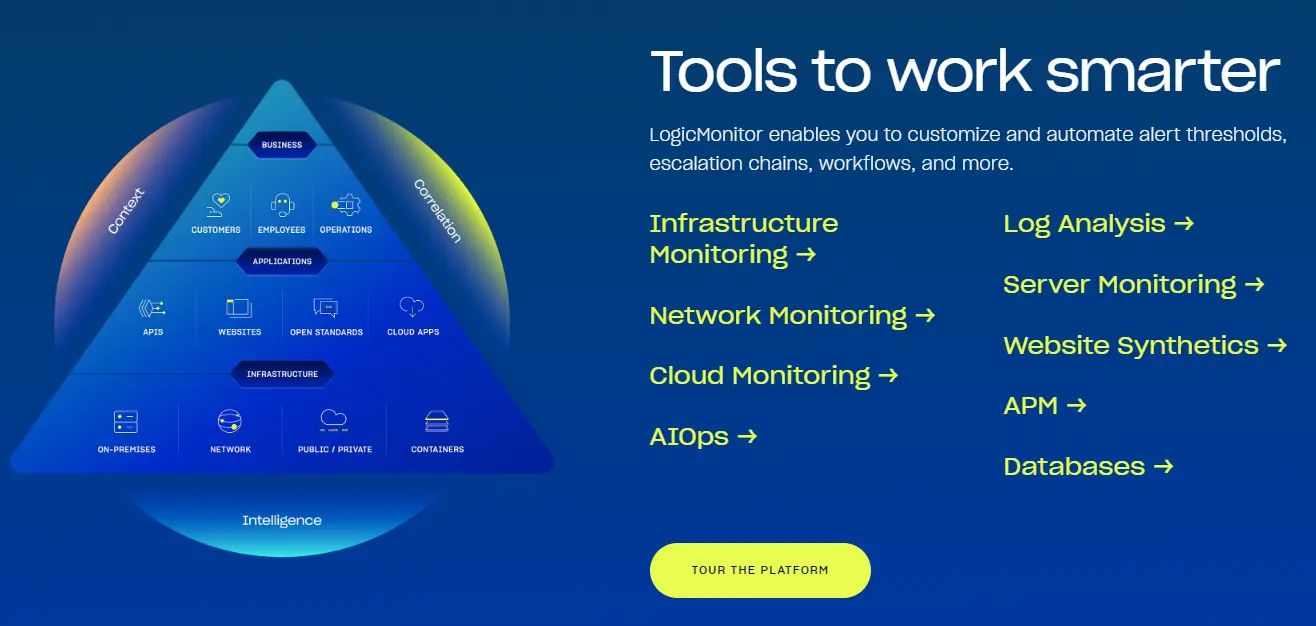
LogicMonitor supports monitoring Azure metrics. You’ll need to install a collector on a server or VM in your Azure instance to use LogicModules out-of-the-box to monitor your Azure-hosted infrastructure metrics. You’ll be able to build out custom dashboards to visualize, analyze, and understand your IT operations data.
Its Service Limits Utilization for VMs, storage, network, and other resources alerts you when you near Azure limits you’ve pre-configured. Then, you can request service limit increases to ensure your infrastructure and application components remain highly available.
Following its acquisition of Catchpoint in December 2025, LogicMonitor now extends into internet performance monitoring and positions itself around predictive visibility and AIOps capabilities.
Best for: IT teams and MSPs that want auto-discovering, agentless Azure monitoring with minimal setup.
11. BMC Helix Operations Management — Enterprise Event Management
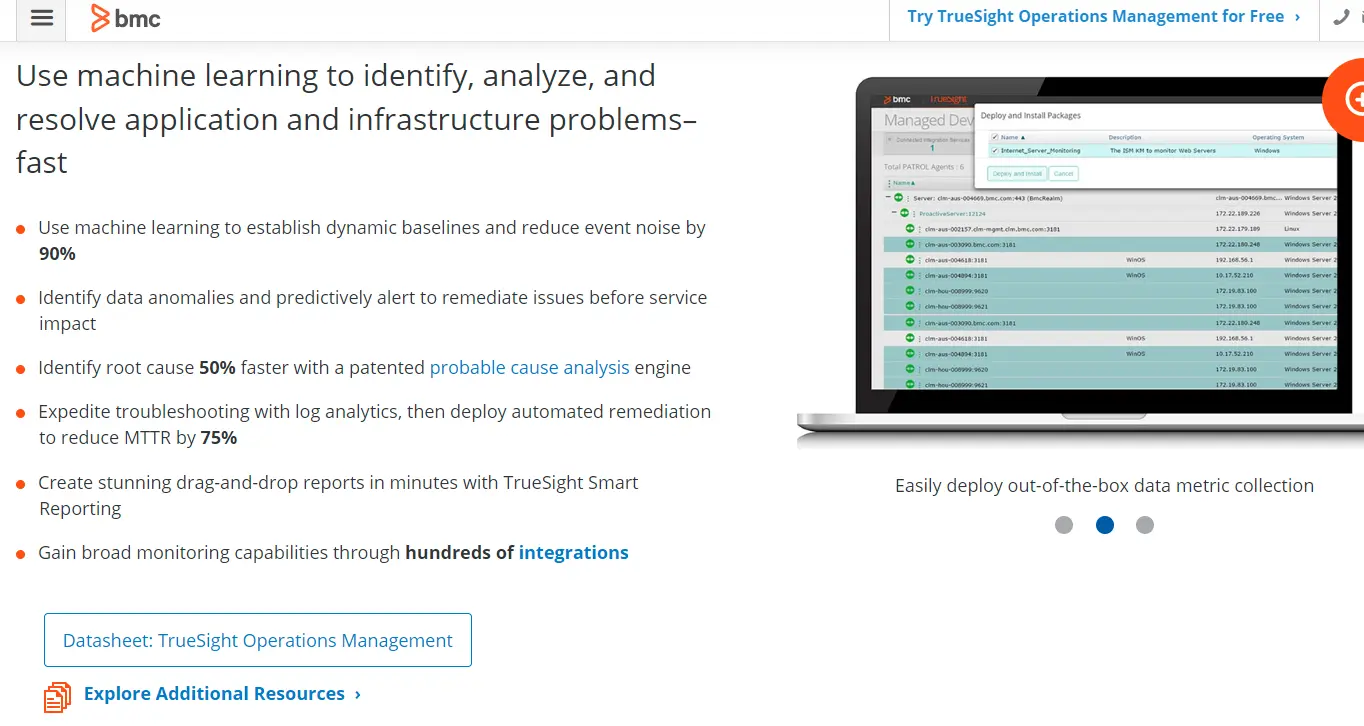
BMC Helix Operations Management (successor to the discontinued BMC TrueSight platform) provides event management, predictive alerting, and AIOps capabilities for enterprise Azure environments. BMC Helix was spun off as an independent company from BMC Software in October 2024.
The platform integrates with BMC Helix ITSM for end-to-end incident management workflows and is designed for large-scale, multi-cloud enterprise environments with complex ITSM requirements.
Best for: Large enterprises with existing BMC ITSM investments that need integrated Azure monitoring and event management.
12. Cerebrata – Azure cloud management for developers
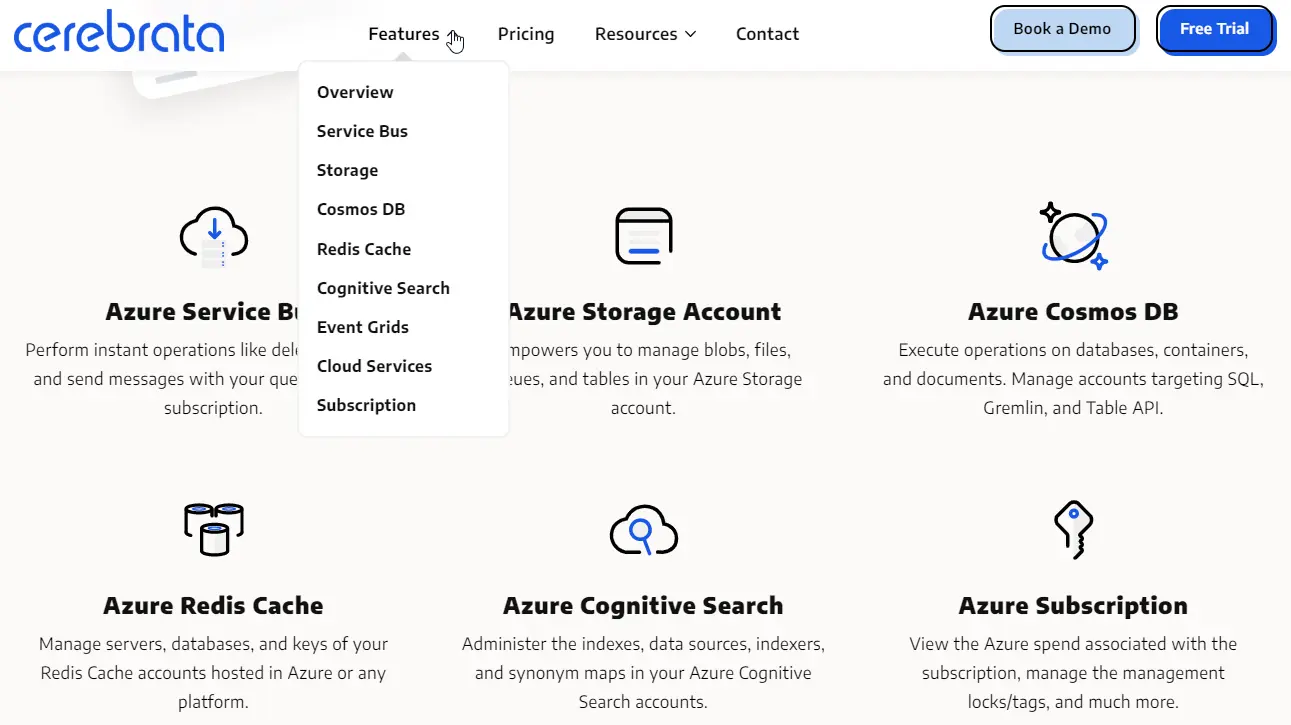
Perhaps you want to monitor and respond to changes in your Azure cloud from Linux, Windows, or macOS environments. Maybe you want a tool that integrates all your favorite Azure explorers using a single interface.
With Cerebrata, developers can do this securely and code-free. For example, the Azure Service Bus enables you to collect details on messaging issues. You can also resubmit messages from one queue to another, improving your Azure Service Bus management. Besides monitoring your Azure resources, you can also perform tasks like migrations and data cleanups with it.
Best for: Developers who need a visual desktop tool for managing Azure Storage, Service Bus, and Cosmos DB resources.
13. Dynatrace – Fully automated Azure monitoring
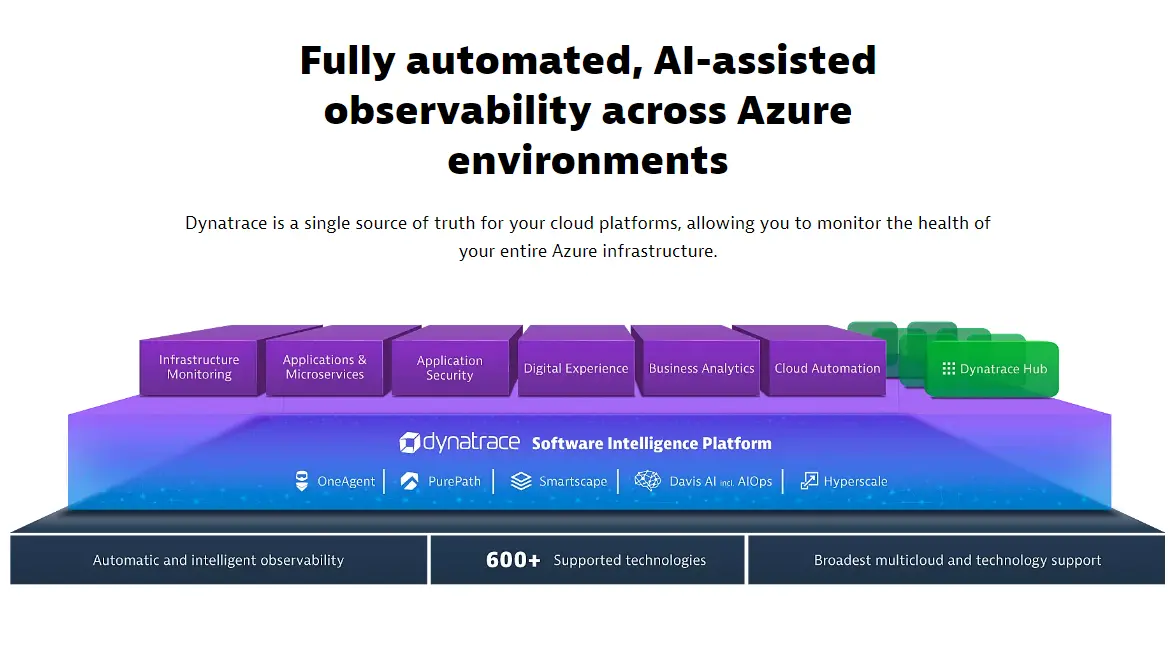
Dynatrace aims to be the end-to-end Azure monitoring platform by providing tools to track the health of your Azure VMs, containers, servers, networks, devices, etc., with metrics, events, and logs. Its AI-powered monitoring engine can continuously analyze billions of dependencies, making the tool ideal for monitoring enterprise environments in Azure — at scale.
Best for: Enterprise teams that want automated, AI-driven observability with minimal manual instrumentation.
14. Broadcom DX Unified Infrastructure Management — Legacy Infrastructure Monitoring

DX Unified Infrastructure Management (formerly CA UIM, rebranded under Broadcom) provides infrastructure monitoring for Azure alongside physical, virtual, and containerized environments. Versions 20.4 and older reached end of support in November 2025; the current version is 23.4.
The platform is primarily relevant for organizations with existing Broadcom infrastructure management investments. Teams evaluating new monitoring deployments may want to consider more modern alternatives.
Best for: Organizations with existing Broadcom/CA infrastructure management investments extending into Azure.
15. DataDog – SaaS-based Azure monitoring tool
With DataDog, you can monitor a variety of infrastructure, application, and system security components for issues and optimization opportunities.
The platform built its tools to scale at the speed of your Azure environment, continuously tracking, analyzing, and reporting any issues in a dynamic environment before they significantly affect customer experience. It supports advanced root cause analysis and real user monitoring.
Best for: Engineering teams that want comprehensive, SaaS-based observability with broad Azure integration coverage.
16. eG Innovations – Azure virtual desktop monitoring
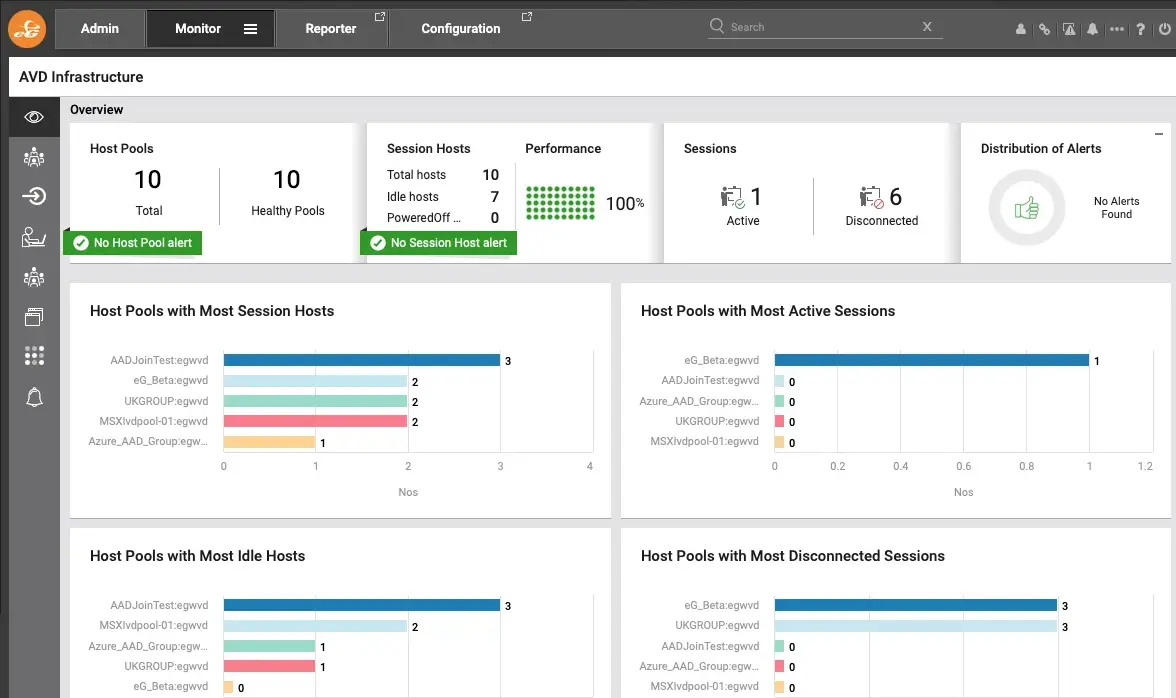
This platform provides Azure cloud, on-premises, and hybrid IT infrastructure monitoring. EG Innovations merges application and infrastructure health monitoring to provide complete visibility across all IT layers and tiers—spanning application code and bare metal, user experience and business transactions, network and cloud, and virtualization and storage.
The tool delivers by revealing deep availability metrics, performance insights, and resource utilization patterns. You can then use its historical analyses to pinpoint and fix operational issues that may negatively affect your business.
Best for: Organizations running Azure Virtual Desktop or Citrix environments that need deep, specialized monitoring.
17. Splunk (Cisco) — Full-Stack Monitoring and Security Analytics
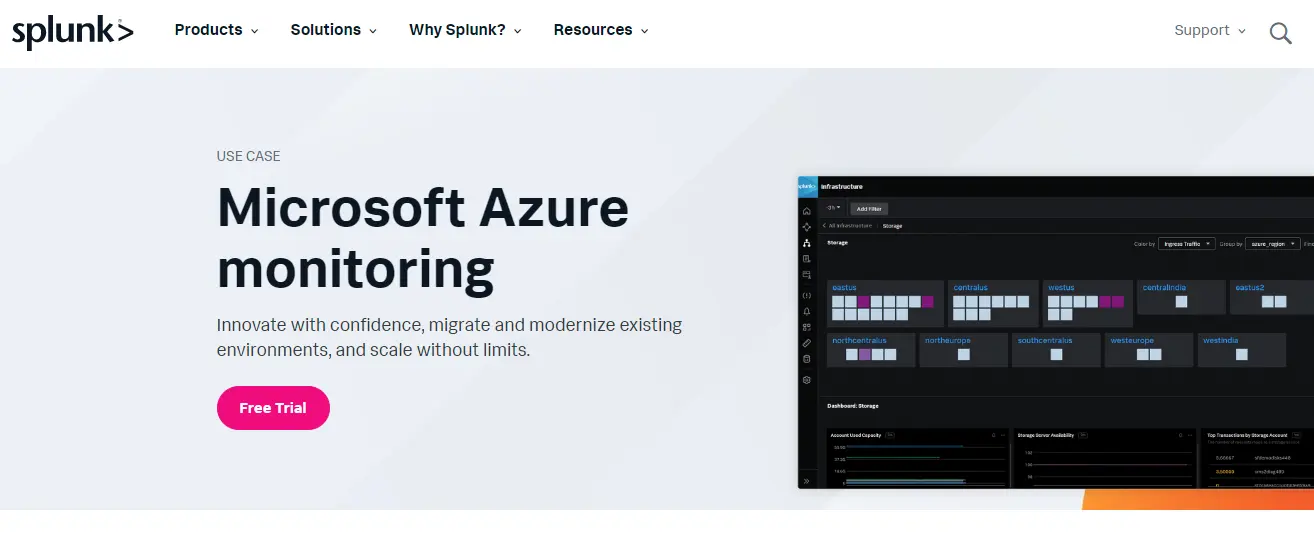
Splunk, now operating as part of Cisco following the $28 billion acquisition completed in March 2024, provides log management, infrastructure monitoring, APM, and security analytics. Splunk’s Observability Cloud integrates with Azure Monitor and supports Azure-native services, Kubernetes, and serverless workloads.
Splunk’s differentiator is its search and analytics engine, particularly for organizations with complex log analysis requirements or combined observability-and-security use cases. The platform also now incorporates AppDynamics APM capabilities within the broader Cisco Splunk Observability portfolio.
Best for: Enterprises with complex log analytics, SIEM, and security monitoring requirements alongside Azure infrastructure observability.
18. Grafana Cloud — Open-Source Dashboarding and Observability
Grafana Cloud provides managed Grafana dashboards, Prometheus metrics, Loki log aggregation, and Tempo distributed tracing. The platform integrates natively with Azure Monitor as a data source, allowing teams to build custom dashboards on top of Azure telemetry without managing their own Grafana infrastructure.
Grafana’s strength is visualization flexibility — teams can combine Azure Monitor data, Prometheus metrics, and third-party data sources into unified dashboards. The open-source foundation means broad community support and no vendor lock-in on the visualization layer.
Best for: Teams that want flexible, open-source-based dashboarding and visualization on top of Azure Monitor data.
19. ManageEngine – Agentless Azure monitoring
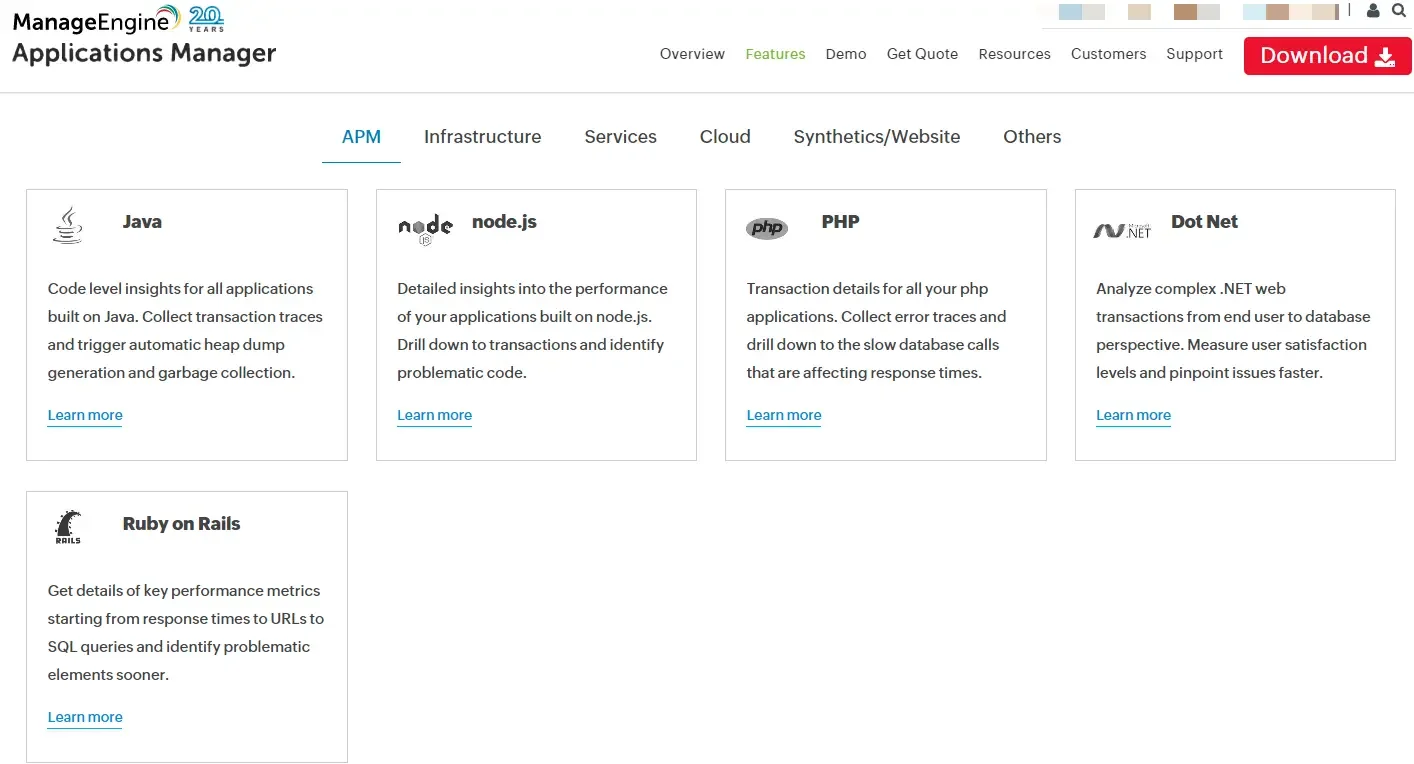
In Azure, you can use this tool to collect, interpret, and act on telemetry relating to infrastructure, apps, and digital experiences. ManageEngine leverages Azure APIs to do that. No collectors or agents are required. The platform supports real-time and historical analyses, including cloud resource utilization to optimize it.
Best for: Mid-market IT teams that prefer agentless, straightforward Azure monitoring with on-premises deployment options.
20. Opsview (ITRS Group) — Azure Elastic Pool and VM Monitoring
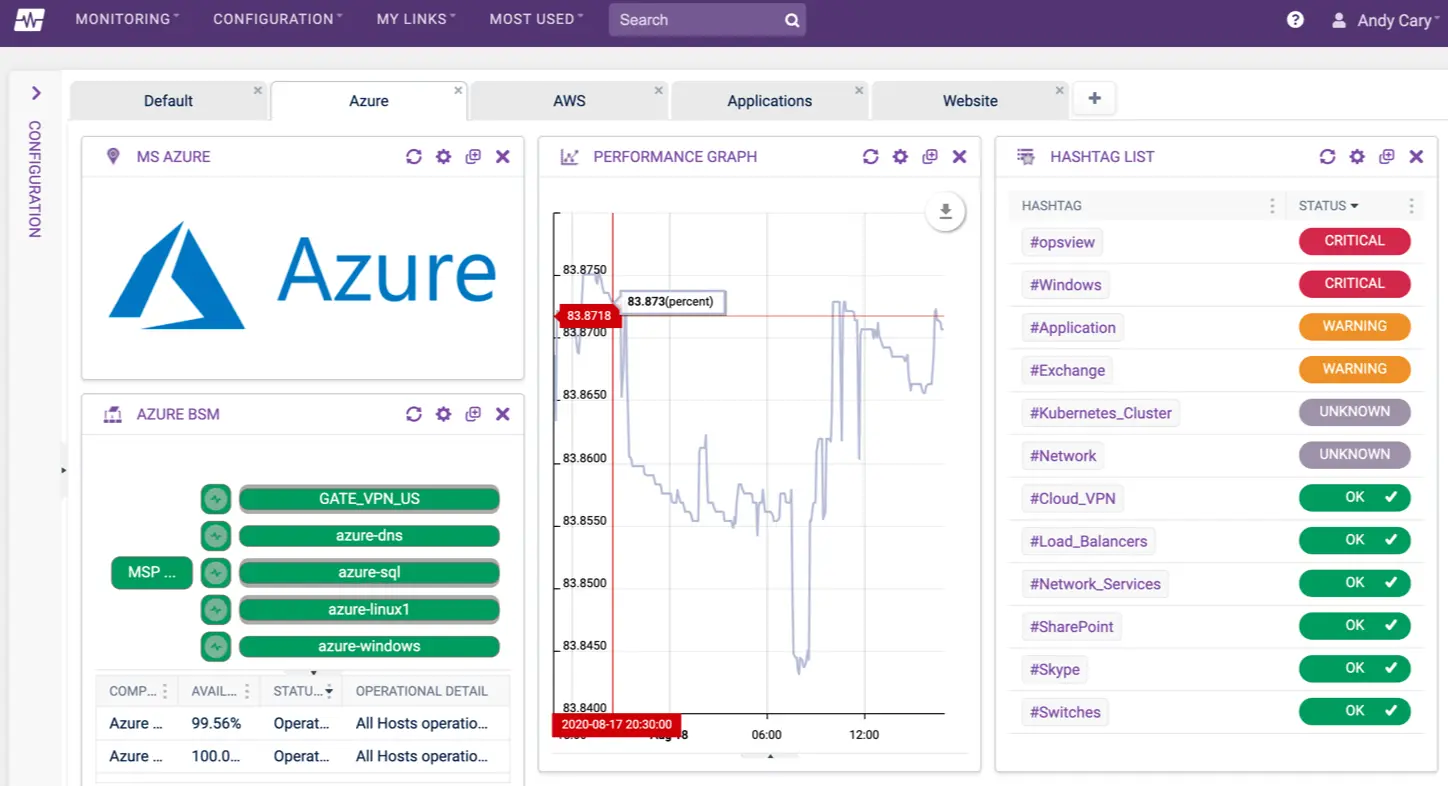
Opsview, acquired by ITRS Group in 2021, provides several host templates, enabling you to manage multiple Azure Cloud Resources, including VMs, load balancers, and storage accounts. You can choose from over a dozen Host Templates to ease your getting started.
Azure Express Scan provides a configuration wizard to guide you through quickly discovering Microsoft Azure objects (Hosts) within a given Azure subscription and automatically importing them into Opsview.
The platform’s latest release (v6.12.0, February 2026) continues to add Azure monitoring capabilities.
Best for: IT operations teams using ITRS Group’s monitoring ecosystem that need extensible Azure monitoring templates.
21. Nodinite – Azure monitoring agent with business process management
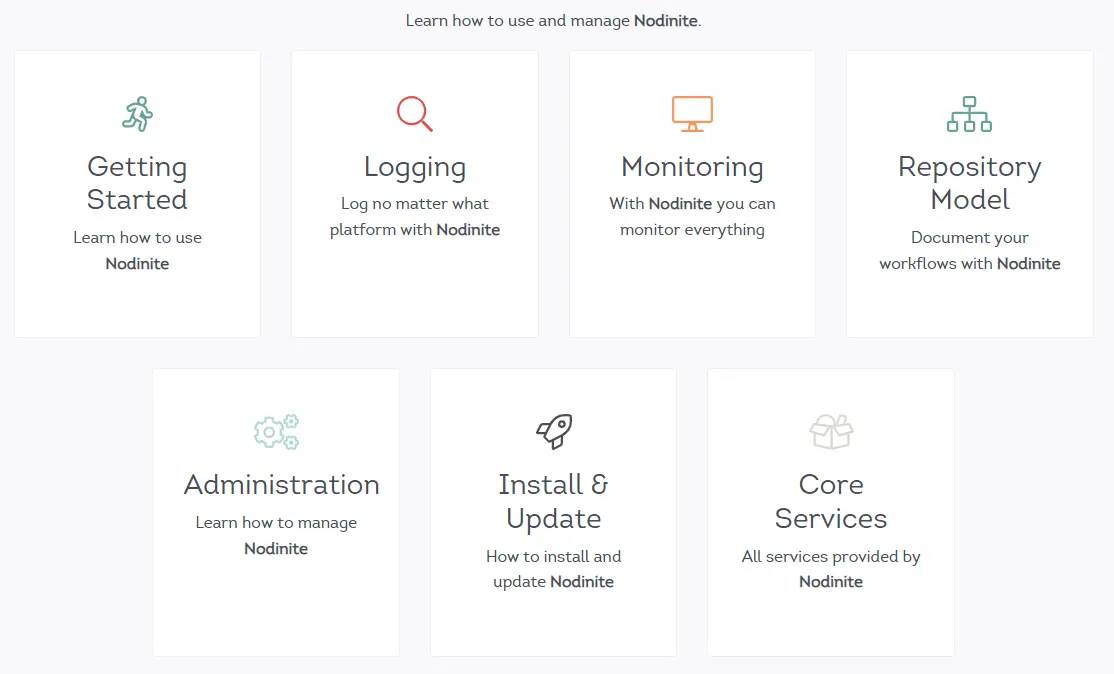
With Nodinite, you can bypass the Azure Web Portal when troubleshooting and resolving standard, support-related tasks. It also offers Nodinite auto-healing, automatically resolving detected issues without your intervention to ease your workload. Security-wise, Nodinite leverages role-based, self-service, and audited access.
One license and one instance of the Azure agent will suffice for all your Azure Storage containers and Web Jobs, irrespective of your region.
Best for: Teams that need business process monitoring layered on top of Azure integration services.
22. Virtana (formerly Zenoss) — Hybrid Infrastructure Monitoring
Zenoss was acquired by Virtana in May 2025 and now operates under the Virtana brand. The Virtana Service Observability platform (formerly ZenPack extensions) monitors Azure cloud services alongside VMware, containers, and physical infrastructure.
The platform uses a model-based approach to infrastructure monitoring and is designed for large-scale hybrid environments. It appeals to organizations with complex, multi-tier infrastructure spanning Azure and on-premises data centers.
Best for: Large enterprises with hybrid infrastructure that need model-based monitoring across Azure and on-premises.
23. ScienceLogic – Agent and agentless monitoring for Azure resources, services, and apps
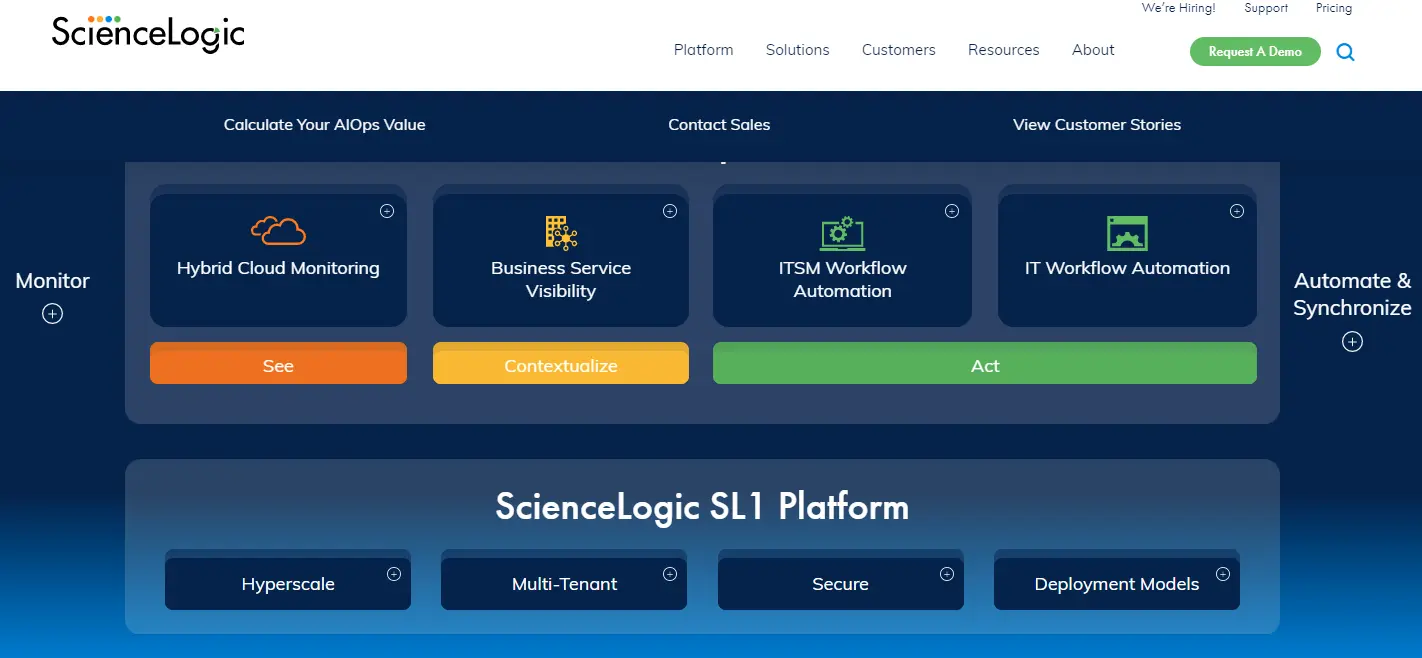
With Science Logic’s Azure Monitoring tools, you use Azure APIs to troubleshoot issues, monitor availability, map dependencies between onsite vs Azure Cloud environments, and track workload migrations — along with everything in between.
The platform manages any technology, anywhere. That enables you to monitor your Azure deployments at scale, ensure security, leverage automation, and boost resilience.
Now branded as the ScienceLogic AI Platform with the Skylar suite, ScienceLogic was named a Leader in the Forrester Wave for AIOps Platforms (Q2 2025).
Best for: Enterprise IT operations teams pursuing AIOps-driven monitoring across multi-cloud and hybrid environments.
24. Zabbix – Open-source Azure monitoring integration
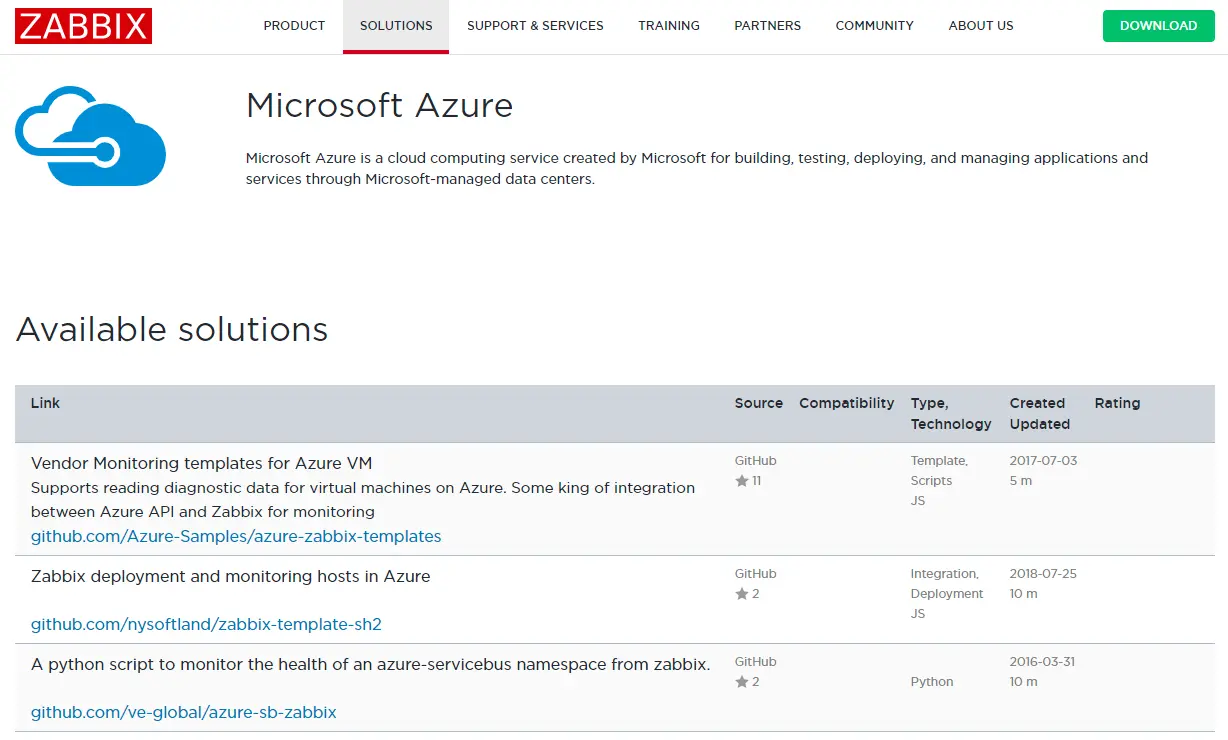
The Zabbix monitoring platform for Azure tracks metrics from hosted or sourced Azure servers, VMs, and network devices in real time. It includes support for vendor monitoring templates and reading diagnostic data for Azure VMs. You can also monitor the health of your Azure services using a Python script that integrates with Azure API for deeper monitoring.
In addition, you can request custom integrations based on Zabbix’s best practices and your preferences.
Best for: Teams with in-house monitoring expertise that want fully customizable, self-hosted Azure monitoring without licensing costs.
25. Logz.io – Highly scalable, native Azure monitoring integration
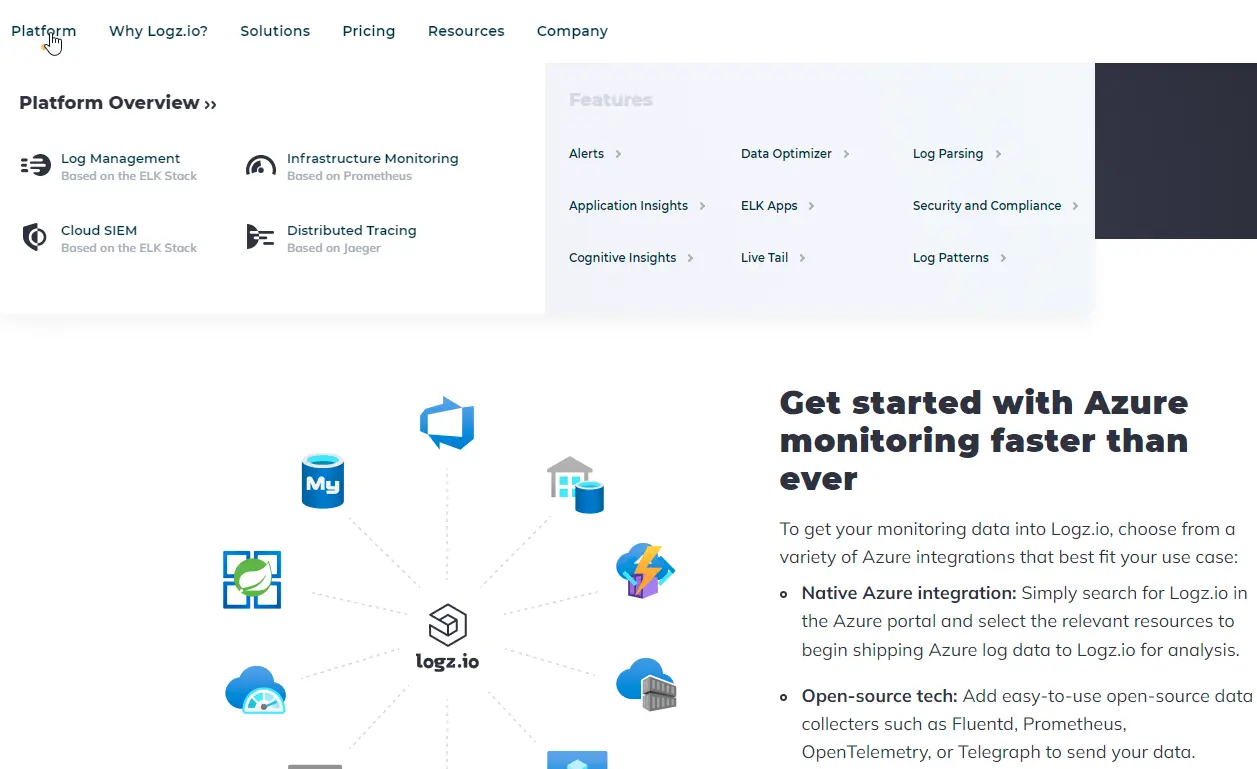
Logz.io enables your DevOps teams to observe and set alerts for latency, errors, traffic bottlenecks, resource saturation, and other Azure Cloud metrics. The tool creates a new Logz.io account from your Azure client interfaces, such as Azure Portal, Azure PowerShell, and SDK.
It then configures your Azure services to forward logs to Logz.io — a fully managed offering that doesn’t require customers to set up and maintain infrastructure. You can then unify your data from Azure to on-premises and AWS to GCP workloads in a single interface.
Best for: Teams that prefer open-source-based observability with managed infrastructure and Azure-native integrations.
Bottom Line
Azure provides plenty of cloud computing capabilities to meet all your workload requirements. Azure is a natural alternative to AWS, GCP, and other major cloud providers. The Azure platform also provides a capable pairing platform for organizations exploring a hybrid cloud strategy.
With one of the Azure monitoring tools featured here, it’s easier to identify performance issues, security threats, and cost concerns in the public cloud. By analyzing the data you get from your workloads, you can improve your operational efficiency in Azure.
Take The Next Step: Understand Your Azure Unit Costs, Like Cost Per Customer, With CloudZero
CloudZero’s cloud cost Intelligence approach helps you collect, monitor, and understand your unit economics, with granular, actionable insights like cost per customer, feature, product, team, project, and environment.
For simpler chargebacks, showbacks, cost allocations, and forecasting, CloudZero accurately maps your Azure costs to the exact people, products, and processes that generated them — all without endless tagging.
CloudZero also monitors cost-related metrics, traces, and events in real time and alerts engineers and FinOps teams of any issues before they become costly.
to see how CloudZero customers make smarter decisions, like pricing their products profitably, knowing the most profitable customer segments to target, and increasing their gross margins with cloud cost intelligence.
Azure Monitoring FAQ
What is the best monitoring solution for Azure?
The best monitoring solution depends on your needs. Azure Monitor is the go-to choice for comprehensive monitoring. It provides full-stack monitoring across applications, infrastructure, and networks. It also integrates smoothly with other Azure services and offers advanced features such as alerts, diagnostics, and custom dashboards.
What is similar to CloudWatch in Azure?
Azure Monitor is to Azure what CloudWatch is to AWS. Both services offer metrics and logs, helping you track performance and set alerts. They also allow you to maintain visibility over your infrastructure and applications.
What is the difference between Azure Monitor and Log Analytics?
Log Analytics is a component within Azure Monitor, not a separate product. Azure Monitor collects two types of telemetry: metrics (numeric time-series data) and logs (structured event records). Log Analytics is the engine that stores, queries, and analyzes the log data using Kusto Query Language (KQL). Think of Azure Monitor as the umbrella platform and Log Analytics as the log storage and query layer underneath it. Other components under the Azure Monitor umbrella include Metrics Explorer, Application Insights, Alerts, and Workbooks.
Is Azure Monitor free?
Azure Monitor includes a free tier, but costs increase with usage. Basic platform metrics for Azure resources are collected at no charge. However, ingesting custom metrics, logs into Log Analytics workspaces, Application Insights telemetry, and configuring alerts all carry per-unit costs that scale with volume. Organizations running large Azure estates often find that Azure Monitor costs become a meaningful line item, which is one reason many supplement it with third-party tools that offer more predictable pricing.
Software and pricing information last verified May 2026. Features, pricing, and availability may have changed. Please verify current details with vendors before making decisions.


