Your job as a Chief Financial Officer (CFO) carries a lot of weight, regardless of the size and industry of your organization. You are also directly accountable for ensuring your company’s financial health by providing accurate, up-to-date, and actionable insights.
If your revenue comes from recurring subscriptions, SaaS metrics form the backbone of your business. They measure your profitability and growth, provide financial reporting and forecasting, and provide guidance on maximizing ROI.
Real-time metrics also give you the insight you need to make timely decisions at the speed of the cloud, your customers’ needs, and your competitors’ releases.
This is where CFO dashboards come in handy. So, what is a CFO dashboard, do you need one, and what are the best CFO dashboard examples you can use today?
What Is A CFO Dashboard?
A CFO dashboard is a financial analysis tool that Chief Financial Officers and financial professionals use to visualize their financial data in a complete, consistent, and reliable manner.
CFO dashboards are a central hub for tracking, analyzing, reporting, and presenting key financial figures. They provide CFOs with information about financial opportunities and risks so they can anticipate risks and implement solutions.
How a CFO dashboard works
A robust CFO dashboard allows you to monitor, understand, and take proactive measures to ensure optimal operational and financial performance. It often includes static, ad hoc, formatted graphs and reports that help detect on-the-fly financial issues and risks.
CFO dashboards may, for example, display profit margins as a bar chart. You can construct a gross profit-and-loss scorecard from revenue, costs, and net profit data.
A line chart or a treemap can display revenue, operating expenses, taxes, and other fiscal details.
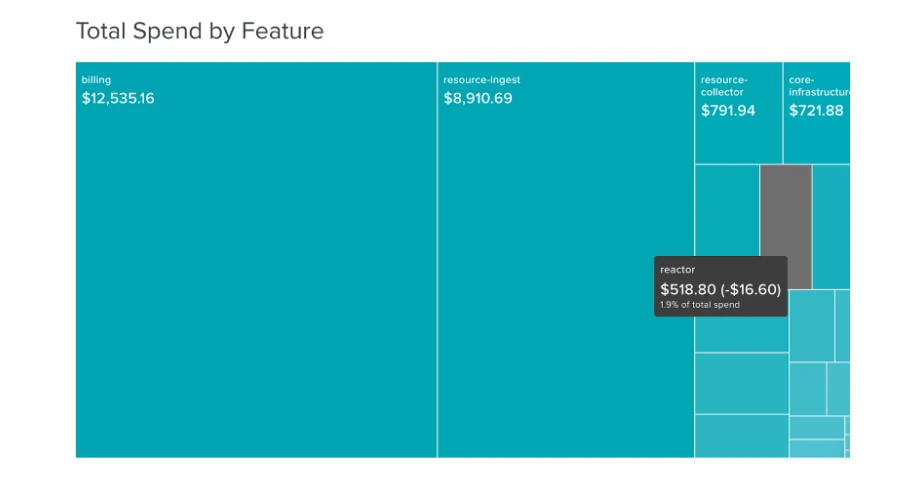
CloudZero treemap for seeing total spend by feature
It can also display real-time cost changes, so you can immediately tell what actions to take to improve your operational costs instead of waiting until the end of a billing cycle when it is too late to change things.
Reports can display various financial data. The best CFO dashboards are customizable, empowering you to decide which data to include in what reports.
Report
Finance needs to prove AI’s return: CloudZero report
260 senior finance leaders (more than half CFOs) told us why the speed of seeing AI spend, not the size of it, separates who pulls ahead on AI from who gets burned.
What Is The Difference Between A CFO Dashboard And A CFO Report?
A CFO dashboard provides a high-level picture of your organization’s financial health, but CFO reports go into greater detail to provide more detailed insights from what you view on the dashboard.
Using CFO reports, your finance team and other stakeholders can spot financial trends or bottlenecks systematically or in real time to inform your next course of action.
Reporting topics may include:
- Multiple metrics on the day-to-day fiscal operations
- Your company’s financial performance against target KPIs
- Notable trends, patterns, or relations metrics presented in data form
Together, dashboards, reports, and financial metrics can provide answers to questions such as:
- How much does our application cost to run? What particular features are the most expensive to run?
- What are our customers’ most popular features?
- Can we refactor the least-used features to open up additional revenue streams instead of spending money and effort on them?
- Can we decommission certain features without significant revenue loss?
- Which customer or customer segment is the least profitable for us?
- What is the cost of each transaction?
Now, what are the KPIs and metrics a CFO dashboard needs to track?
CFO Dashboard KPIs: Key CFO Dashboard Metrics To Focus On
In the CFO role, a key performance indicator (KPI) or metric quantifies financial performance. Companies can use these metrics to gauge their financial performance compared to their close competitors.
Your CFO dashboard KPIs will vary depending on your financial goals, industry, company size, fiscal policy, and compliance standards, among other factors.
Yet, the SaaS recurring revenue model makes traditional financial metrics unsuitable. You need actionable metrics to understand how your SaaS business is growing.
We’ve covered a lot of key financial SaaS metrics here, but let’s look at some financial KPIs and metrics to watch on your CFO dashboard.
- Monthly recurring revenue (MRR) – The MRR measures how much revenue each customer generates each month, whether you have multiple pricing tiers or only one.
- Cost of goods sold (COGS) – Cost of goods sold refers to the direct costs of building and maintaining your subscription-based services. COGS enables you to determine how much you spend on critical resources, such as Amazon Web Services (AWS).
- Cost per customer – This metric indicates the cost of resources you spend supporting a specific customer over a particular period. You can see who your most expensive or least profitable customers are so you can tell if it’s time to review their contracts or adjust your pricing plan to improve margins.
- Cost per product or product feature – This KPI helps you view the cost of building and supporting a particular application feature to set a profitable price for each. This means you can decide which ones to add to higher plans, offer on their own, or drop if they don’t catch on.
- Customer acquisition cost (CAC) – This is the cost of gaining a single new user.
- Customer lifetime value (CLV) – CLV is the value that a customer provides to your business from the moment they sign up until they cancel.
- Gross profit – This is the difference between revenue and the cost of goods sold. Finance leaders increasingly use the rule of 40 to benchmark whether growth and profitability are in healthy balance. Gross margin only considers the expenses incurred by selling an additional unit of goods or services, while profit margin merely compares revenues and expenses.
- Operating profit – This is the profit before taxes and interest, i.e., the amount left after paying the cost of goods sold and operating costs.
- Net profit – This is the amount that remains after covering operating and financing costs at the company.
- Operating cash flow – This refers to the increase or decrease in cash resulting from your operating, financing, and investing activities.
- Working capital – This KPI category covers days receivable outstanding, days inventory outstanding, days payable outstanding, receivable aging, payable aging, and inventory trend.
- Key balance sheet indicators – This is also a group of fiscal metrics, including quick, current, and debt-to-equity ratios.
- Burn rate – This is a vital CFO dashboard metric because it represents the rate at which a newly formed company spends its venture capital on overhead before generating positive cash flow through operations. Cash burn measures negative cash flow. It is expressed as cash spent per month.
- Churn rate – This metric represents a percentage of a company’s total number of customers leaving over a period, impacting monthly revenue.
6 Helpful CFO Dashboards For Today’s Finance Professionals
The following are six examples of modern, real-time CFO dashboards helpful for finance leaders and teams using cloud solutions.
1. Cost Per Customer Dashboard
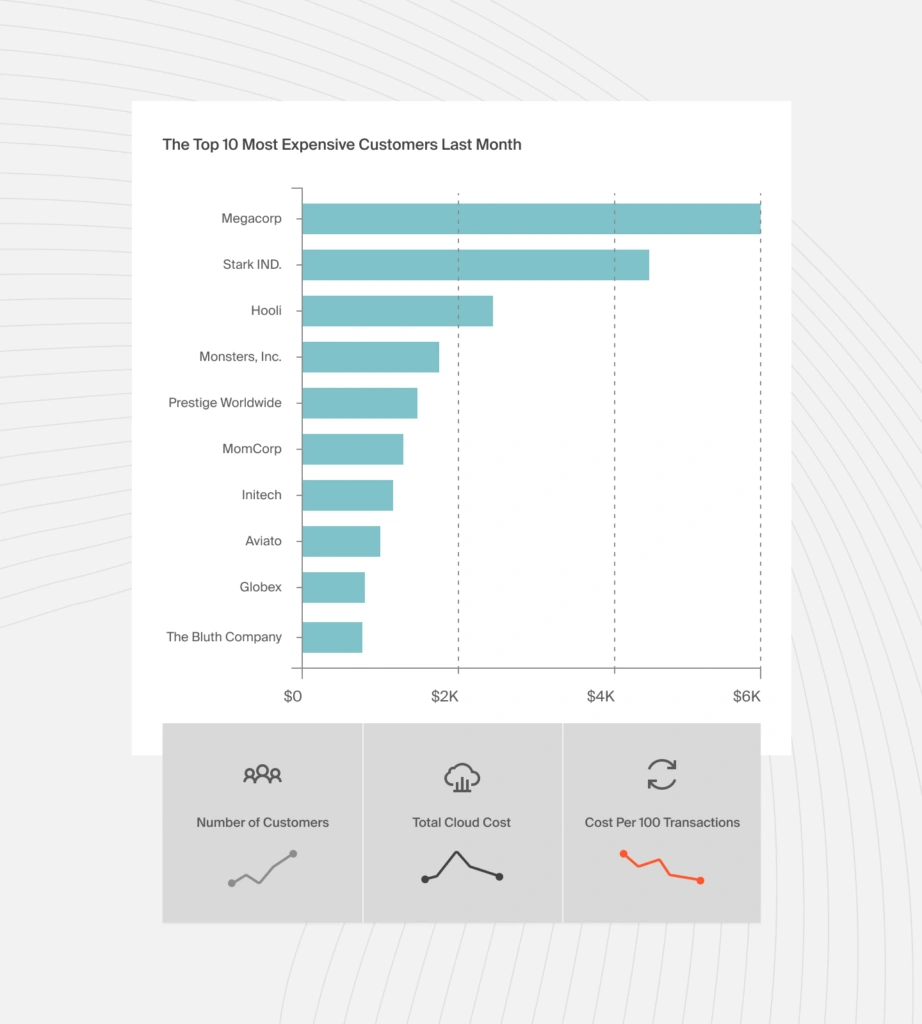
This dashboard is ideal for finance executives and professionals looking to understand cloud costs in detail with instantly actionable insights.
Cost per customer uses unit cost analysis to reveal how much it costs you to support their operations over time. You can also view the cost per tenant sharing resources in a multitenant environment.
Ultimately, you can discern valuable information, such as which customer is the most expensive so that you can revise their contract accordingly, what features a specific customer uses the most, and what discounts you can offer a particular customer.
2. Budgets Dashboard
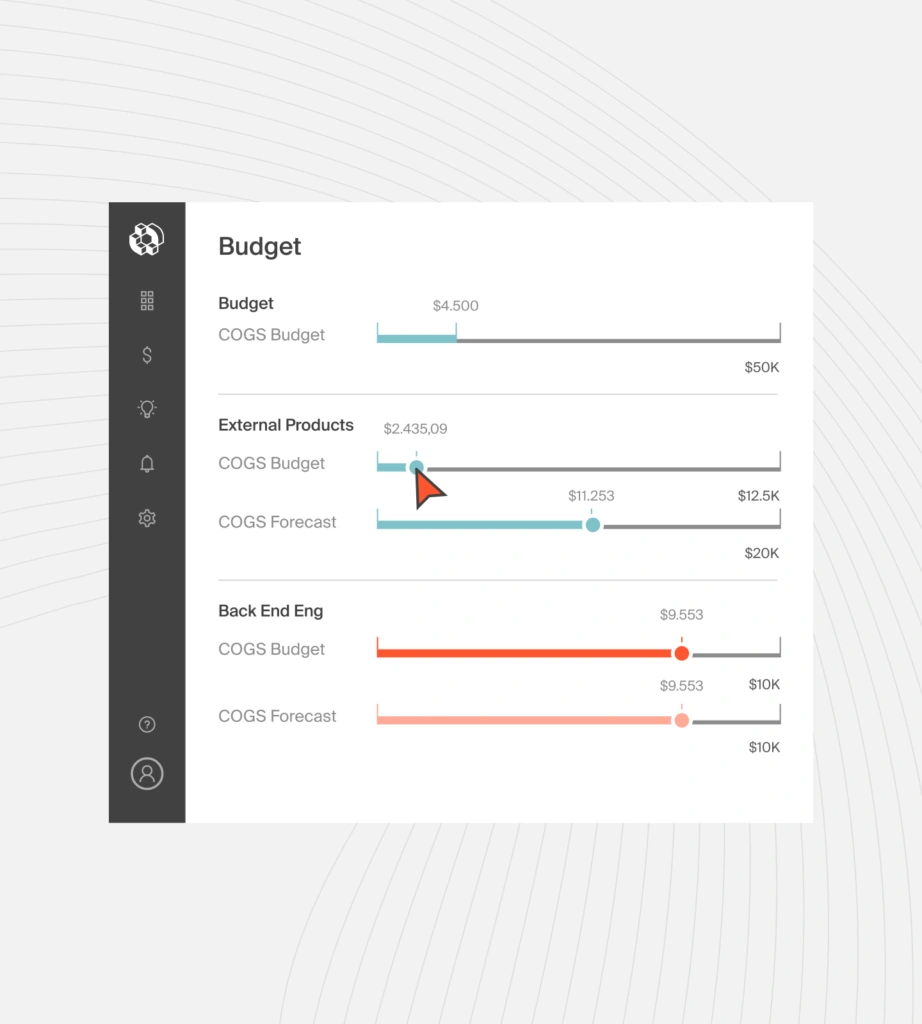
CloudZero Budgets help track cloud spend against both fixed annual budgets and dynamic monthly or variable quarterly forecasts. Dimensions provide real-time insight for team leaders, empowering you to define areas of cloud spending however you choose and create budgets tailored to your company’s needs.
At any moment, you can pinpoint which units, or a team within a unit, is over or under budget and which app features are driving that trend. You can also track costs by individual business units, products, product features, products associated with specific general managers, geographical areas, and more.
3. ProfitWell by Paddle’s Subscription Analytics Dashboard
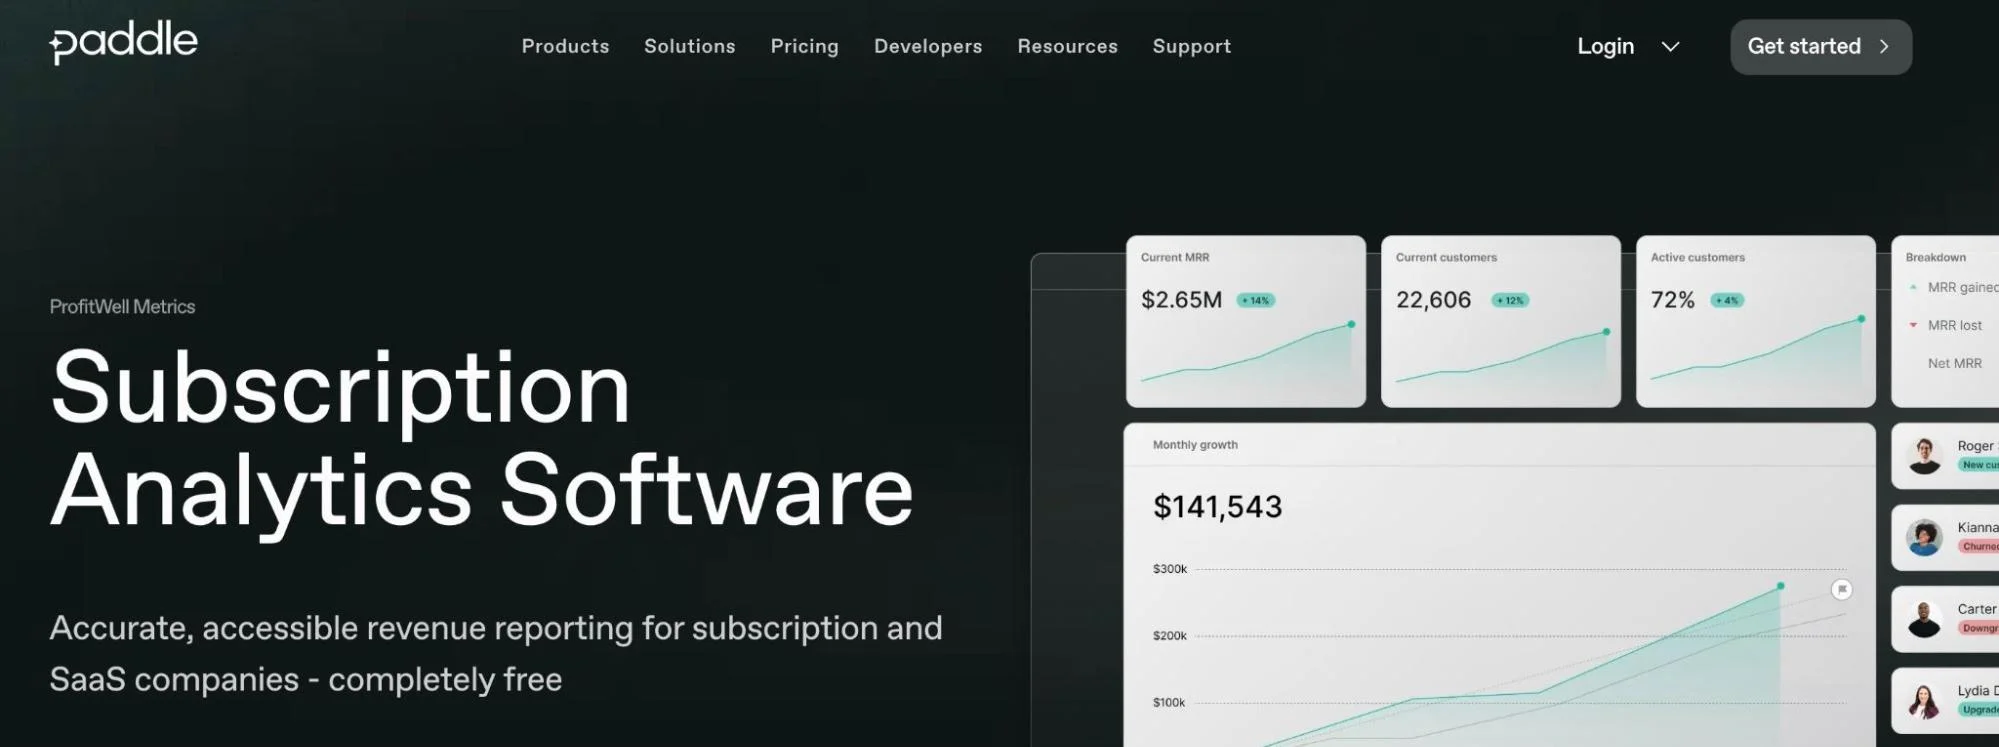
ProfitWell by Paddle is a cloud-based subscription analytics platform and one of the more well-known SaaS tools for tracking recurring revenue metrics. CFOs and finance managers can use it to visualize, understand, and act on their SaaS and recurring revenue metrics under several categories of metrics:
- Revenue – Get a quick overview or slice and dice your subscription revenue by MRR, churn, existing customers, new customers, upsells, upgrades, and downgrades
- Retention – Leverage cohort reports to monitor MRR churn, revenue retention, and delinquent churn.
- Segment – View the customer segments adding or detracting from your subscription growth by over 100 pre-built segments, including location, age, and gender.
- Acquisition – Track trials, conversions, sources of leads, expirations/cancellations, LTV, and more in one CFO KPI dashboard
- Engagement – Track active customers and patterns of usage over time by customer segments and metrics like location to tell what’s driving the trends.
The ProfitWell dashboard also provides breakdowns, such as cash flow, growth, transactions, goal tracking, and recent activity.
4. Databox Dashboard For CFOs
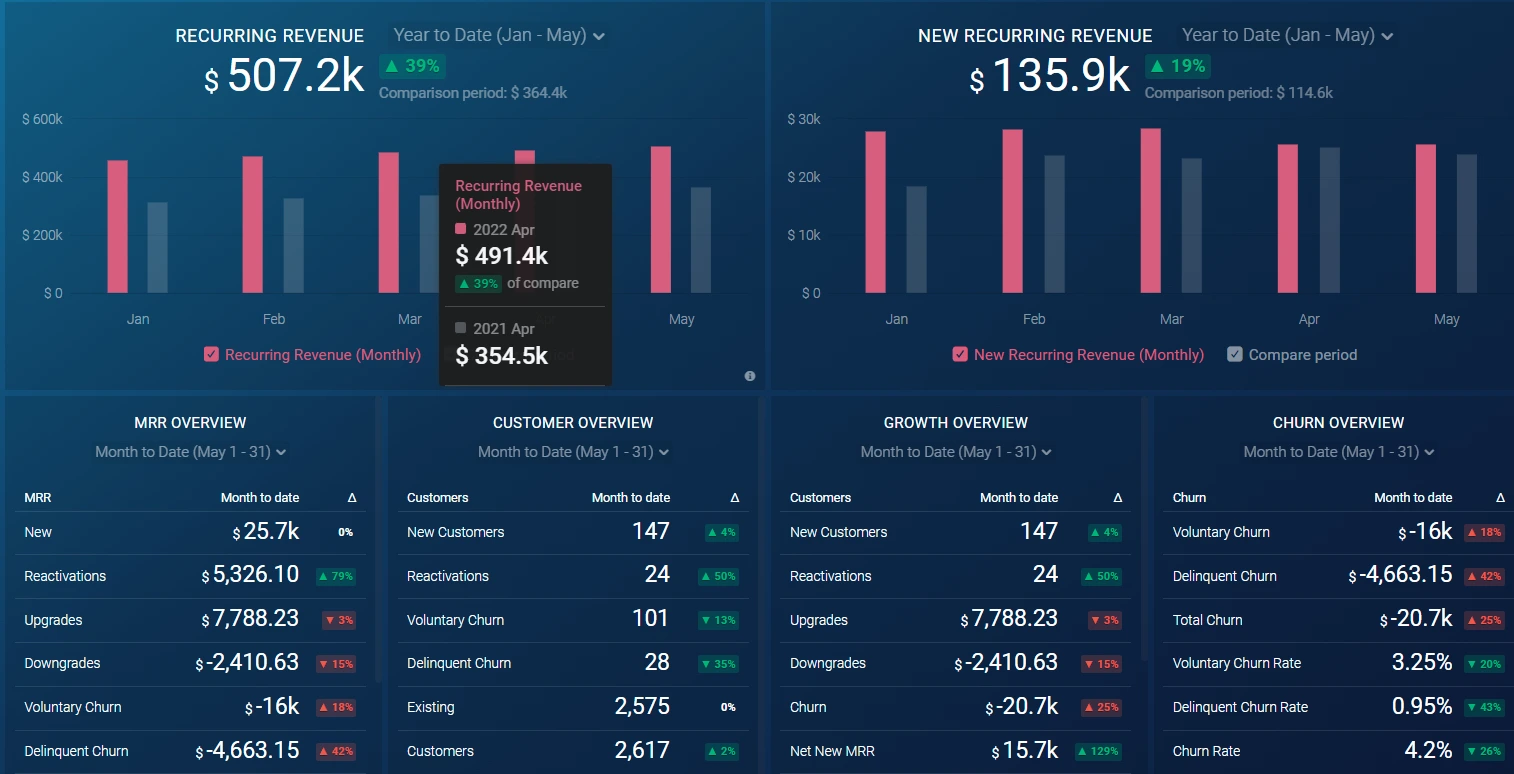
Databox enables you to collect, visualize, and understand your financials with four types of dashboards; profit and loss, revenue, expenses, and cash flow dashboards. As a dedicated metrics platform, Databox lets you pull data from spreadsheets, databases, over 70 native integrations, and other APIs you may have.
Some key revenue metrics you can visualize and dig deeper into include new customers, quick ratio, net new MRR, upgrades, churn, and downgrades.
5. Baremetrics CFO KPIs Dashboard
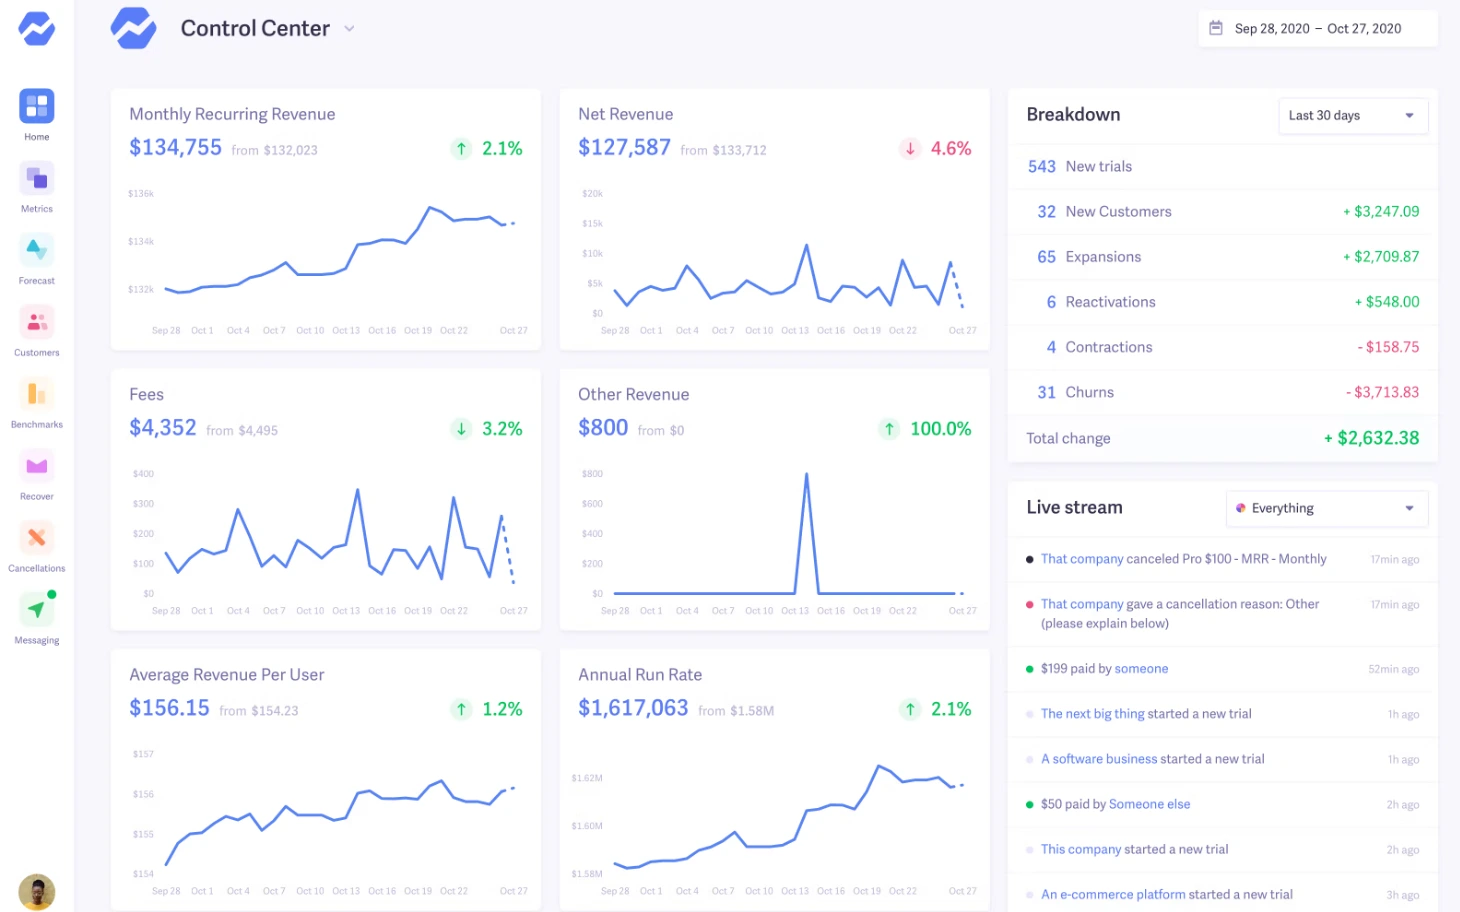
Baremetrics stands out as one of the best CFO dashboards thanks to the level of detail it provides in one place — without clutter.
You can use custom dashboards to track your metrics by vital metrics like MRR, MRR growth rate, voluntary/delinquent churn, user churn rate, active customers, and reactivations. You can also get a high-level view of your quick ratio, plan quantities, Average Revenue Per User (ARPU), cash flow, trial conversion rate, and LTV.
The Control Center also lets you create and track goals, compare performance with multiple filters, and see transactions live streaming on the side.
6. ChartMogul CFO Dashboard
ChartMogul’s business finances monitoring dashboard is suitable for investors, CFOs, and finance professionals across startups and larger businesses. The dashboard offers the most critical financial metrics without requiring you to click more than once.
You can also trace where your customers are coming from, such as through social media or paid advertising. Yet you can also track finance data and recurring revenue trends by subscription plan types, customer cohorts, and geographical location.
DataDog and Tableau, and purpose-built cloud cost management tools are other platforms that can help you create and use valuable CFO KPIs and dashboards to track the financial KPIs that matter to you most.
How CloudZero CFO Dashboards Can Help You Achieve Seamless Cost Oversight
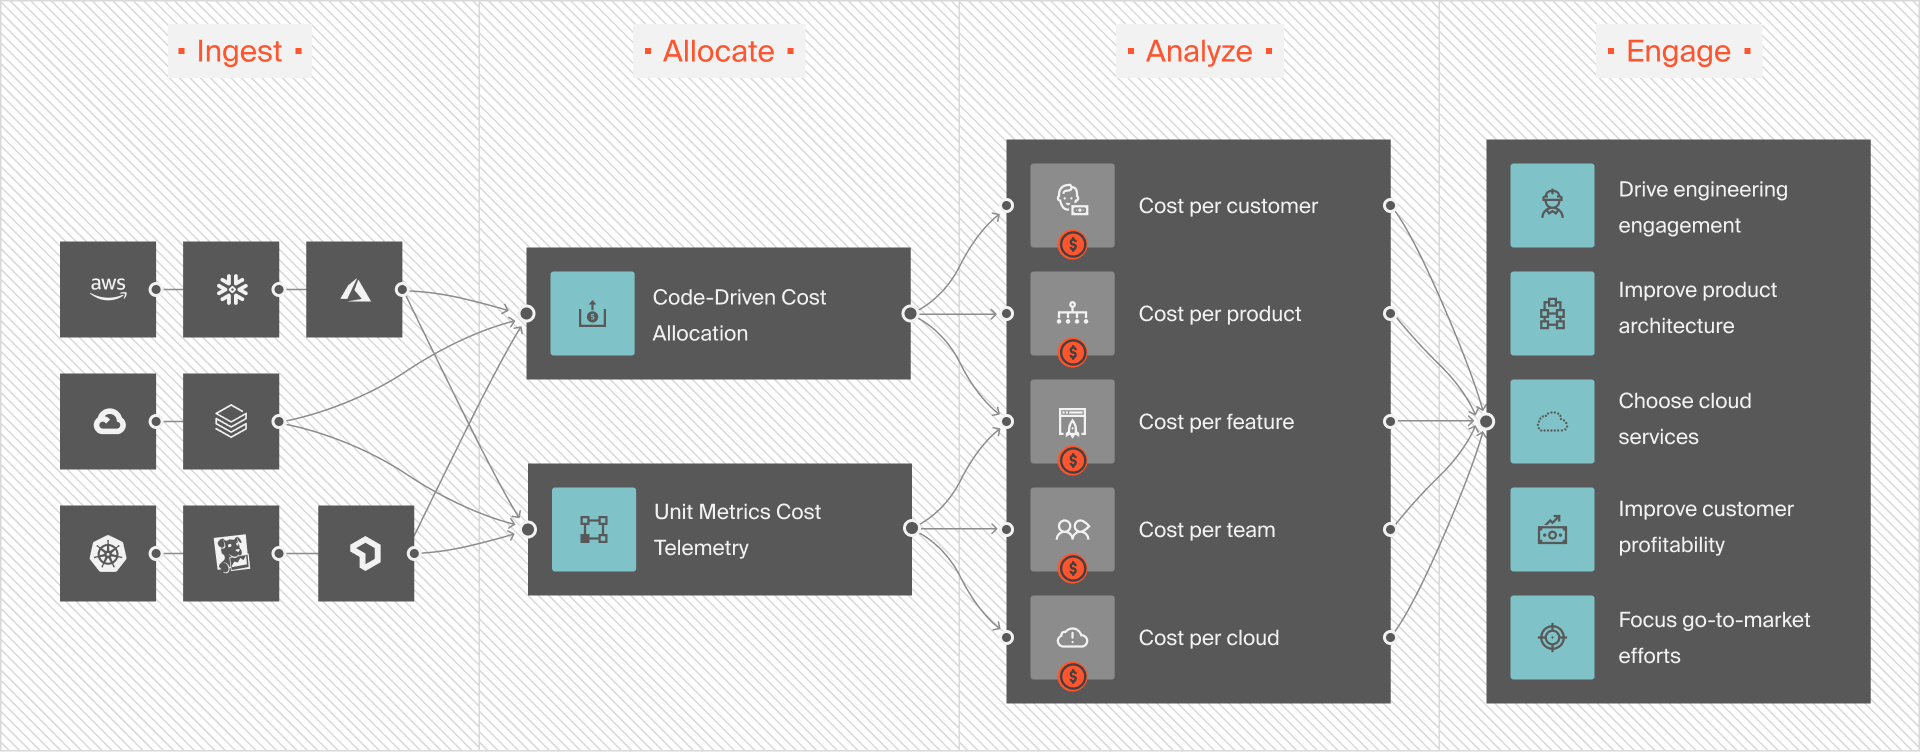
With CloudZero, you can map cloud cost KPIs and metrics to the specific people, processes, and products that created them. You can also shift cloud financial management left and help your engineering team speak the same language as your finance team.
CloudZero includes several engineering-friendly cost metrics, including cost per feature, cost per environment, cost per development team, cost per project, and cost per deployment.
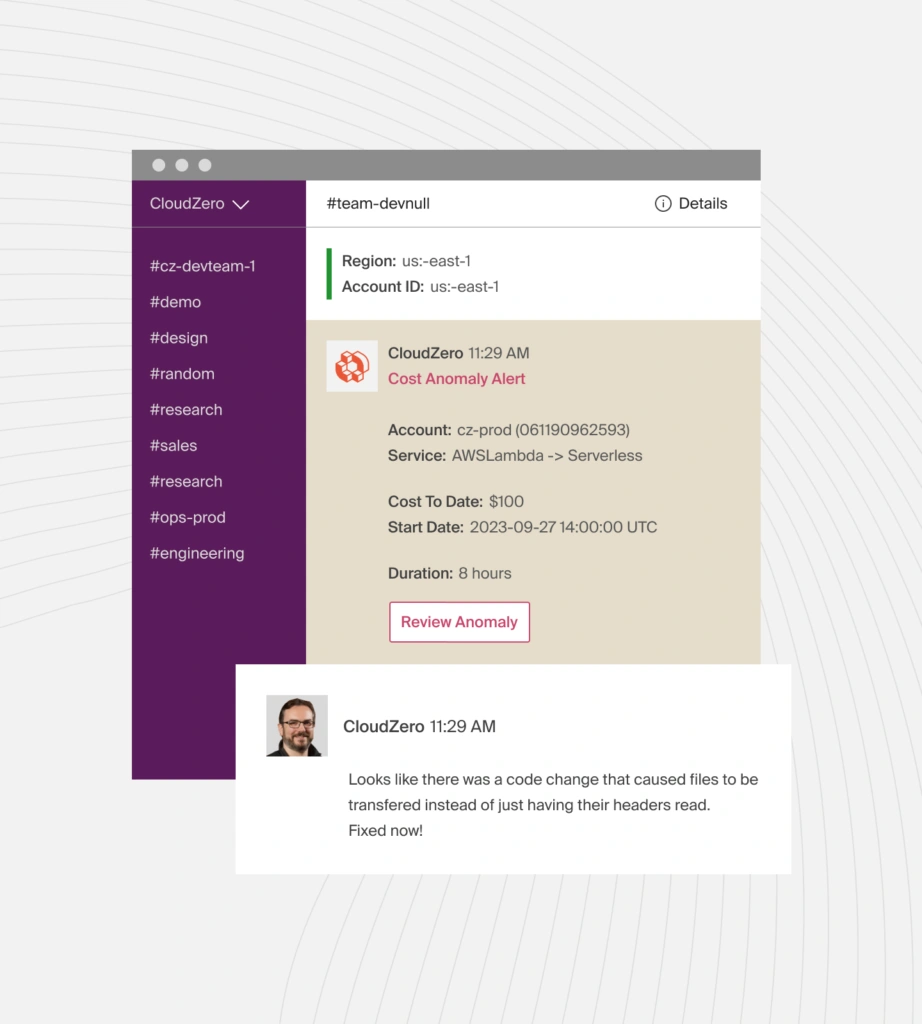
Your engineers and finance teams can also receive near real-time alerts about trending costs, cost anomalies, and other notifications to prevent cost overruns on an architectural level.
So, instead of waiting hours, days, or weeks for finance to recommend a course of action after a cost spike, engineers can get you involved right away to prevent overspending.
Additionally, CloudZero can help you answer questions like:
- How much does it cost to acquire a new customer? How much does it cost to maintain an existing customer?
- How does switching from a licensing to a subscription-based model affect our costs?
- Is there a marginal benefit to acquiring a new subscription?
- Is our company financially vulnerable to the status quo?
- What is our organization’s current value?
- Can we attract the right investors with our gross margins? Could we raise enough funds today to fuel our next growth phase?
- Which changes do we need to make to create a better financial position?
But you don’t have to take our word for it.  to see how CloudZero helps CFOs at companies like Drift, MalwareBytes, and Remit achieve financial success over competitors.


