If your gross margin is lower than 60-90%, you have a weaker SaaS margin than you’d want. This margin can turn away investors, limiting the amount of capital you can raise to fund growth.
Here’s the deal. It may not be a revenue issue. It may be that you are not monitoring the right SaaS metrics. The result: you are probably spending too much. You are probably also unaware of whether this reflects growth or simply overspending, thus ruining your budget and ROI.
This guide features the key SaaS metrics that will help you track the right KPIs for the job. But first, a quick refresher.
What Are SaaS Metrics?
SaaS metrics are quantitative indicators that help analyze the health and performance of a software-as-a-service business over time. The metrics track key performance indicators such as financial performance, user engagement, and customer satisfaction.
Why monitoring SaaS metrics is critical
SaaS metrics help businesses make data-based decisions based on insights such as:
- How your customers interact with your product and services
- How much money your customers are spending on specific products or services to gauge their popularity
- Your revenue
- Customer trends
- Areas of improvement
- How to use data to optimize your business model for growth instead of going with a gut feeling or guesswork
That said, here are some of the key SaaS metrics you’ll want to track organized into categories:
Financial metrics
- Gross Margin – Profitability measure.
- Monthly Recurring Revenue (MRR) – Recurring revenue from subscriptions.
- Lifetime Customer Value (LCV) – Total revenue a customer generates over their relationship with the company.
- Customer Acquisition Cost (CAC) – Cost to acquire a new customer.
- Net Profit Margin – Overall profitability of the business after expenses.
- SaaS Cost of Goods Sold (COGS) – Costs associated with delivering the SaaS product.
- Burn Rate – How fast the company is spending available cash.
Growth metrics
- Customer Acquisition Cost (CAC) – Tracking the cost to gain customers impacts growth strategies.
- Expansion Rate – Measures MRR gained from existing customers through upsells or upgrades.
- Contraction Rate – Measures MRR lost from downgrades.
- CAC Payback Period – Time it takes to recoup customer acquisition costs.
- Market Size – Determines the potential growth based on customer base and revenue.
- LCV to CAC Ratio – Determines if the cost of acquiring customers is justified by long-term revenue.
Customer engagement metrics
- Net Promoter Score (NPS Score) – Measures customer loyalty and likelihood of referrals.
- Customer Retention Rate (CRR) – Percentage of customers who continue using the service over time.
- Churn Rate – Percentage of customers canceling subscriptions within a given period.
- Customer Engagement Score (CES) – Tracks customers’ engagement with the product.
- Active Users – Measures regular usage of the product by customers.
Product performance metrics
- Monthly Active Customers (MAC) – Measures how many customers actively use the product monthly.
- Customer Engagement Score (CES) – Tracks the level of interaction and engagement with the product.
- Time to Value (TTV) – How quickly customers see the value after signing up.
- Contraction MRR – Reflects the performance of pricing plans based on customer downgrades.
- Expansion MRR – Shows product success based on upgrades and upsells.
Operational metrics
- SaaS Cost of Goods Sold (COGS) – Operational costs associated with delivering the service.
- Unit Cost – Measures cost per customer, feature, or transaction to manage and optimize operational efficiency.
Here’s a deeper dive into these crucial SaaS metrics and how to make sense of them.
Report
Finance needs to prove AI’s return: CloudZero report
260 senior finance leaders (more than half CFOs) told us why the speed of seeing AI spend, not the size of it, separates who pulls ahead on AI from who gets burned.
1. Market Size
Market sizing refers to determining the total number of potential buyers of your SaaS service or product within a specific market and the total revenue you may generate from those sales.
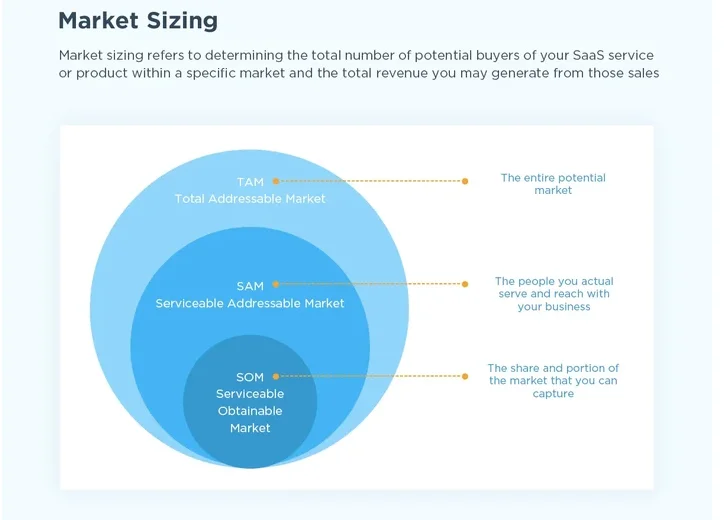
This is not exactly a SaaS-specific metric.
However, knowing who might eventually become your customer is essential to developing a marketing plan that targets them. With a targeted marketing plan, you can optimize customer acquisition costs, resulting in healthy margins for each customer.
Customers should be able to find value in your offering and adopt it quickly. The shorter the activation and conversion duration, the lower the customer acquisition costs can be.
2. Customer Acquisition Cost (CAC)
Customer Acquisition Cost (CAC) is the total amount you spend to gain one additional user within a specific period. This includes marketing, advertising, sales, and other expenses you incur to acquire a new customer.
You want to keep CAC low to maintain a healthy margin. For SaaS companies, this upfront investment is repaid over time as recurring revenue (subscriptions or memberships).
You calculate CAC by taking the total costs of sales and marketing for the given period and dividing it by the number of new customers you gained during that period.
This is the standard way to calculate CAC. But it can be problematic for several reasons:
- The cost and effort to acquire a customer is different for each customer.
- You cannot tell which customers are your most expensive to acquire and maintain or by how much.
- This makes it challenging to decide on a SaaS pricing model for a specific client or service. If you do not have clear visibility of your cost per customer, you will have a hard time figuring out how to create healthy margins from each client or segment.
However, using a platform like CloudZero, you can identify, measure, and monitor the cost to serve each of your customers, enabling you to set profitable prices for your product or service.
CloudZero aligns cloud spend to specific customers, features, and products so you can identify cost per customer, see your most expensive customers, or even track changes to your unit cost baseline.
With this data, you can make informed decisions regarding your pricing, how to price different segments, and which segments to focus more attention on (i.e., which segments are most profitable).
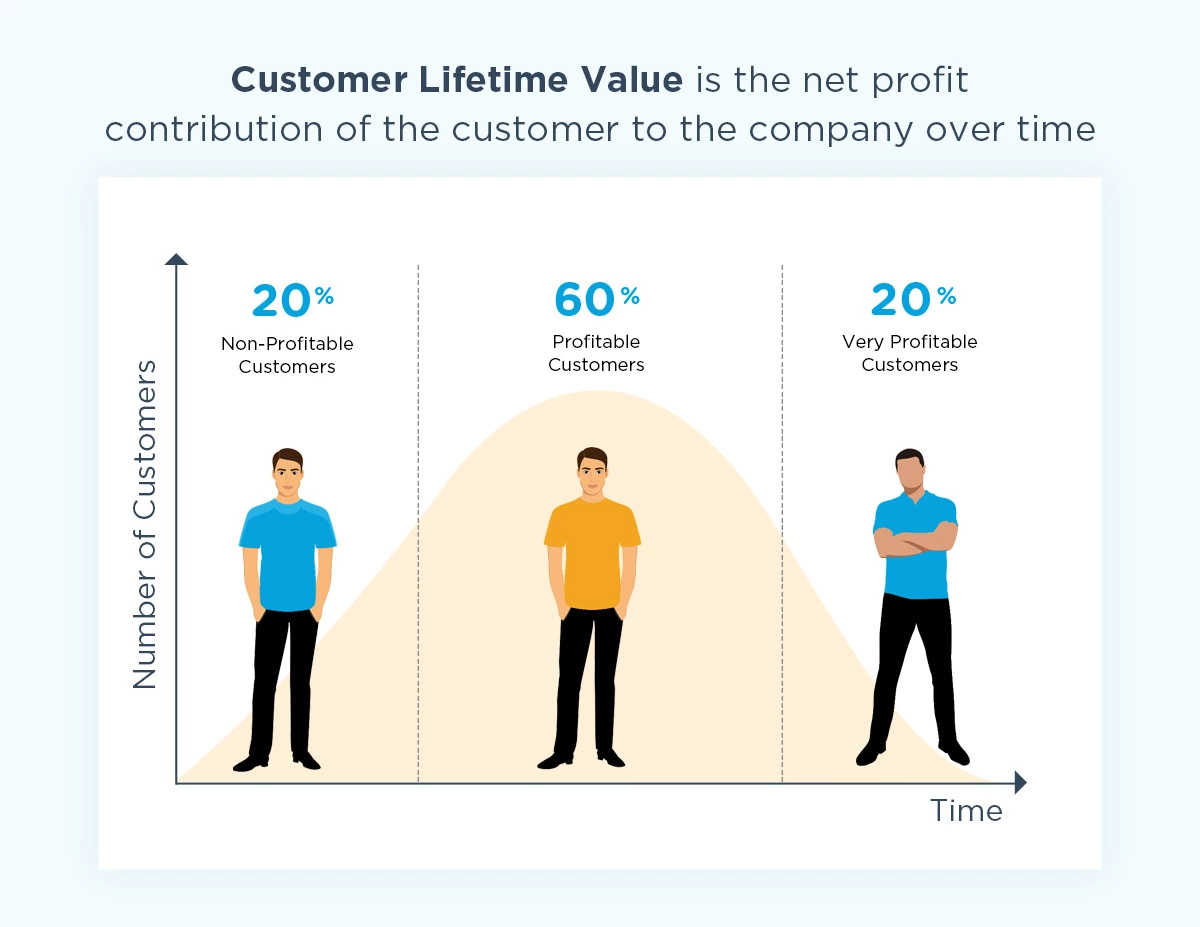
3. Lifetime Customer Value (LCV)
Life Customer Value (LCV) measures the value a customer provides your company from the moment they become a customer until they cancel their subscription.
4. Customer Acquisition Cost (CAC) Ratio
The CAC ratio is the total cost of acquiring new customers over the total revenue they generate over their lifetime. In other words, it is the cost of gaining each new customer divided by the total revenue that the customer generates for your SaaS business.
5. LCV To CAC Ratio
The Lifetime Customer Value (LCV) to Customer Acquisition Cost (CAC) ratio is a great way to measure the success of a business model.
It helps to determine if the money spent to acquire customers is worth the long-term revenue they generate. CFOs use the LCV:CAC ratio to determine the return on investment a customer provides.
Calculate LCL:CAC by dividing a customer’s LTV by their CAC.
A good LTV:CAC ratio is often between three and five. Lower than that may indicate you do not have a product-market fit. A ratio above five indicates a need to invest more in sales and marketing. If the ratio is less than one, it may mean losing revenue on each customer.
6. Monthly Active Customers Vs. Users
It is common for teams to interchangeably use the terms monthly users and monthly active users. Although monthly users describe all your SaaS users per month, active customers pay monthly to use your service.
Those on free trials or free plans do not count as active customers unless you use a freemium business model.
The difference is significant, as it gives you insight into how many people are using versus paying for your SaaS product. Thus, you can understand your cash flow in terms of your costs to support all customers versus the revenue you earn from them.
This metric also allows you to see if the resources you use to support all users versus paying subscribers is sustainable.
You can introduce different pricing tiers that free users can upgrade to after a specific period (limited-time trial) if you figure that you might run into cash flow trouble in the future. By doing so, these users can generate recurring revenue to ensure profitability.
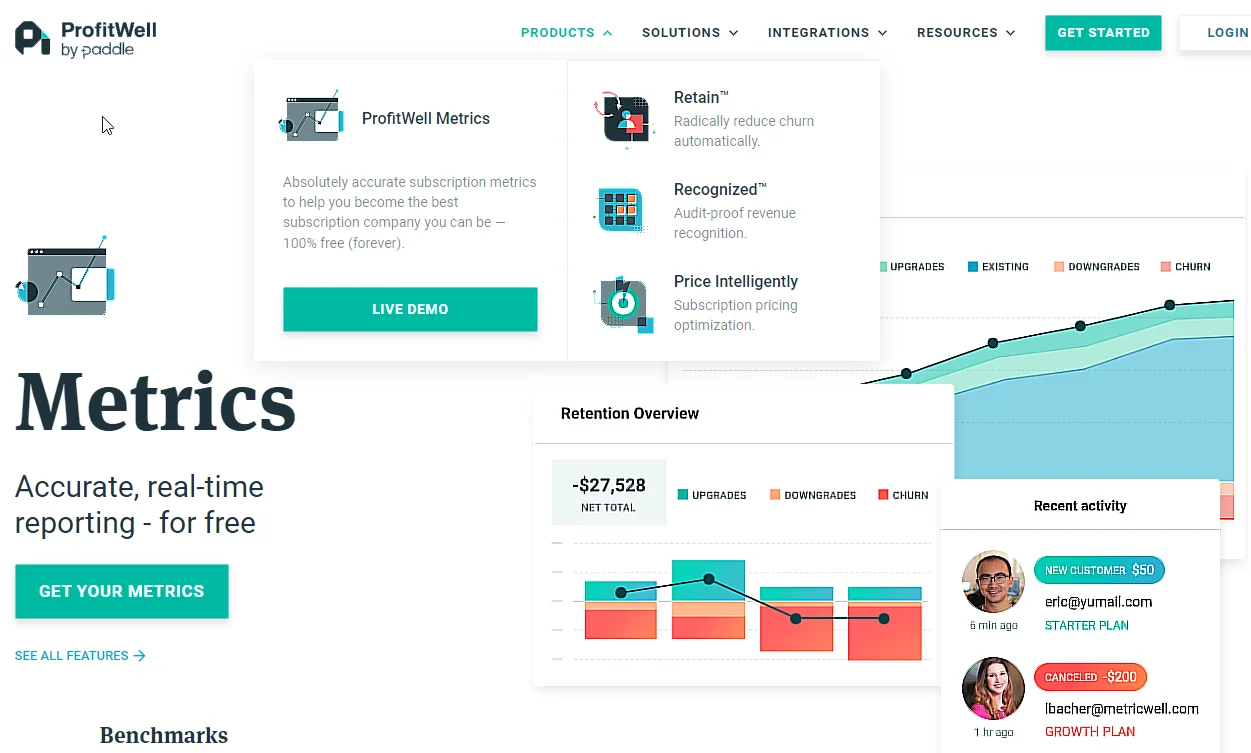
7. Monthly Recurring Revenue (MRR)
MRR is a fundamental SaaS metric because it tells you how much revenue your customers generate monthly. You can calculate MRR manually, just as you can with total users and active clients. Alternatively, you can use a tool like ProfitWell to calculate it in real-time.
You can calculate your annual run rate or annual recurring revenue (ARR) by multiplying your monthly revenue by 12.
It is also possible to use MRR to determine if you are charging enough per month to break even, become profitable, or sustain growth.
SaaS companies with a healthy MRR are self-sustaining. The rule of thumb is to ensure your revenue growth rate and profitability margin are at least 40%. If your range is less than 40%, you may experience liquidity problems soon.
You can use ARR to plan your investment in additional features, hiring, and subscriptions such as CloudZero and ProfitWell.
8. Customer Retention Rate
Retention is a vital metric in SaaS business models. The Customer Retention Rate (CRR) measures the total number of customers at the beginning of a period minus the number you keep at the end.
Remember, SaaS is built on the concept of recurring revenue. The only way to earn recurring revenue is to retain your customers over a specific period. So, your recurring revenue depends on how many customers you keep each month.
9. Churn Rate
Churn is the rate at which customers leave a company over a specific period, expressed as a percentage of your total number of customers. Here’s what each churn rate means:
- A high churn rate shows something is wrong (either with your software, customer service, or some other aspect of your business).
Maybe a critical feature doesn’t work as well as it should. Or, perhaps a competitor has just introduced a highly sought-after feature or lowered prices significantly, attracting your customers.
- A low churn rate may indicate that your software provides excellent value and fits your market well.
It may also indicate that you are undervaluing your offering by charging a low subscription fee. This might be the case if you have a low churn rate but a struggling cash flow.
What is the customer churn rate?
The customer churn rate is the percentage of customers who cancel their subscriptions or do not renew their contracts within a given period. Many SaaS companies use it to measure customer dissatisfaction or loyalty to the product or service.
To calculate your monthly customer churn rate, divide the number of canceled subscribers by the number of active subscribers 30 days ago. Multiply this result by 100 to convert it to a percentage.
Monthly customer churn rate = (Unsubscribed customers in the month/Active subscribers 30 days ago) X 100%
What is the revenue churn rate?
Revenue churn rate measures the subscription revenue lost in a given period. You calculate it by taking the total amount of revenue lost due to customer churn and dividing it by the total amount of revenue all customers generated during the same period.
Be sure to add the MRR of canceled subscriptions to the MRR lost to downgrades. Then divide the result by the MRR you had 30 days ago. To get your churn rate in percentage, multiply the result by 100.
Monthly revenue churn rate = ((MRR of canceled subscriptions + MRR lost to downgrades)/MRR 30 days ago) X 100%
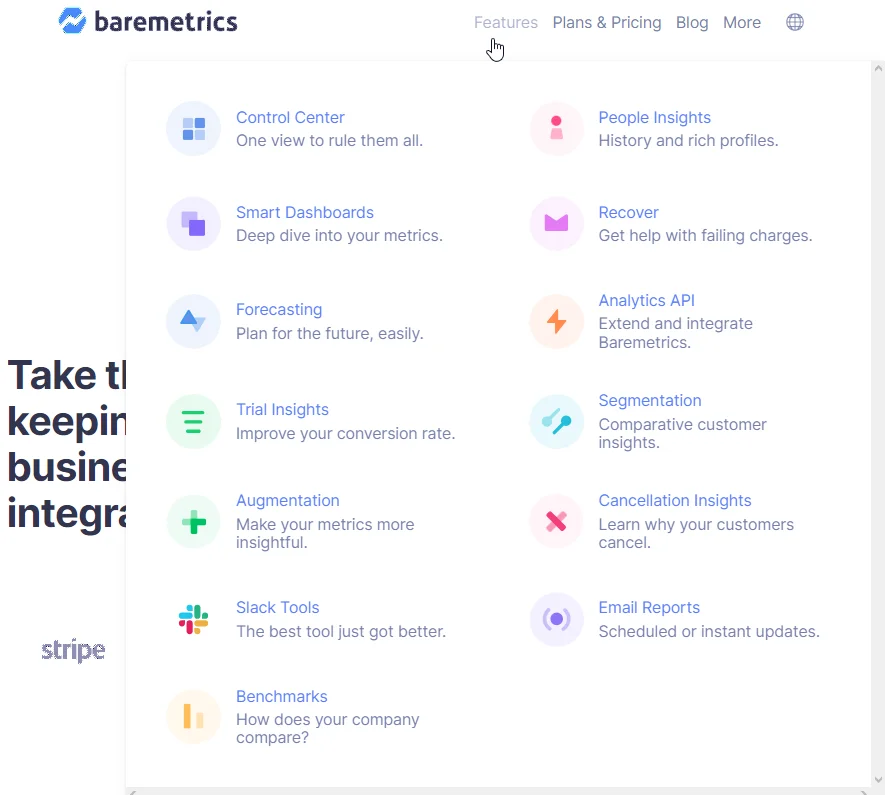
You can also use a tool like Baremetrics to calculate both types of churn for your SaaS business.
Make sure you monitor your churn rate continuously, looking for ways to keep it under 8% per month. If not, it could erode your revenue and, ultimately, margins.
10. Net Promoter Score (NPS Score)
NPS measures customer loyalty by asking how likely customers are to recommend your product to others. It’s a crucial metric for understanding customer satisfaction and brand perception. A high NPS indicates strong customer loyalty and satisfaction. A low NPS suggests room for improvement in your product or service.
11. Time To Value
Time to Value (TTV) measures how long it takes a customer to realize the benefits of your product after signing up. The shorter the TTV, the faster customers can see value from your offering, which improves satisfaction and reduces churn. TTV is vital as it directly impacts customer retention and lifetime value.
12. Burn Rate
Burn Rate tracks how fast your SaaS company is spending its available cash. It’s an essential metric for managing cash flow, especially for early-stage companies or those seeking funding. Monitoring burn rate helps ensure you don’t run out of capital before becoming profitable or securing additional investment.
13. Active Users
Active Users measures how many of your customers regularly use your product. It’s important for gauging user engagement and product stickiness.
14. Contraction MRR
If you offer pricing tiers, then you know customers may sometimes downgrade to cheaper options. The contraction MRR metric helps measure this kind of scenario.
Contraction happens every time you lose MRR from an existing customer — not when they cancel their subscription. Anything that leads customers to pay less for their monthly subscription than usual impacts contraction MRR.
If customers feel they are getting enough value for a lower price, they may downgrade. Another scenario could be that teams with multiple users paying per-user-per-month have reduced members. Or, customers who downgrade may feel your higher-priced plans aren’t worthwhile.
In any case, a high contraction rate hurts your MRR.
The Net Promoter Score (NPS) and customer feedback can help you find out where the issue could be hiding.
CloudZero allows engineering teams to drill down and inspect the specific costs and services driving their product, features, and more. Group costs by feature, product, service, or account to uncover unique insights about your cloud costs that will help you answer what’s changing, why, and what you can do about it. Click here to learn more.
15. Expansion MRR
An expansion in MRR shows an increase in MRR gained from existing customers over a specific period. For example, this can happen when a user upgrades to a higher-paying plan or subscription.
You can use expansion MRR to evaluate whether a marketing campaign or conversion optimization strategy works.
If you have strong expansion MRR, you can counter churn when upsells and value from upgrades and upsells exceed the value you lose through cancellations.
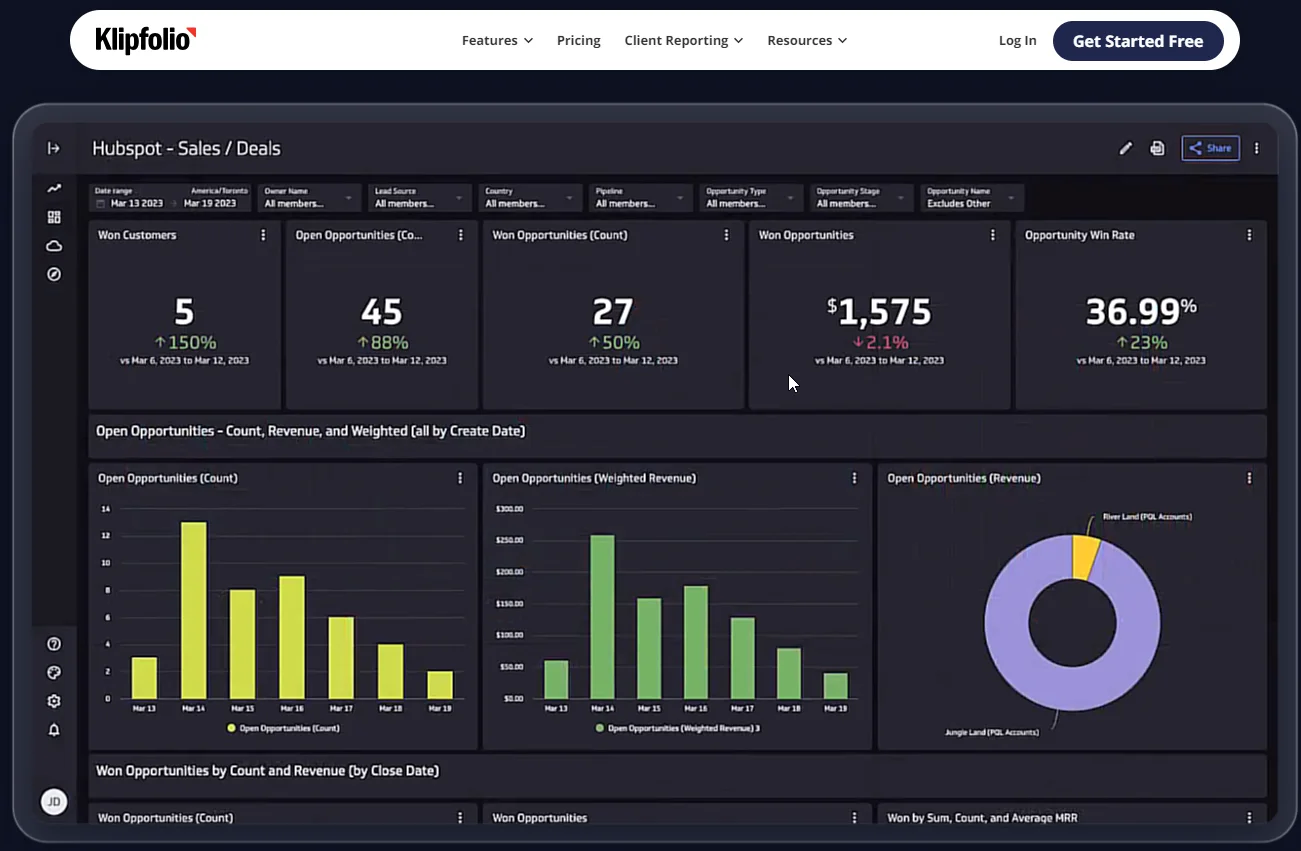
You can calculate it manually using Net MRR or use a metrics automation tool such as Klipfolio to do it for you.
16. CAC Payback Period (Months To Recover CAC)
Your CAC payback period defines how long you need a customer to stay subscribed to break even. Some call this metric positive cash flow.
Months to recover CAC describes the number of months a customer needs to renew their subscription before recovering a revenue amount equal to the amount you used to gain them.
Eventually, you start to collect returns on that investment from the month you break even. This is assuming the customer renews their monthly or annual subscription consistently.
Divide your CAC by the product of MRR and Gross Margin (GM) to calculate your Months to Recover CAC.
Months to Recover CAC = CAC/MRR X GM
Note: Calculate GM by subtracting your SaaS cost of goods sold from gross revenue.
17. Customer Engagement Score (CES)
The customer engagement score (CES) helps you measure the engagement of your existing customers, including your free trial users. You calculate each user’s engagement score based on the actions they take or avoid over time.
These actions may include:
- How often a user accesses your SaaS product or service
- The key feature(s) the user engages with or not
- A set of specific actions a user takes within an application
- Upgrades, such as switching from a free plan or free trial to a paid plan
- Subscription renewals
- The number of support tickets the customer opens
You then calculate your CES by multiplying the weight of a single engagement event/action by the frequency of these actions/events to arrive at an event value. Finally, you add all event values for each customer to determine the customer engagement score.
18. SaaS Cost Of Goods Sold (COGS)
COGS measures how much your SaaS company spends on serving its customers. The following are examples of SaaS COGS:
- The cost of hosting customers’ workloads on AWS
- Software delivery costs
- Cost increases related to extra features or an increase in computing power
- Expenses associated with engineering experiments, including quality assurance
- Updates and patches for security issues
Reducing the costs of goods sold on different product lines can boost your profit margins. This can also enable you to lower prices or increase your discount rate, which can help you attract more customers.
Keeping SaaS COGS low is not always a good thing. Why?
This is because reducing inputs might require tradeoffs.
Suppose your company reduces its AWS EC2 budget. The decision may limit your application’s scaling capabilities, further deteriorating its performance, availability, and overall customer experience. It may also result in user security threats.
Depending on what finance and engineering recommend, you must first decide what tradeoffs to make or which risks to mitigate.
19. Net Profit Margin
This is the ultimate metric you want to increase even if you won’t break even in the next few years. Net profit heavily depends on several variables, some of which are outlined in the metrics presented here. These are all part of cloud economics for SaaS companies.
There is another metric many SaaS businesses find difficult to measure, but one that is crucial to find out if you are on track to making a profit.
20. Unit Cost
Unit cost can refer to cost per customer, per feature, per message, and even per team in the SaaS industry. This metric should help you visualize the relationship between cloud computing costs and various aspects of your business. Here are some examples:
- What specific features of your application are the most expensive to run?
- What features do customers actually use?
- Are there features you can decommission without losing significant revenue?
- Which customer is the least profitable for you?
- How much does each transaction cost?
You can also monitor unit costs to see how changes in inputs impact outputs. What happens, for example, when you add extra features to your application?
Unit costs inform you how one area of your business, such as an engineering team or specific developers’ actions, affects your entire company’s finances.
One big problem remains. In most SaaS monitoring tools, you cannot see costs in this way or map them to the way you work. An AWS bill, for example, doesn’t provide details about what, who, or how your EC2 instances were used.
How To Understand, Control, And Improve Your SaaS Cost Reporting Today
CloudZero helps SaaS teams measure COGS, identify unit costs (such as cost per customer or feature), and optimize cloud spend. You can view these SaaS metrics by role, in the context of engineering, finance, and FinOps.
- Engineering can view cost per environment, feature, team, deployment, etc. This enables them to see the cost impact of their technical decisions in near-real-time so they can build more cost-effective solutions.
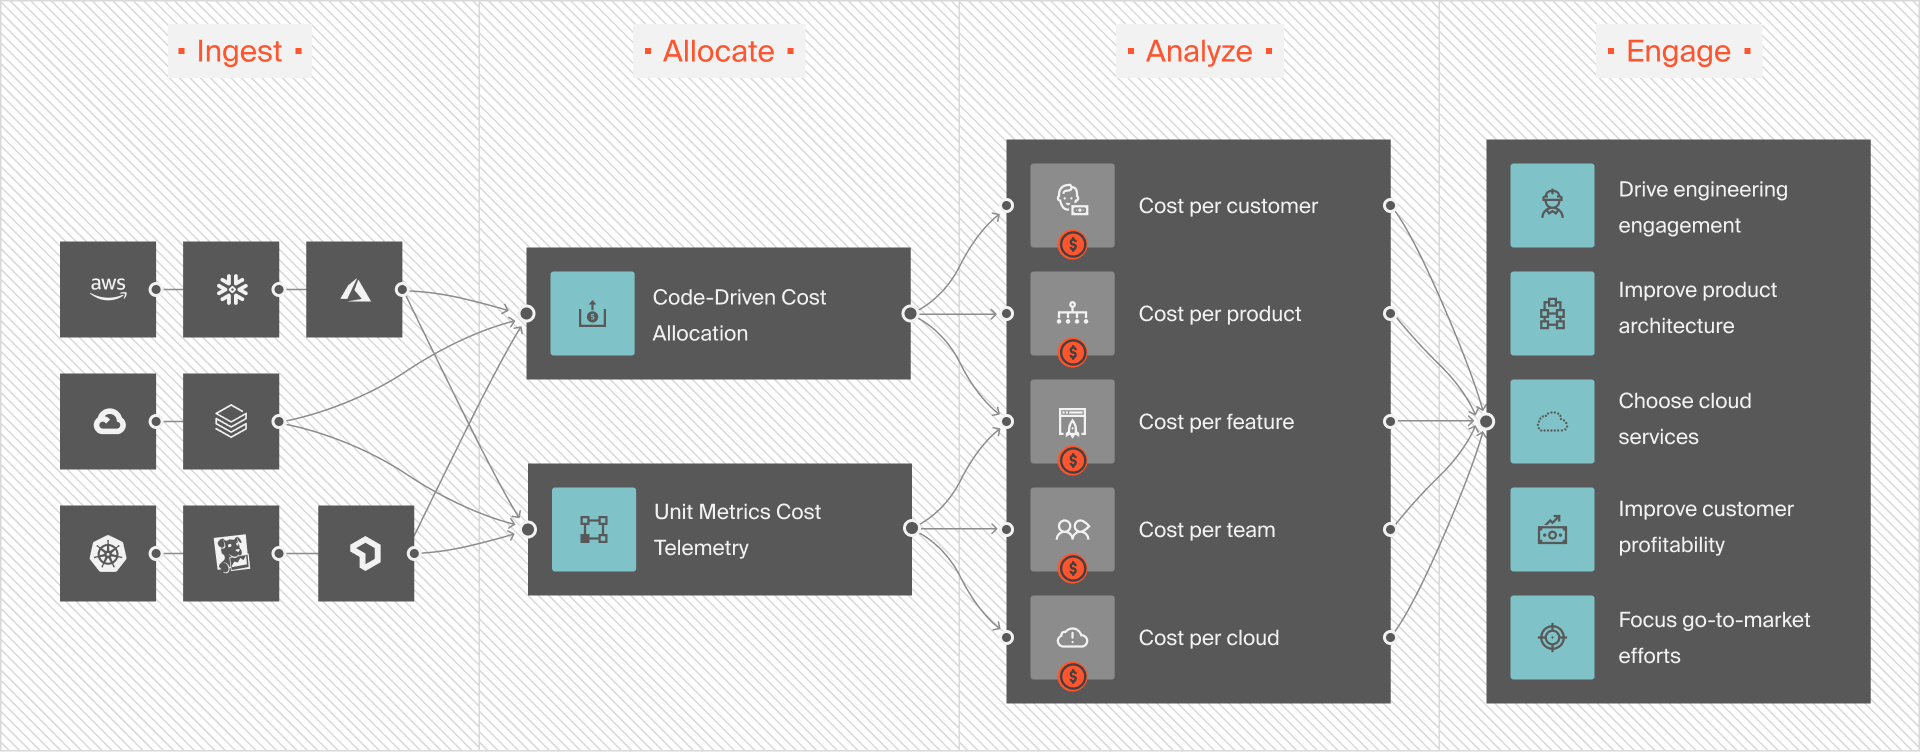
- Finance can immediately view actionable insights such as cost per individual customer, project, and service. This empowers them to set profitable prices for your product or service (including discounts and renewal offers) based on the customer’s actual usage.
- FinOps can calculate advanced insights such as how onboarding a specific number of customers would affect costs, perform gross margin analysis, and more.
Unlike traditional cost tools, CloudZero doesn’t just show you totals and averages. Instead, you can view your costs down to the specific products, processes, and people driving your spend. This means you can pinpoint where to cut costs or increase investment to maximize ROI.
Want to experience CloudZero risk-free?  to get started.


