
There are many tangible benefits to using containers for your computing needs. Containers help break large applications into smaller packages that are more agile, scalable on-demand, resilient, cost-effective, and less resource-hungry than monolithic apps or workloads running on traditional virtual machines (VMs) or bare metal servers.
They also enable developers to develop applications in one environment, deploy them in another, and run them anywhere.
Using a good container orchestration tool can help you eliminate the complexity of running constantly changing containers at large scale. Yet, you’ll need a powerful container monitoring tool to ensure your containers are in good health, perform correctly, and are cost-efficient.
In this guide, we’ll cover 15 of the best container monitoring tools you can use today, as well as highlight the benefits of container monitoring and how you can get started.
Table Of Contents
What Is Container Monitoring?
Container monitoring refers to the practice of observing, tracking, and measuring various metrics, logs, and other KPIs of a containerized application and microservices environment. It is a subset of observability, which includes log aggregation and analysis, visualization, tracking, and anomaly detection, and alerting.
Monitoring containers is a continuous process to ensure that decoupled applications (and often, a microservices environment) are performing at their best.
How does this compare to container orchestration?
Container monitoring aims to observe and monitor container systems. In contrast, container orchestration automates the process of deploying, running, and managing containers, such as spinning up new containers, scheduling tasks, allocating resources, balancing loads, and self-healing.
playbook
The AI Cost Optimization Playbook
Traditional cloud cost management is broken. Here’s why — and how to make the switch to cloud cost intelligence.
The Challenges Of Monitoring Containers
The following are some container monitoring challenges you should be aware of.
- Because containers are temporary, their metrics, logs, and other data disappear immediately after they close. You must collect the data before the containers terminate and store it in a central location for analysis.
- You need to have robust criteria to determine whether your containers’ health and underlying architecture meet your computing needs.
- Deploying and running containers in a microservices architecture enables cloud-native use cases. They also make monitoring containers and the underlying infrastructure more complex.
- Many container images run a lot of instances and spin up new ones quickly to replace the ended ones, which can be challenging to keep up with.
- It is difficult to discern which metrics to measure since containers share resources such as operating systems, binaries, and libraries, as opposed to virtual machines, which use their own OSes.
- Visibility issues can cause performance, security, networking, and other operational risks.
- Most tools do not provide thorough cost monitoring for containers.
Depending on your use cases, you might encounter more container monitoring challenges. So, what would be your motivation to conquer these challenges?
Container Monitoring Benefits: Why Should You Monitor Containers?
Monitoring containers offers several benefits, enabling you to:
- Check if your containers and microservices are running smoothly.
- Determine the cause of a problem and solve it quickly to avoid future problems.
- Analyze how your containerized applications and underlying infrastructure use cloud resources to optimize engineering costs.
- Examine the extent of a container’s problem in production and take steps to prevent it from affecting other containers, dependencies, or host infrastructure.
- Assess user experiences to determine where to improve them.
- Use historical monitoring data to plan and allocate the right amount of computing resources in the future.
- Observe how changes in deployments or testing affect your container system or apps.
- Container monitoring helps discover problems early, enabling you to maintain peak performance and security proactively.
15 Container Monitoring Tools
Here are some of the top container monitoring tools you can use to monitor environments like Kubernetes, Docker, Openshift, and Rancher.
1. Sematext
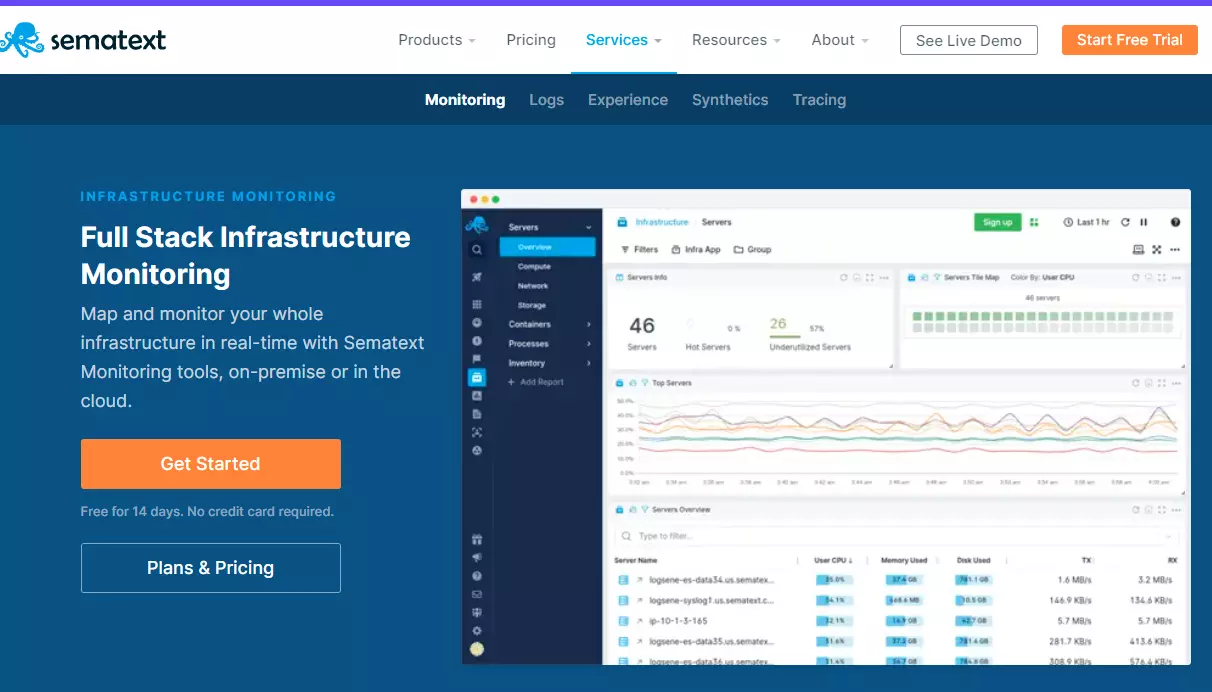
Sematext provides container monitoring for Docker, Kubernetes, Rancher, and Docker Swam with full observability. The Sematext agent (metrics) and Logagent (logs) run as tiny containers, collecting both container and host metrics and logs in Docker and Swarm, as well as a DaemonSet in Kubernetes, or as a Docker Swarm service with Marathon and Rancher.
It also offers orchestration support, sensitive data masking, auto-discovery for new containers, log enrichment, anomaly detection, and alerting. Also, you can use it on-premises or in the cloud.
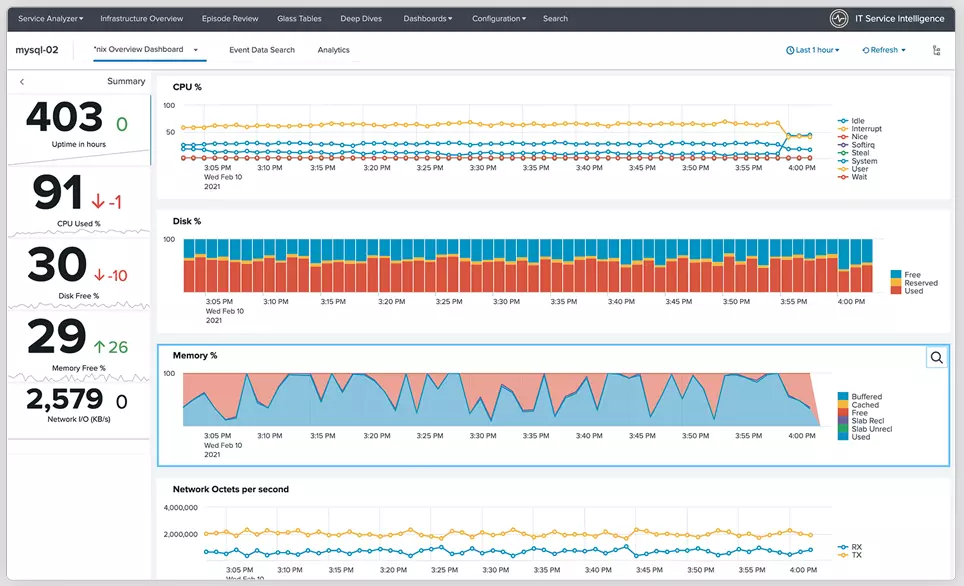
2. SolarWinds
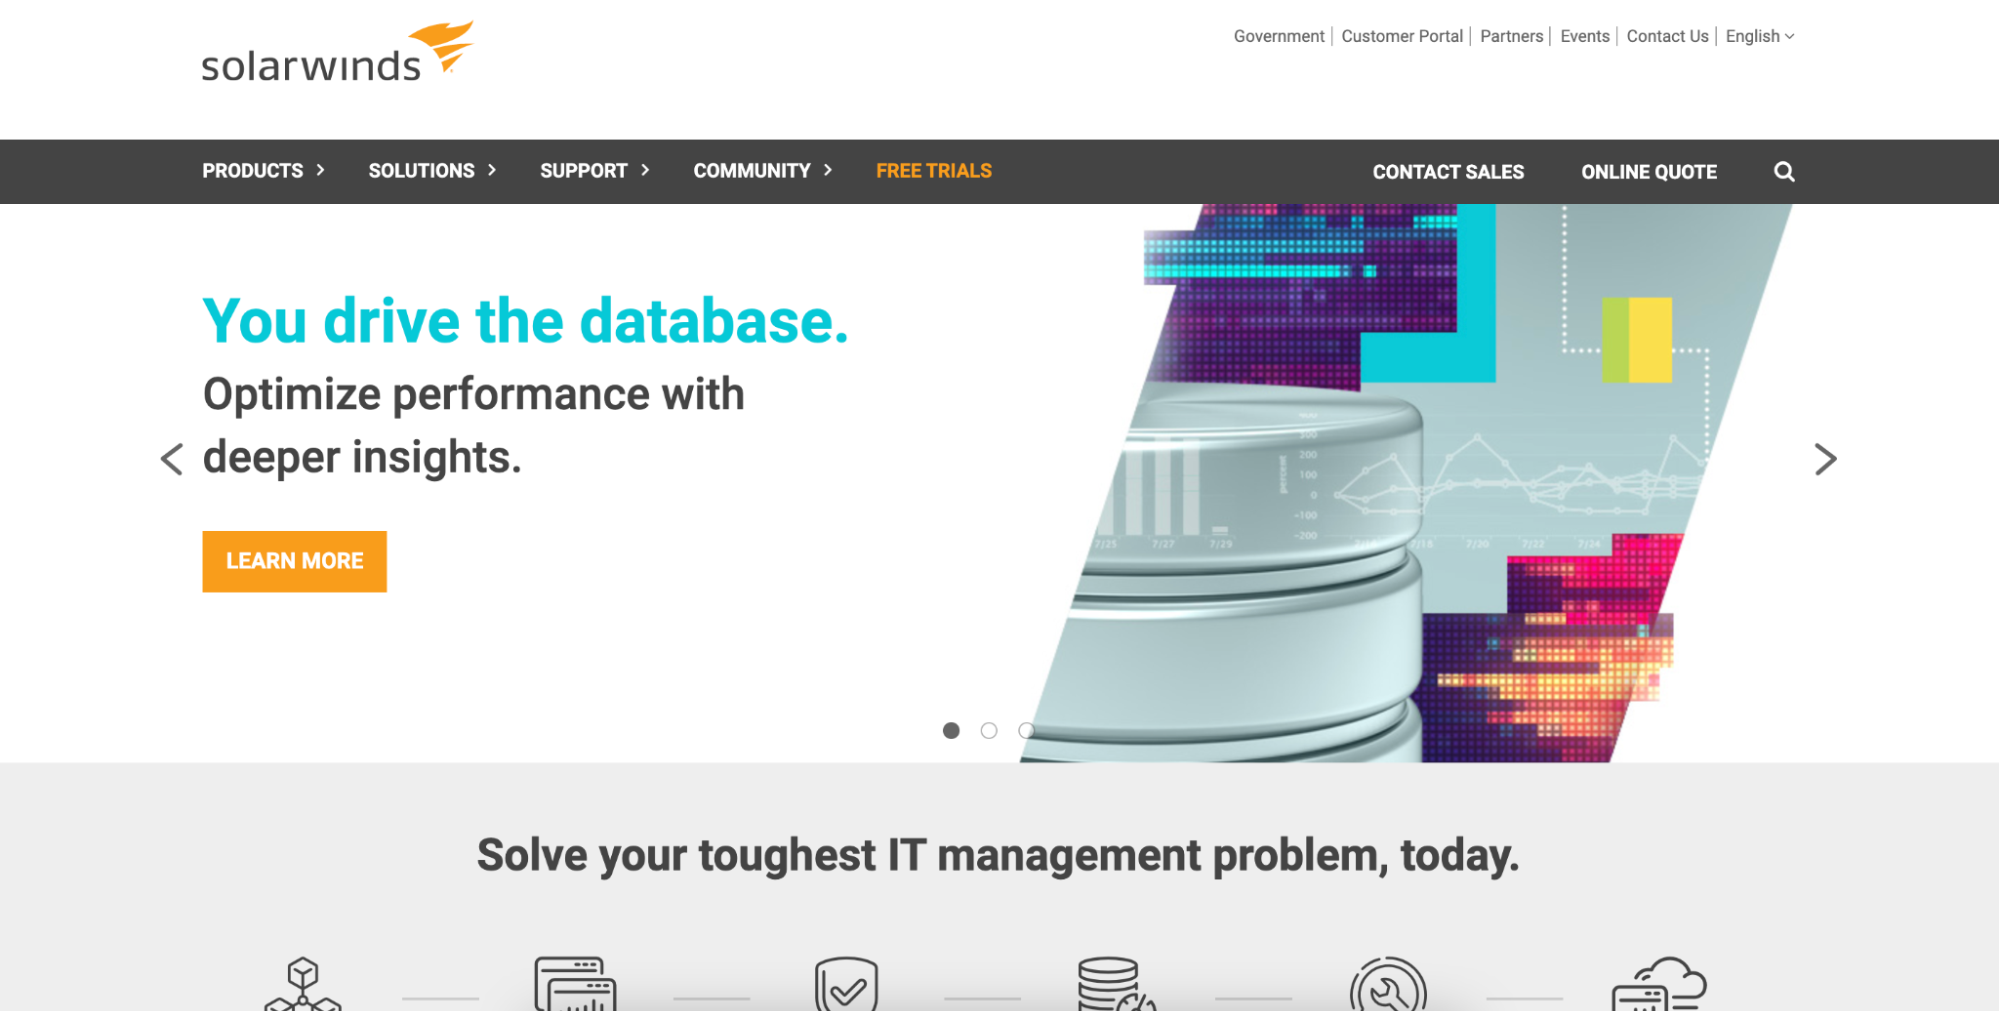
SolarWinds provides multiple tools for monitoring containers in various container environments, including Docker, Kubernetes, Docker Swarm 17.12 and later, and Apache Mesos. You can monitor containers through its Orion Platform. Also, you can use SolarWinds AppOptics (SaaS-based APM) for Kubernetes, Loggy for log management, and Pingdom to monitor real user experiences.
Together, the three SaaS-based services provide deeper insights and faster troubleshooting. SolarWinds also collects metrics and logs in Linux, Ansible, Snap Chef, and Windows environments. Also, expect anomaly detection and alerting out-of-the-box and engaging dashboards for visualization.
3. Dynatrace
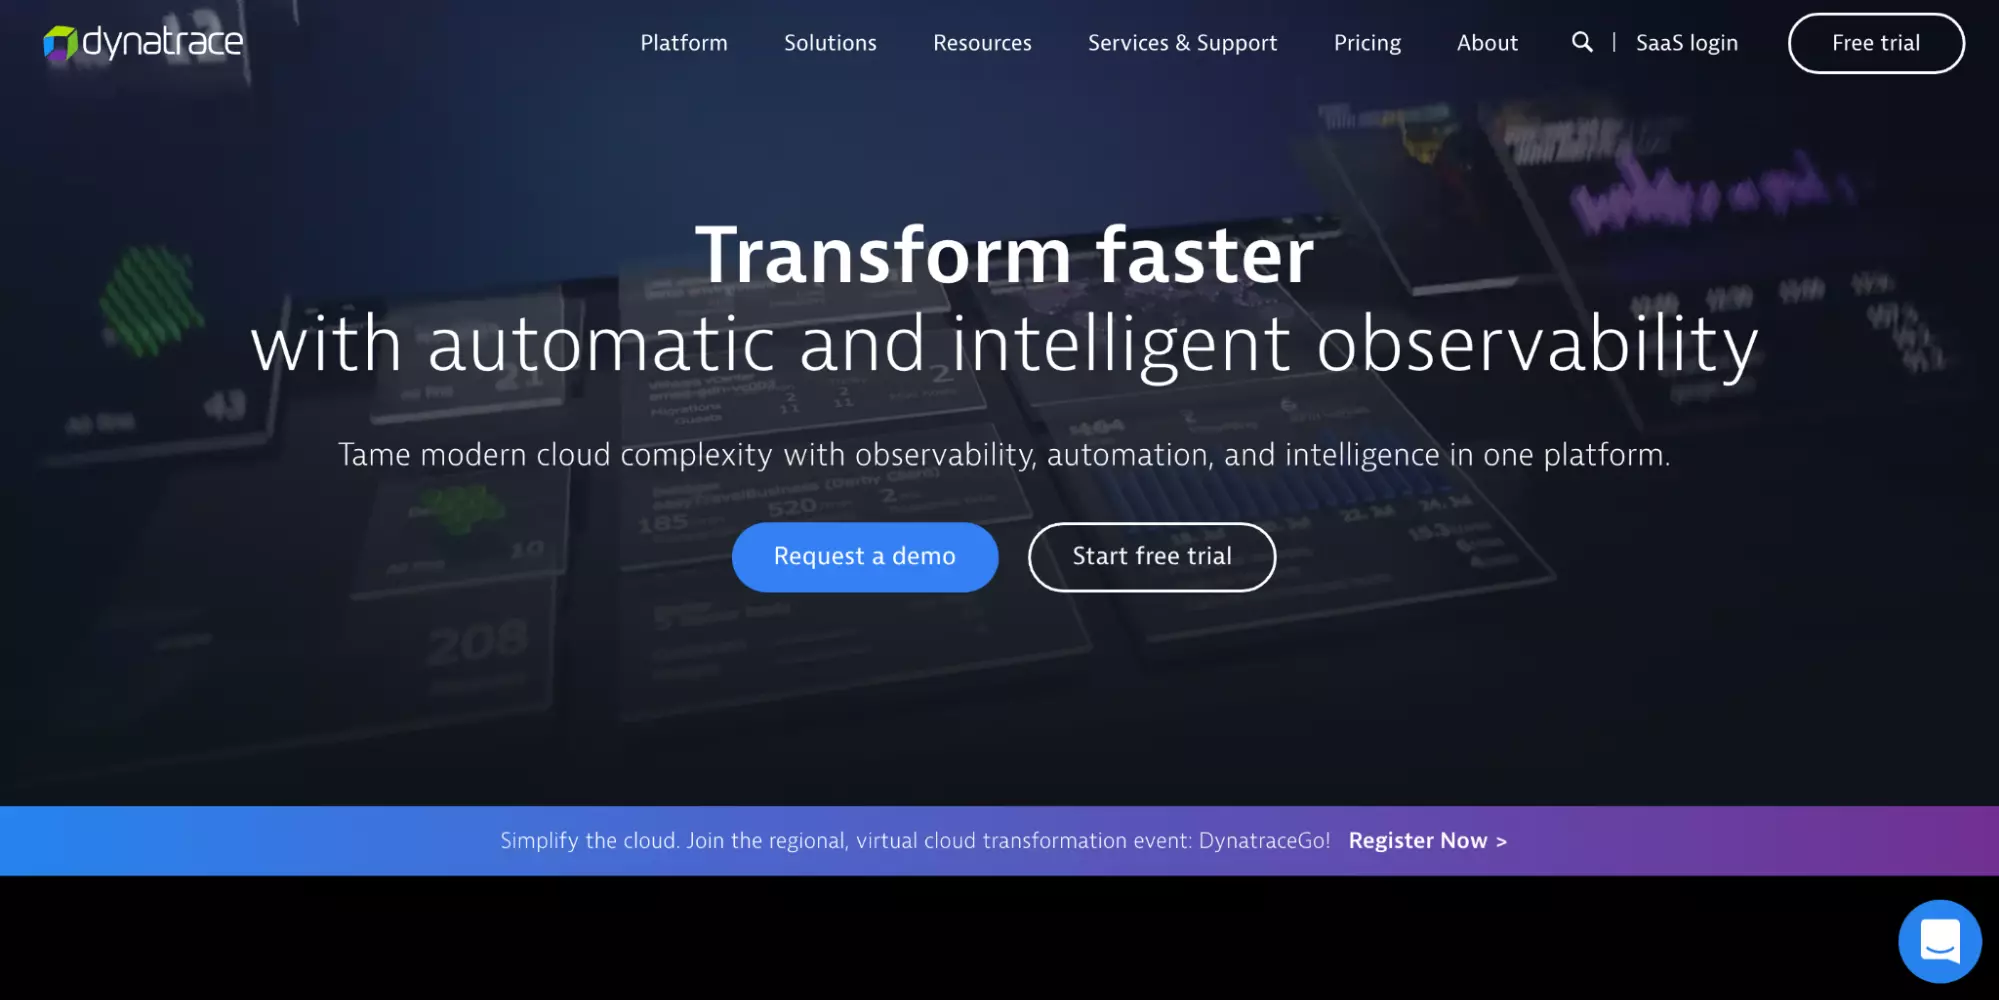
Dynatrace may fit the bill if you need a tool that doesn’t require installing multiple agents per host. You only need to install Dynatrace OneAgent once per host then let it run on its own. It monitors your container clusters from within by injecting itself into them.
Dynatrace is also ideal for monitoring container health in hybrid environments, Docker, Kubernetes, OpenShift, Cloud Foundry, AWS, GCP, and Azure. Besides collecting metrics and logs, you can also monitor processes, capacity utilization, and network utilization. You can also create custom metrics based on your log files.
4. Datadog
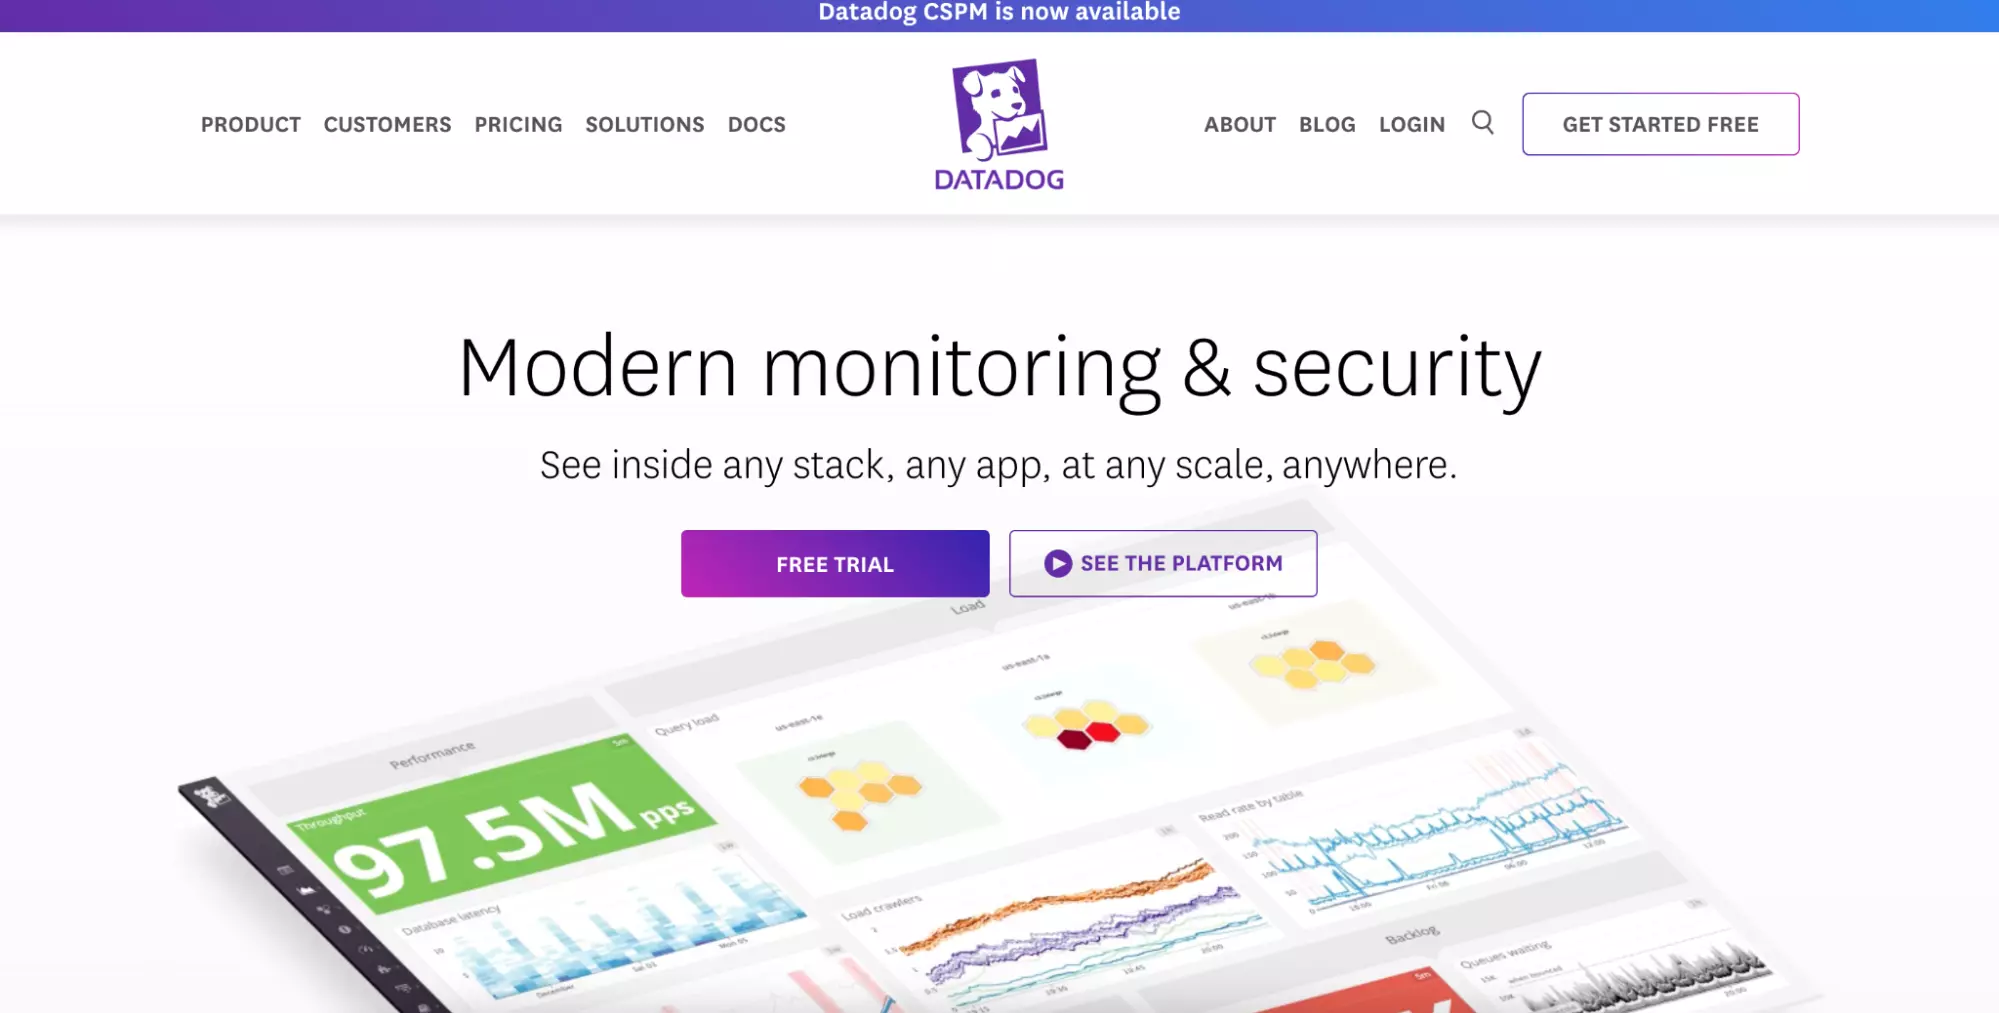
The DataDog Live Containers monitoring platform can monitor containers running on Docker, Kubernetes, and ECS. You need only install the DataDog agent to collect metrics, logs, traces, and events data from multiple sources, similar to Dynatrace. You can visualize containers in real-time, group and filter them in one place using its Container Map. Live Containers auto-discovers new containers. It also offers resource utilization, tag-based anomaly detection, distributed tracing (and APM), and integrations with over 20 different monitoring tools, data sources, and more to enable complete container observability.
5.  and Grafana
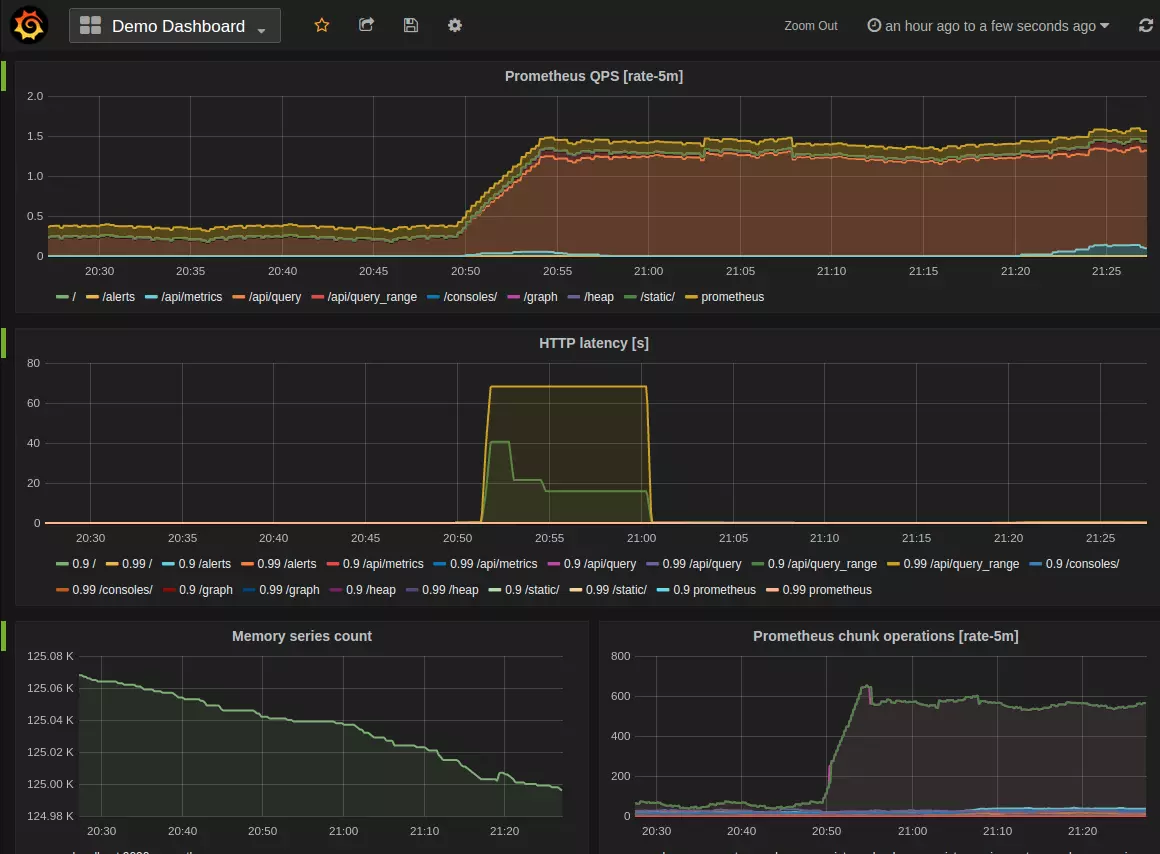
Check out Prometheus with Grafana if you are looking for an open-source container monitoring solution. Prometheus pulls metrics from containers running on multiple platforms, including Docker, Kubernetes, and OpenShift. Grafana provides a platform for visualizing, analyzing, and presenting the data in beautiful graphics.
With the alert manager in Prometheus, you can set up triggers that send you automatic alerts whenever a trigger occurs. It can be used with MySQL, Prometheus, Elasticsearch, InfluxDB, Redis, and PostgreSQL. It is important to note that Prometheus does not support monitoring containerized apps through the Docker target. Additionally, since the pair is open-source, you need to configure and update it yourself.
6. ElasticSearch and Kibana
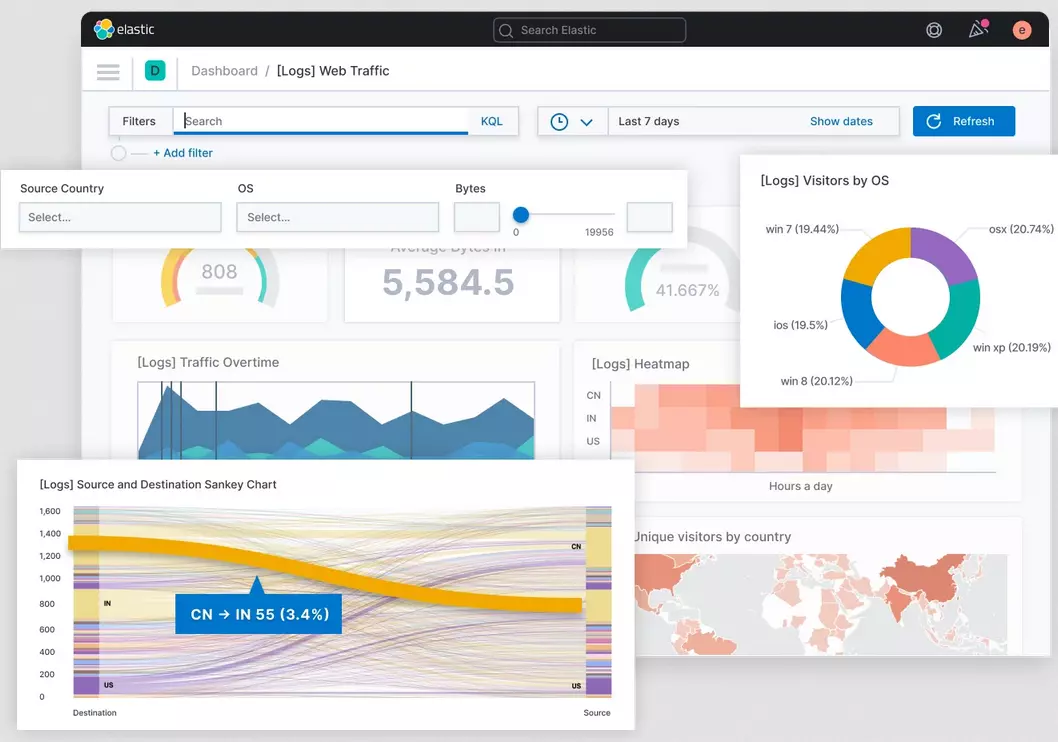
The ELK/Kibana pair beats the Prometheus/Grafana pair for teams who prefer to monitor logs over metrics. By adding LogStash and Beat to that pair, you get an ELK stack that you can use to pull data from anywhere, in any format. Then you can search, analyze, and visualize it in real-time.
Kibana displays the data in graphs, sunbursts, charts, histograms, and more. With Elasticsearch, you get a full-text solution developed in Java, a data structure based on JSON documents (schema-free), and it works in various container environments. They are both free, open-source, DIY, and require a fair amount of setup, so they are best suited to teams who know what they are doing from the beginning.
7. Sumo Logic
Until July 29, 2020, Sumo Logic gave engineers a unified view of observability statistics, such as metrics, logs, and traces. With it, you could monitor different container architectures, such as Kubernetes, Docker, and Amazon Elastic Container Service (ECS).
That same day, Sumo Logic introduced Span Analytics. It enables you to search, query, and analyze structured and unstructured data such as metrics, logs, and transaction traces.
The Sumo Logic Query Language lets you detect issues by examining multiple telemetry sets – or by building queries with a UI and aggregating results. Also, you can conduct real-time monitoring of your users, such as collecting data about their device, geolocation, and browser.
8. Splunk
Splunk provides a robust infrastructure monitoring solution. It extends that service to monitoring container environments in real-time on a highly distributed and complex scale. It uses a slightly unique method of listening in on and collecting container data.
For example, the app offers a Kubernetes Analyzer for monitoring Kubernetes environments (hierarchy view of nodes, pods, and containers) and a Docker-collectd-plugin for collecting data from Docker containers.
Furthermore, it supports RedHat’s OpenShift and Amazon’s ECS. Additional features include digital experience monitoring (real-user monitoring), dynamic cluster maps (Kubernetes), contextualized traces, metrics, and OpenTelemetry Instrumentation.
9. cAdvisor
The Container Advisor is an open-source container monitoring tool that works well with Kubernetes and Docker Swarm and other metrics, logs, and events aggregation solutions like Prometheus.
For example, in a Kubernetes architecture, the cAdvisor agent integrates into the kubelet to collect resource and network usage statistics. This enables it to measure the container performance on a node level, not per pod. Container Advisor does not store data for long-term use, so if you want the data to last for some time, you might need to find a more dedicated tool.
10. Sysdig
Security considerations make Sysdig a good continuous container monitoring system. It offers Kubernetes, cloud, and container monitoring, and recently acquired Apolicy to enhance its Infrastructure-as-Code security capabilities.
You can use it to monitor security data in your Docker, OpenShift, Azure AKS, Google Cloud Platform, Rancher (SUSE), VMware Tanzu, and AWS (ECS, EKS, Fargate, Lambda, etc.). You can expect it to collect cloud logs and use syscalls to detect threats.
It alerts you to any anomalies, such as compliance risks, using tools like Slack and ServiceNow. Sysdig is also popular for offering native-level integration with Prometheus.
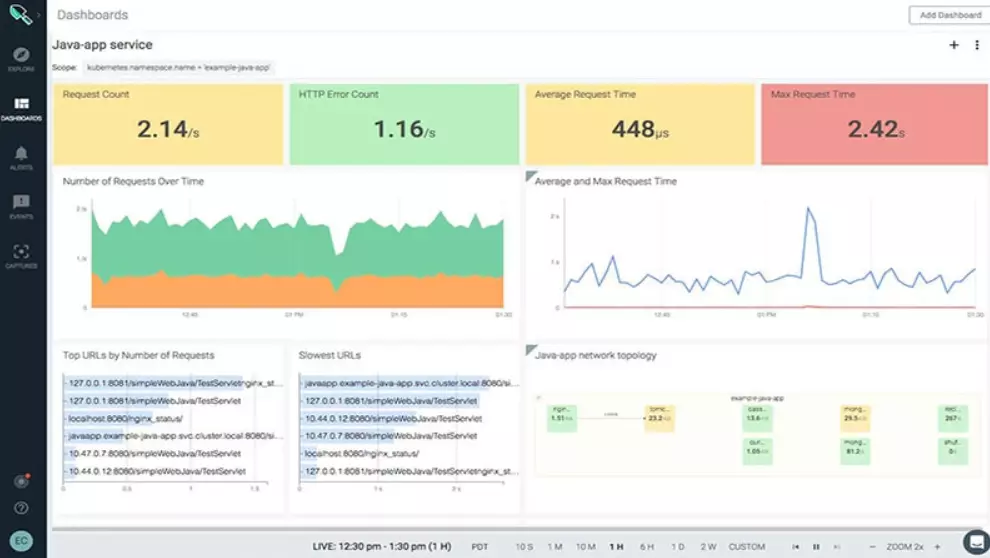
11. New Relic
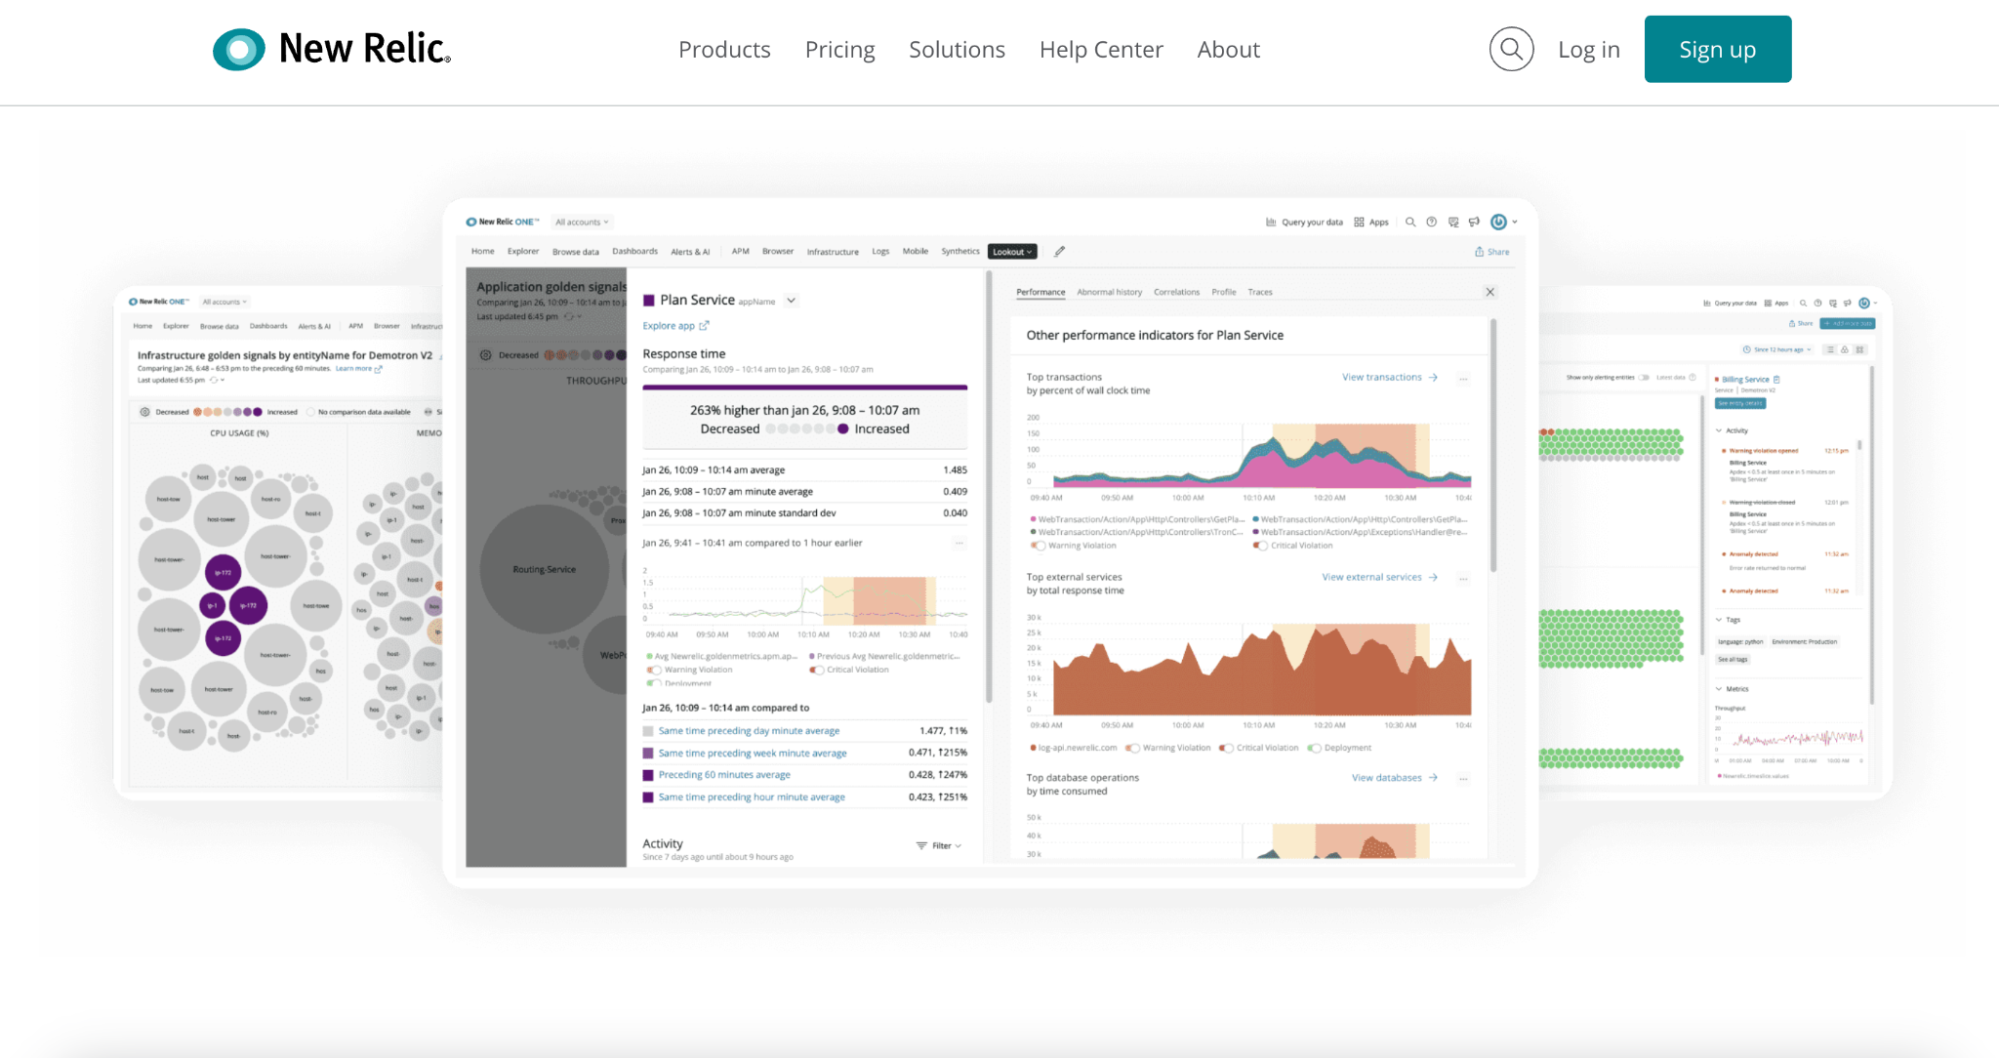
Among New Relic’s features are its comprehensive infrastructure, browser, API management, mobile and serverless monitoring capabilities. Also supported are metrics, distributed traces, logs, and events data for monitoring containers in Docker and Kubernetes environments.
The Pixie tool enables you to debug your code in real-time without sampling. To see how your nodes, pods, containers, and the entire application interact, you will need to install, for instance, New Relic’s Kubernetes integration. You can also monitor the usual suspects; end-user experiences in real-time, resource utilization, network usage, and supporting infrastructure.
12. Scout
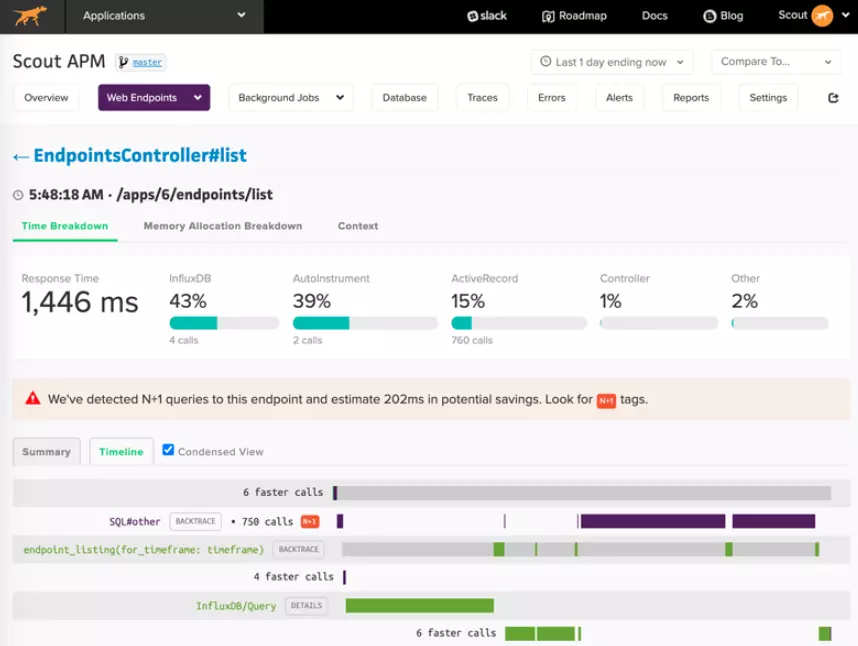
Scout offers hosted monitoring, which is an upgrade over cAdvisor. Scout, for example, keeps data for longer, pulls data from more hosts and containers, and triggers alerts based on specific metrics.
It also supports many plugins, which allow you to aggregate data from many sources. Also, Scout is suitable for monitoring Elixir and Ruby apps for applications that run on databases or the cloud.
Since Scout is hosted in the cloud, it is less stressful to set up and run. In addition, it tutors engineers on how to use StatsD and Ruby to create scripts that interface with the Docker Events API and Stats API.
13. MetricFire
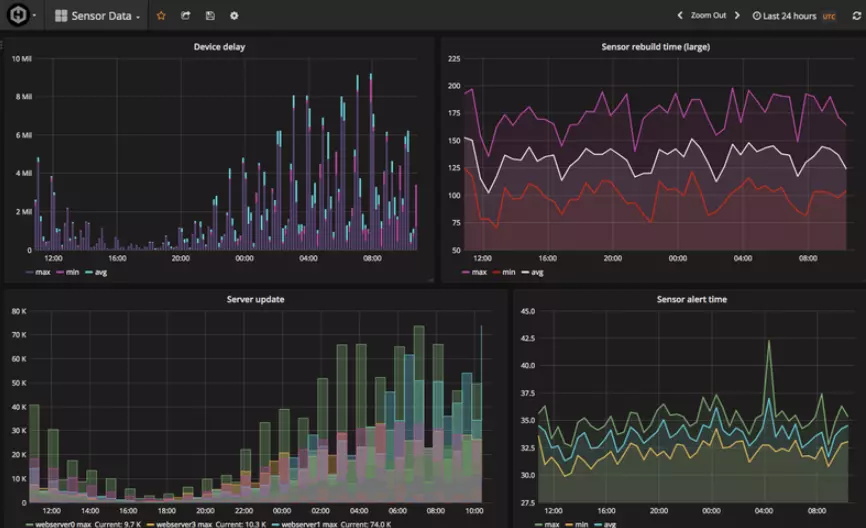
MetricFire will feel familiar since it is based on the open-source Prometheus/Grafana/Graphite solutions. MetricFire provides the hosted version of that combo, meaning that it offers all the dashboards and plugins that the open-source projects have, in one place.
You can use it to see the status of Docker and Kubernetes containers in real-time, using Grafana’s beautiful dashboards. It also integrates with cAdvisor, Rancher, and Prometheus.
14. Jaeger
Jaeger is a distributed solution that works out-of-the-box with Istio, Google’s service mesh implementation. A single call can have numerous requests between various services. Jaeger is particularly useful for debugging distributed architectures (like cloud-native microservices) and large-scale transactions.
You can deploy it on Kubernetes, Openshift, and Windows. Then you can integrate it with Prometheus, Alertmanager, and Grafana to maximize its capabilities. Jaeger is a good solution for transaction tracing (analyzing root causes and service dependencies and monitoring latency, performance, and distributed transactions) and troubleshooting.
15. CloudZero
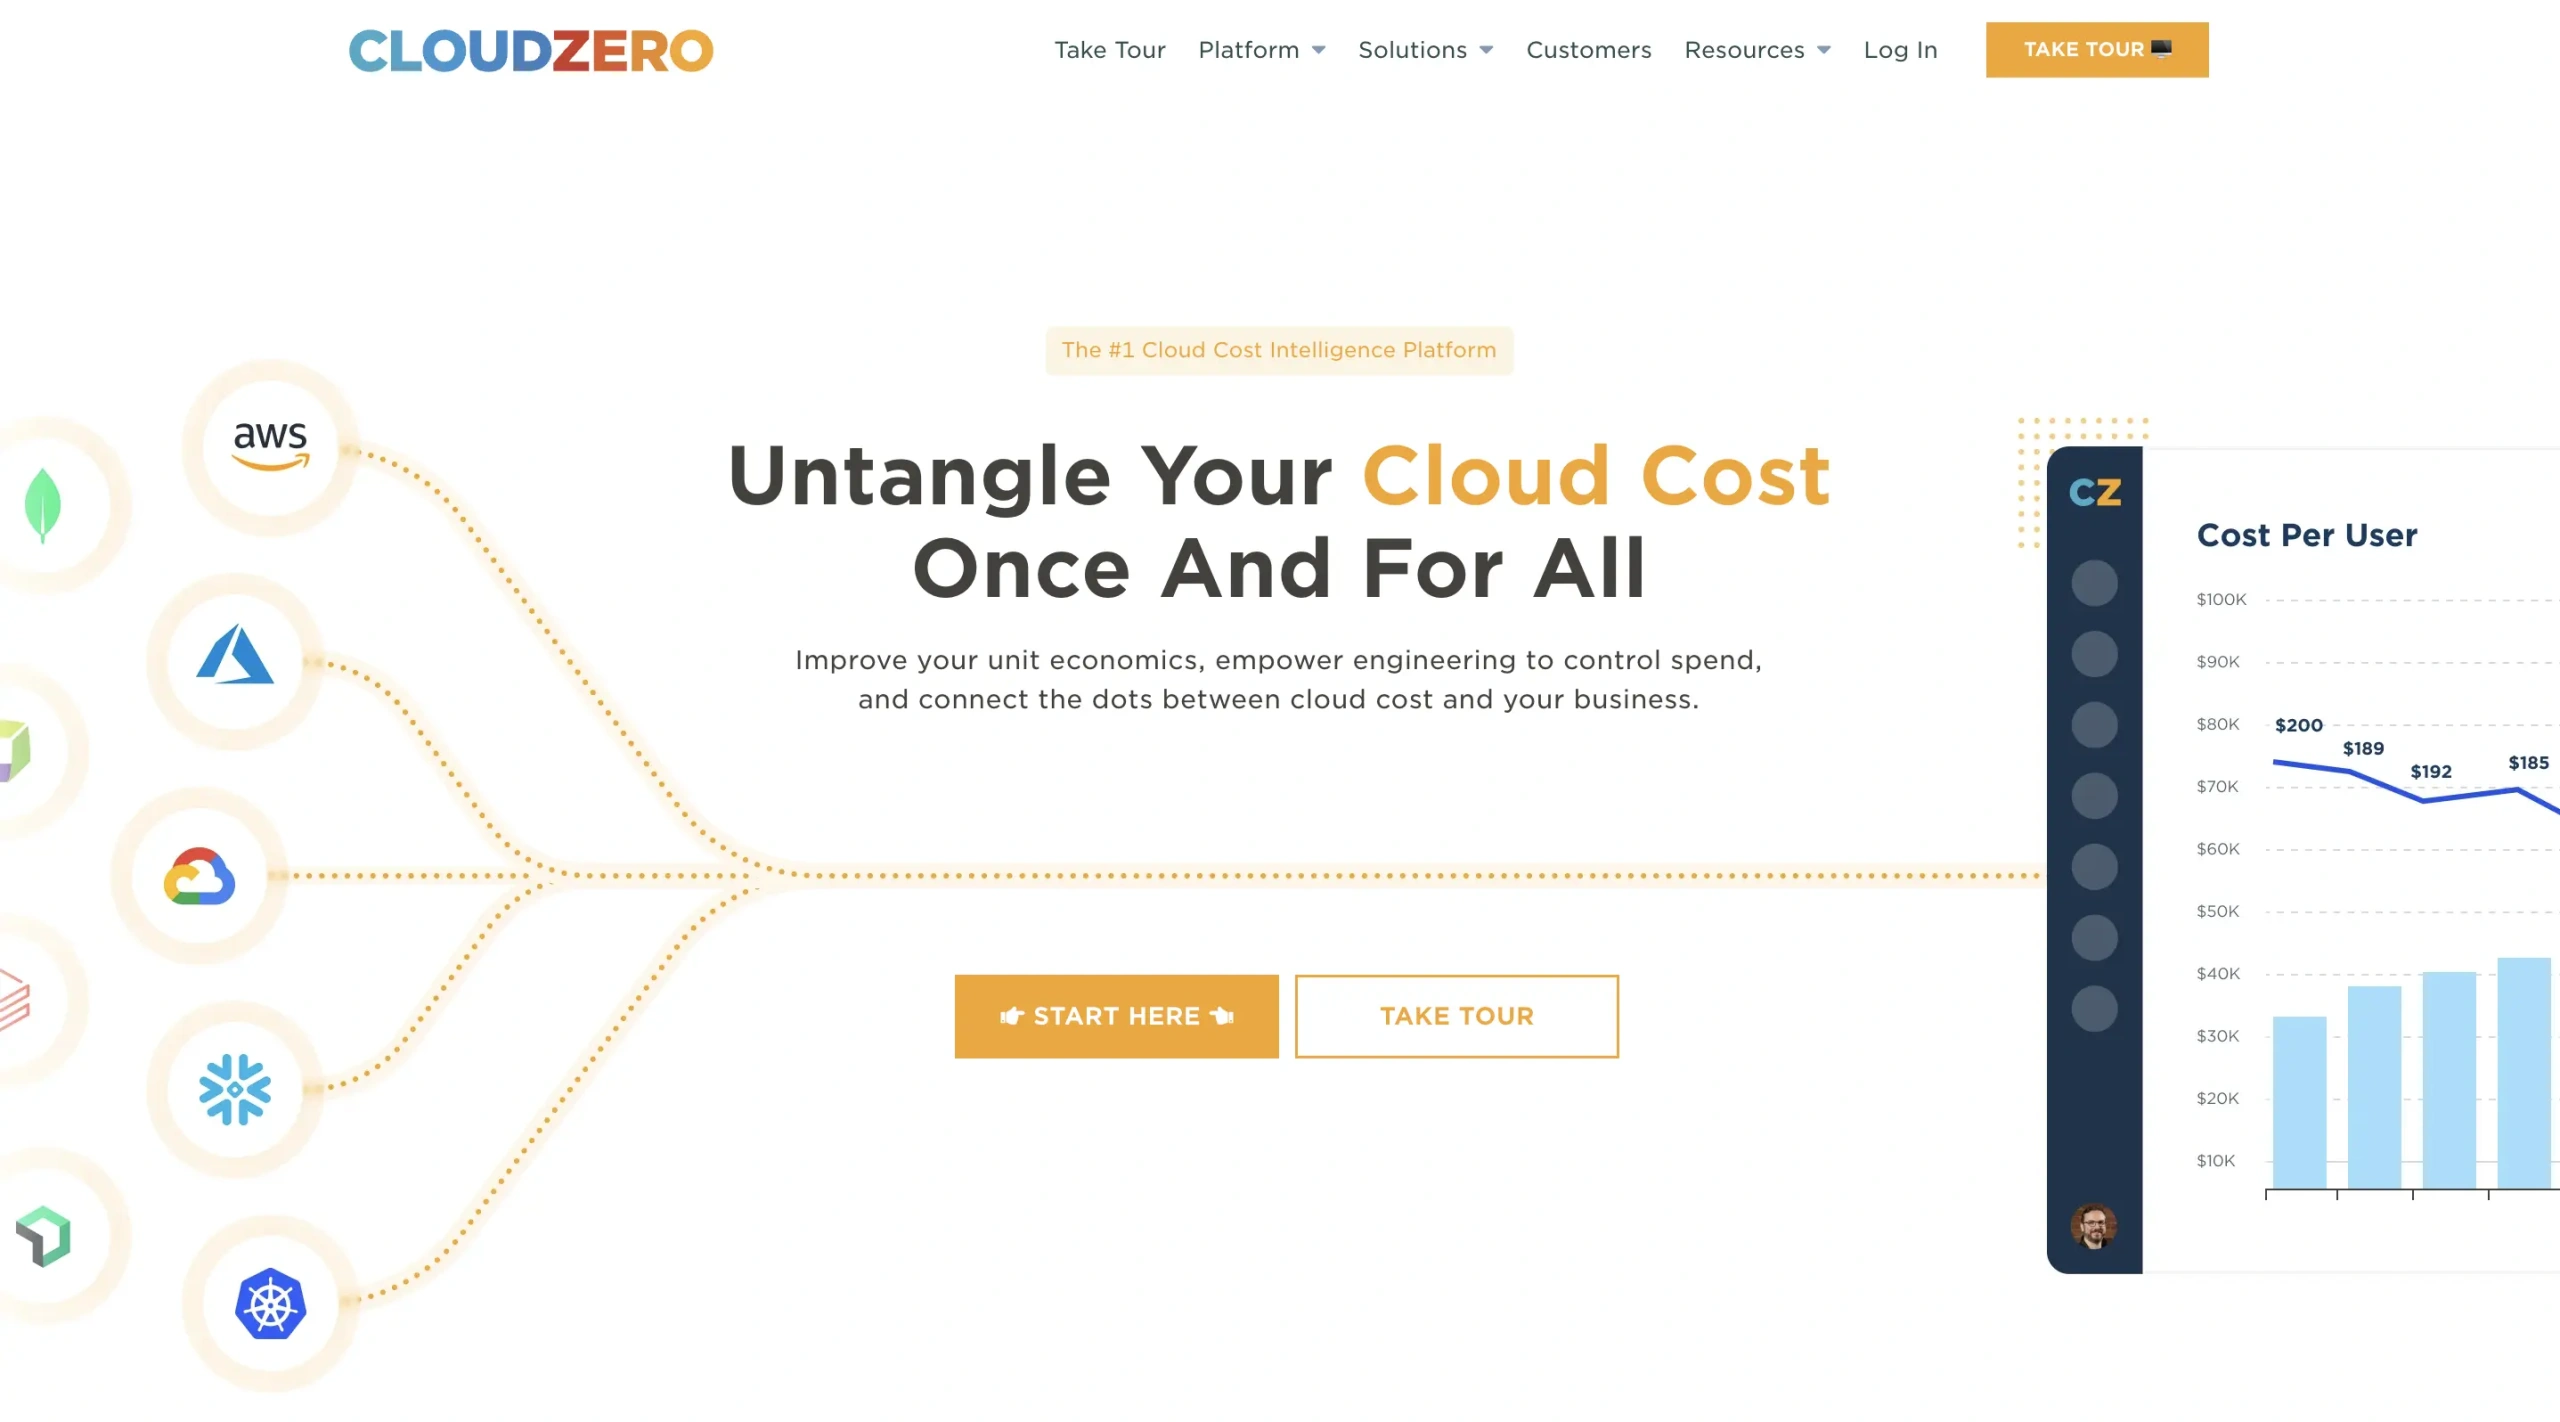
Cost tracking in container infrastructure is notoriously difficult. This is because of numerous dynamic components that obscure cost monitoring. With CloudZero, you can see what’s happening inside Kubernetes, whether or not it’s containerized. No manual tagging is necessary.
CloudZero helps you generate rich and visually stunning insights into key aspects of your Kubernetes infrastructure, including costs per feature, microservice, team, or customer.
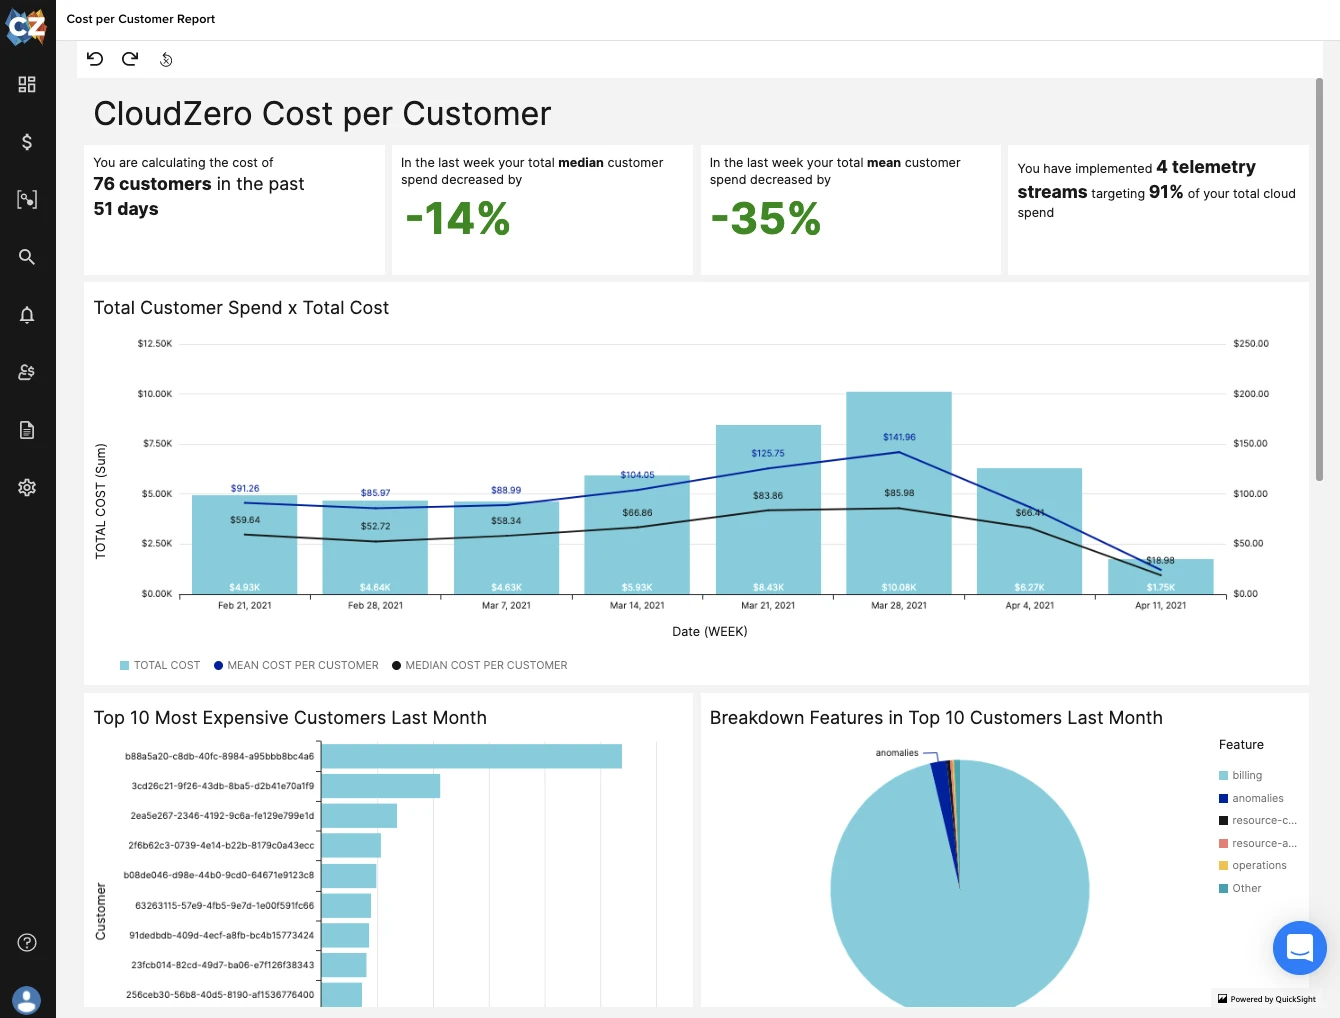
You can use these unit cost economics and combine them with CloudZero’s cost optimization recommendations to optimize your engineering costs, including how you could revise your pricing to maintain healthy gross margins.
 to find out how it will reduce your cost of running containerized applications.


