Kubernetes (K8s) is the most popular container orchestration platform today. But it can also be quite complex. To overcome this management challenge, you can deploy your Kubernetes containers using the Google Kubernetes Engine, which is a fully managed service.
Yet, to get the most from GKE, you still need to follow best practices. The following tips and best practices for monitoring GKE clusters will help you get started.
What Is Google Kubernetes Engine Monitoring?
GKE monitoring refers to tracking the health and performance of your Kubernetes nodes and clusters in Google Cloud Platform (GCP).
Monitoring in GKE uses logs and metrics to capture, analyze, and deduce the status of your Kubernetes environment — and it forms the foundation of Kubernetes observability across your clusters.
You can use GKE monitoring to measure resource usage, associated costs, security posture, application performance, alerts, and more. You can also use custom metrics and an alerts policy to troubleshoot multiple workloads and performance issues.
Report
Finance needs to prove AI’s return: CloudZero report
260 senior finance leaders (more than half CFOs) told us why the speed of seeing AI spend, not the size of it, separates who pulls ahead on AI from who gets burned.
Why Is GKE Monitoring Important?
GKE monitoring is a crucial best practice for a number of reasons:
- Tracking resource usage in GKE can help you ensure you are not overusing K8s resources, ensuring their sustained health.
- Monitoring ensures you know the real-time status of your GKE resources, ensuring optimal availability and preventing service outages.
- Observing GKE clusters’ and nodes’ performances enables you to tell if you need more resources to meet your workload requirements.
- Or, you can tell if you can do with fewer GKE resources, effectively reducing your GKE costs.
- With alerts, you can take action quickly if something is about to or does go wrong, preventing small issues from becoming big, sticky problems.
- Monitoring makes it easier to identify the root cause of a problem, helping engineers find the issue quickly and reducing recovery times.
- Monitoring GKE supports thorough cost optimization. You are in a position to maximize your returns on GKE investment when you know what resources to cut, which ones to keep, and which to increase.
So, GKE monitoring is something you’ll certainly want to be doing. But where do you start?
What Metrics To Monitor In GKE
The GKE monitoring metrics you’ll want to track are the ones that help you measure cluster performance, resource usage, and pod performance. You can measure the health status of your GKE environment with a ton of metrics as you can see in this image:
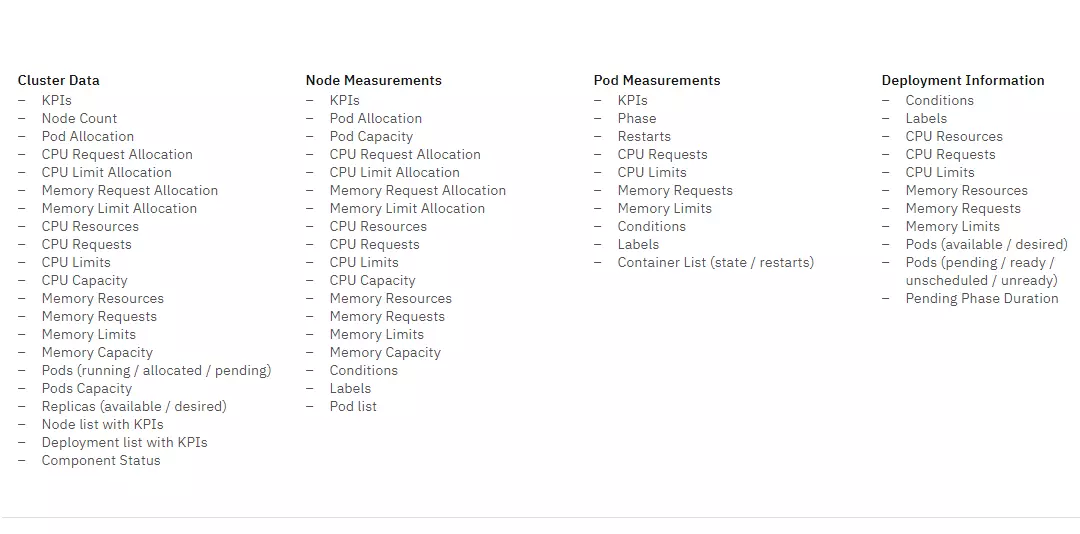
Credit: GKE metrics to monitor for thorough observability
Plus, with the GKE Dashboard, you can track your nodes’ health and load, resource usage, disk performance, and ingress packets per VM, as well as various other metrics specific to Kubernetes.
Credit: GKE Dashboard metrics
In addition, GKE now supports Kubernetes control plane metrics. You can access this capability within Cloud Console under the Control Plane’s Observability tab.
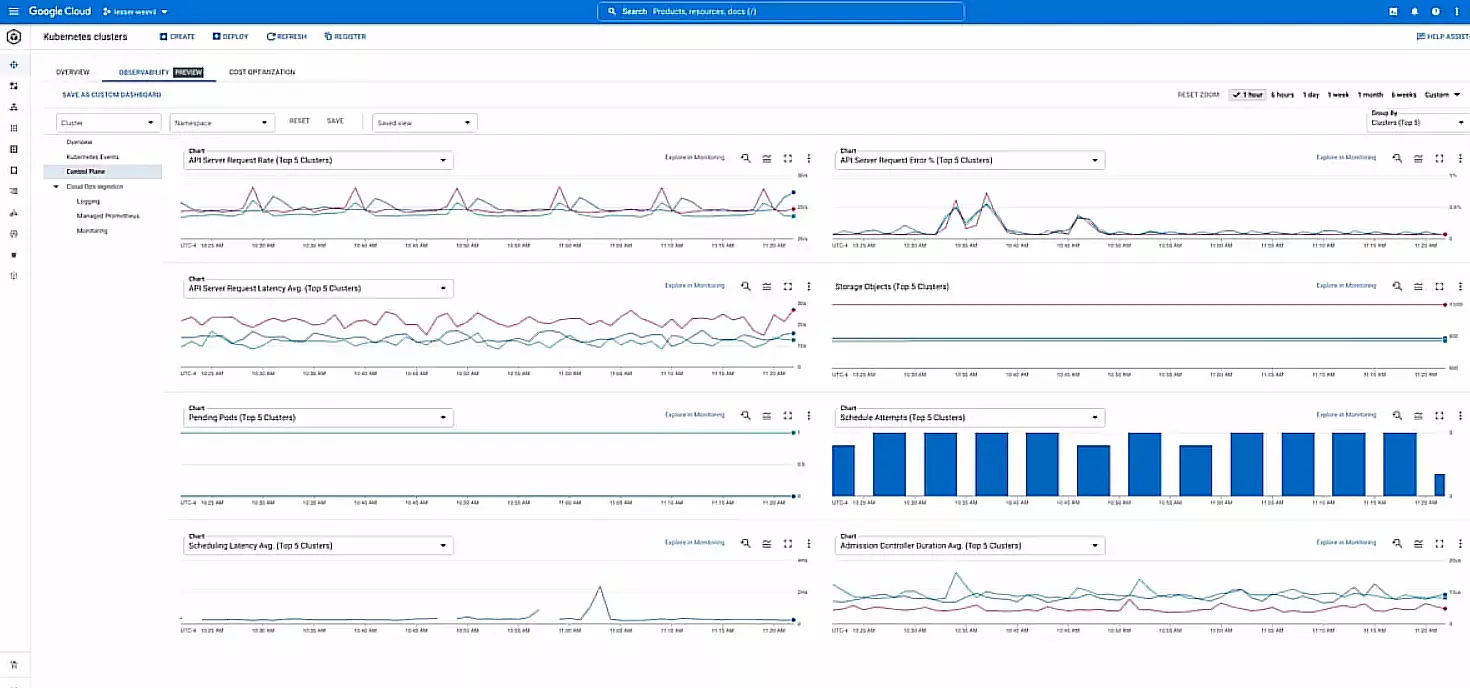
Credit: Control Plane tab within the Google Cloud Console
GKE does fully manage the Kubernetes control plane. However, these newly exposed metrics make troubleshooting issues even more accessible.
For instance, you can use a mix of metrics to assess the health of an API server, such as apiserver_request_total and apiserver_request_duration_seconds, to monitor the API server load, requests that are returning errors, and latency in request responses.
In addition, you can use these new metrics to troubleshoot scheduling issues.
That said, here are the GKE metrics you really want to track to begin with: Pod performance, resources used, and node status.
Pod performance
You can scale GKE pods up or down automatically to meet your application’s requirements at any time and load. This can help you check if you prevent using more resources than the job needs, improving your costs.
You can monitor your GKE pod performance by tracking these metrics:
- CPU utilization – Indicates how much CPU a specific pod is using. You’ll want to scale down your pods if your CPU utilization is low.
- Memory usage – Displays how much memory each pod is using. You’ll want to scale down your GKE pods when your memory usage is low.
The same goes for resource utilization metrics in GKE.
Resource usage
The following metrics can help you track resources used within GKE components:
- CPU utilization – Shows how much CPU capacity your cluster is using. A cluster that has a consistently low CPU utilization may benefit from scaling down.
- Memory usage – Indicates the amount of memory your cluster is using. You may want to scale down your cluster if your memory usage is consistently low.
- Pod count – This is an indicator of how many pods are running in your GKE cluster. You’ll want to scale up your cluster if you discover that your pod count is consistently high.
One more thing.
Node status
Monitor the health of your nodes by collecting, analyzing, and acting on the following GKE metrics:
- Health of the master nodes, including the API server, scheduler, controller, etc.
- Degradation of the master nodes
- Number of nodes available to serve pods
- Node CPU utilization
- Memory usage of a node
- Disk space available on a node for pod placement
- Disk I/O usage per node
- Node network in and out traffic (receive and transmit)
- Errors in node network traffic
- Drop in network traffic between nodes
If you are concerned about how to collect, visualize, and make sense of all these GKE monitoring metrics, the good news is that the platform offers a couple of powerful, in-built monitoring solutions to help you.
What Are The Built-in GKE Monitoring Tools?
The managed Kubernetes platform provides the Cloud Operations for the GKE suite to help you monitor clusters in detail and at any scale.
The suite includes integrations with Google Cloud Monitoring and Cloud Logging — Google’s native services for collecting and analyzing metrics and log data across your GKE clusters. This pair also includes the Google Cloud Managed Service for Prometheus, should you prefer to use Prometheus for GKE monitoring.
The Cloud Operations for GKE suite includes the following benefits:
- View key cluster metrics, including CPU utilization, memory utilization, and the number of open incidents.
- Improves infrastructure monitoring. The GKE dashboard includes 27 more out-of-the-box metrics as part of the free tier than the previous (and now deprecated) Legacy Logging and Monitoring suite, which included just 17.
- Analyze clusters based on their infrastructure, workloads, or services.
- Get a wider range of resource types to better distinguish between Kubernetes resources, as well as more metadata to filter and group your metrics.
- Monitor namespaces, nodes, workloads, services, pods, and containers.
- SLO Monitoring for GKE provides service-oriented monitoring.
- View metrics as a function of time for pods and containers, you can. Also view log entries.
- A consistent set of resource configurations across Cloud Logging and Cloud Monitoring.
- The performance of all new metrics for GKE has been improved.
Here’s a quick overview of the GKE monitoring tools you can use right away.
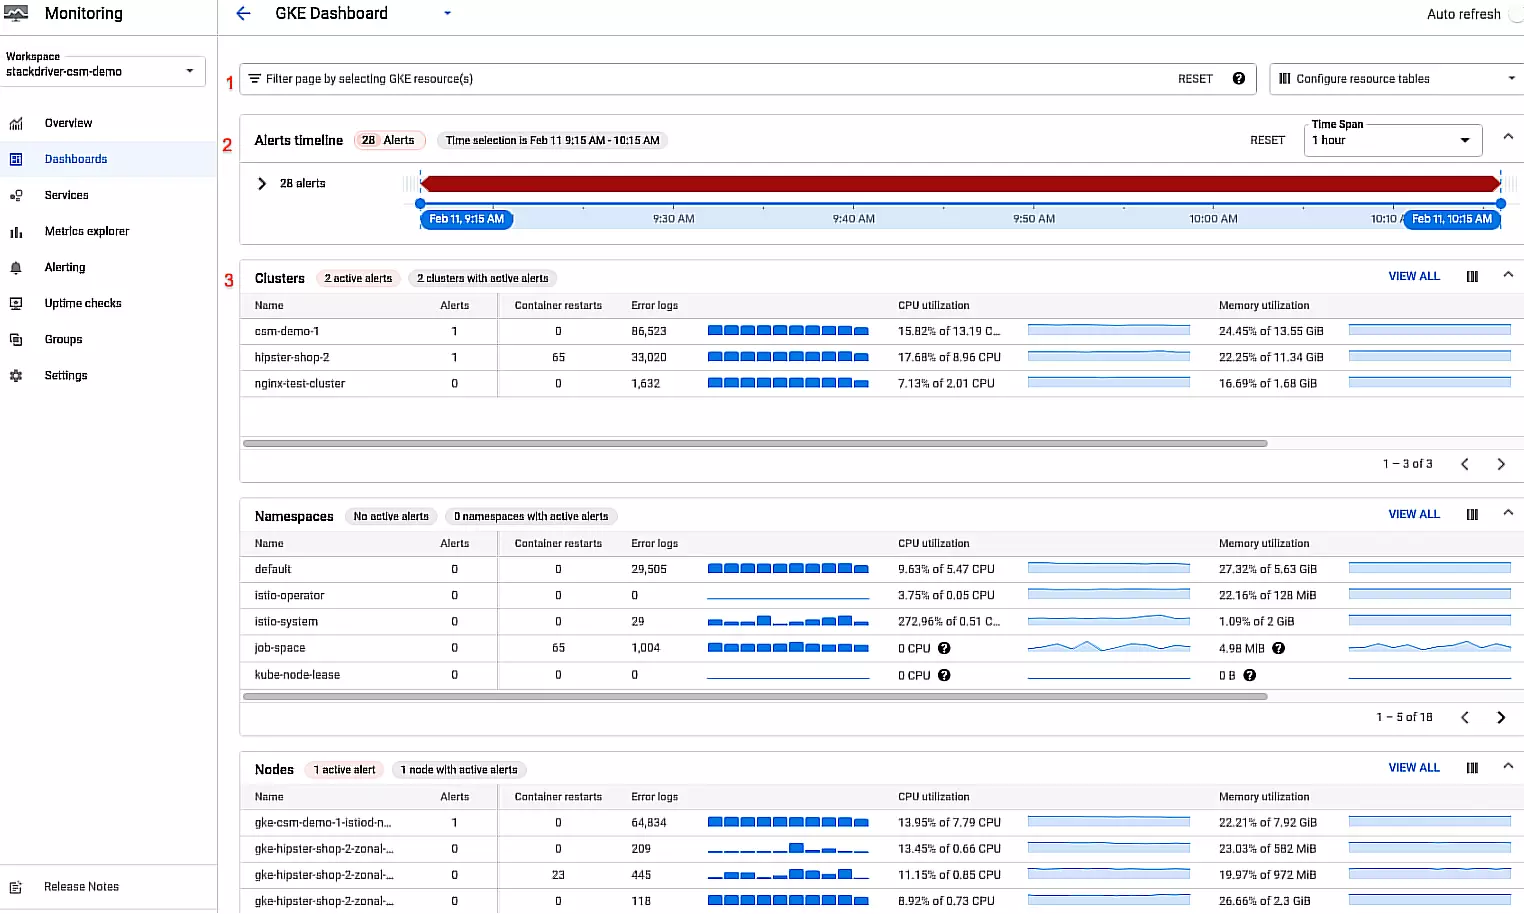
1. Cloud Operations for GKE Dashboard
To help you monitor your data in-depth, the GKE Dashboard displays several powerful metrics, including monitoring data on clusters, modes, alerts, and namespaces. Check this out:
Credit: Cloud Operations for GKE Dashboard metrics
Here’s how it works:
- Filter bar – Enables you to specify which GKE resources the dashboard should display.
- Alerts timeline – Allows you to specify a timeframe for your dashboard and the summary of alerts during that period.
- The tables – Displays your GKE fleet by type: cluster, node, pods, namespace, workloads, services, and containers. Each row displays a single resource with metrics.
You can find more details about the resource by clicking on its row, like this:
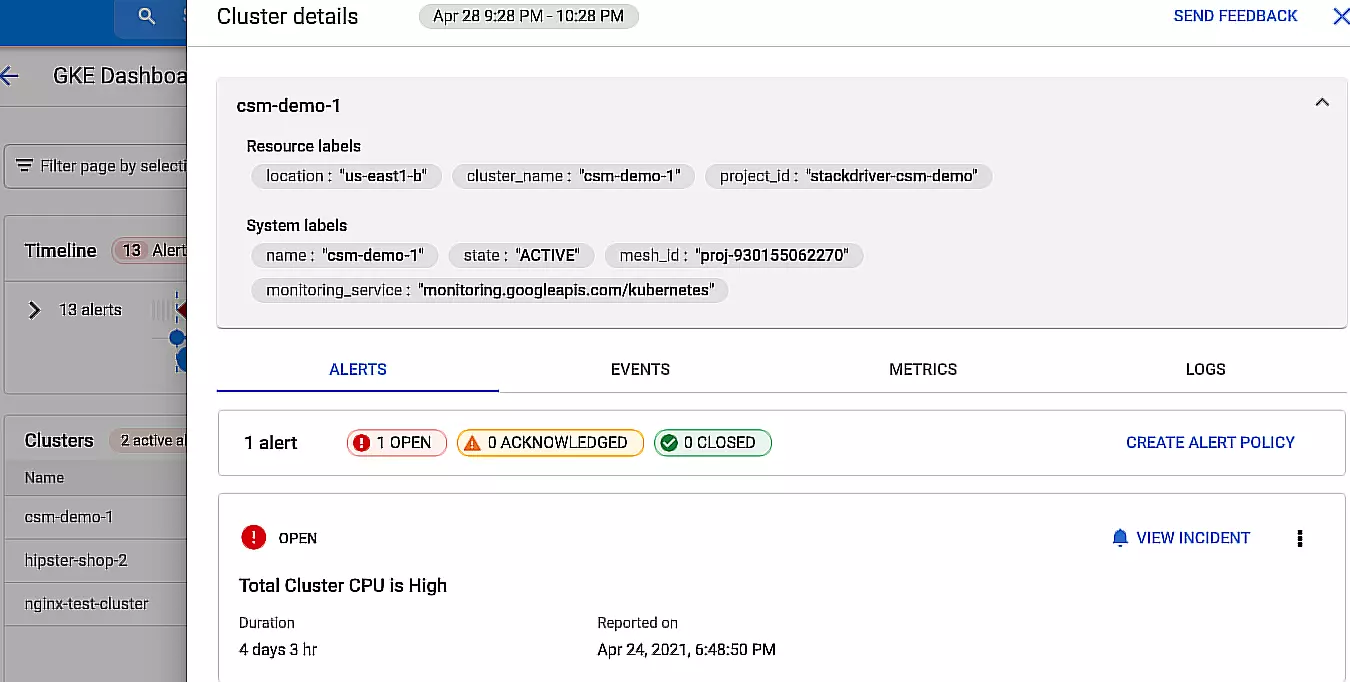
Credit: In-depth GKE monitoring data for each resource
The Alerts tab displays details about your open alerts. The Events tab shows Kubernetes events related to that resource. Under Metrics, you’ll see your metrics in charts. Meanwhile, the Logs tab displays logs that the resource generates. And speaking of logs.
2. Logs Explorer
GKE’s Logs Explorer lets you search for and analyze your cluster’s log data. You can parse and analyze this data as well as fine-tune your query parameters.
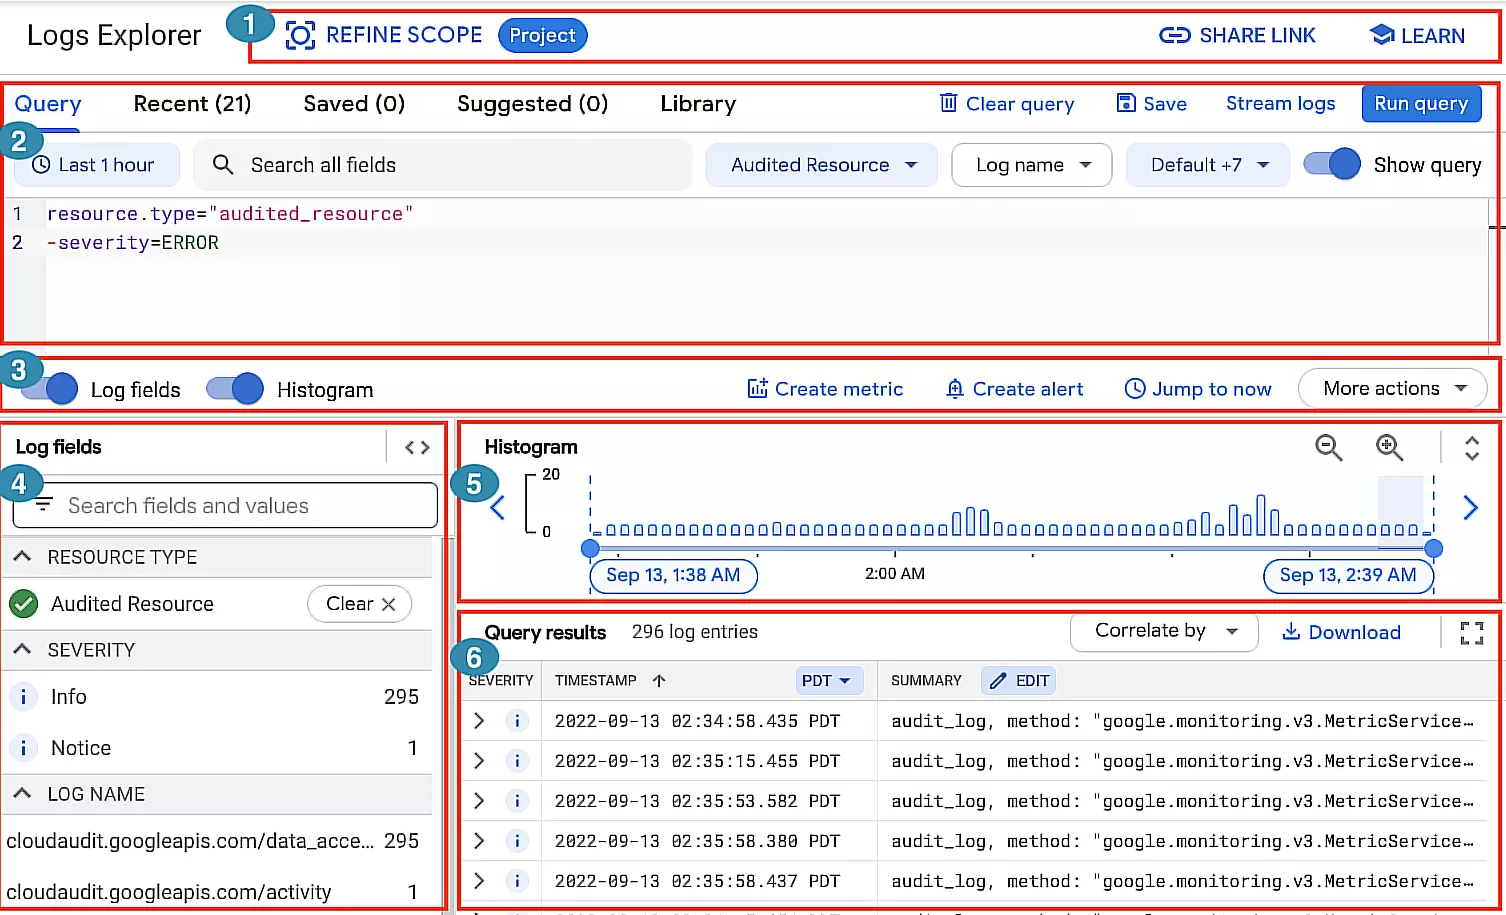
Credit: GKE’s Logs Explorer dashboard
This dashboard helps you monitor your GKE clusters in several ways:
- Action toolbar: Refine search scope, view links to relevant topics/documentation, and share a query.
- Query pane: Build and refine queries by time range, filters, search, and more.
- Results toolbar: View your logs field and histogram panes, create metrics and alerts, and more.
- Log fields pane: See a high-level summary of logs data for more efficient querying.
- Histogram: Get a visual overview of your logs’ distribution over time.
- Query Results pane: See the details of each log’s entries. Then group and analyze your log entries to uncover patterns.
Still, you can also use the Logging API and Google Cloud CLI to read logs.
Also note that Logs Explorer doesn’t handle aggregate operations, including determining how many log entries contain a particular pattern.
Should you want to perform aggregate operations, be sure to activate analytics for the log bucket. You can then access the Log Analytics page for monitoring.
Something else. The Logs Explorer also lets you view logs for analytics-enabled buckets. And now for that part we promised in the headline for this post.
GKE Monitoring Best Practices To Implement Right Now (And Improve Performance, Costs, Security, And More)
You’ll want to start following these GKE monitoring best practices as soon as possible to see results. Here’s a simplified checklist.
- Define your GCP monitoring goals, so you can specify which metrics to measure and why.
- Keep track of everything you can continuously to prevent blind spots.
- Set up and continually monitor your GKE monitoring alerts to catch issues before they cause problems for users.
- Evaluate whether you need to manually configure and manage your GKE environment. If not, GKE Autopilot handles provisioning, scaling, and monitoring automatically — making it the lower-overhead option for teams without dedicated Kubernetes ops resources.
- Reduce GKE costs by reducing unnecessary log ingestion. You can use Logging to manually specify and filter out log entries for a Google Cloud project. For example, you can apply exclusion filters to a log sink to filter out matching log entries or to extract specific log entries, allowing Cloud Logging to ingest only a portion of matching log entries.
- Base health checks on BackendConfig CRD. This approach lets you use the external Application Load Balance’s health check functionality — that is, if you are using an Ingress to expose services. You can also route the health check to the relevant endpoint and configure your own thresholds. Without the BackendConfig CRD, the health checks would use default parameters or be inferred from readiness probe parameters.
- Correlate resource usage to restarting containers in order to accelerate troubleshooting. If an application has a memory leak on an infrastructure that doesn’t utilize containers and orchestration, memory usage increases gradually over time until the application’s performance drops.
In Kubernetes, pods have a memory limit, after which K8s destroys them and recovers performance.
But this doesn’t always help you discover the root cause of the leak. By correlating resource usage to container restarts, you can detect this issue, troubleshoot it, and ensure it doesn’t keep recurring.
- Implement GKE cost monitoring. Monitoring GKE costs is a crucial component of resource management. With GKE usage metering, you can monitor resource usage, estimate resource consumption, and map workloads.
Once you enable it, you can quickly identify the most resource-intensive workloads or spikes in resource consumption and decide what to do next. Or, you can use a third-party platform. Yet, not all Kubernetes cost monitoring tools are suitable for this – and the GKE Metering tool may not offer the level of cost intelligence you need without overwhelming you.Rather, you want a platform that breaks down your Kubernetes costs into immediately actionable cost insights. Instead of seeing total cost and averages, you should be able to see your Kubernetes costs by namespace, label, service, environment, and other K8s concepts you actually care about.
Understand, Control, And Optimize Your GKE Costs With Kubernetes Cost Analysis
CloudZero’s Kubernetes Cost Optimization empowers you to view, analyze, and act on your GKE costs without all the overwhelm. Picture this:
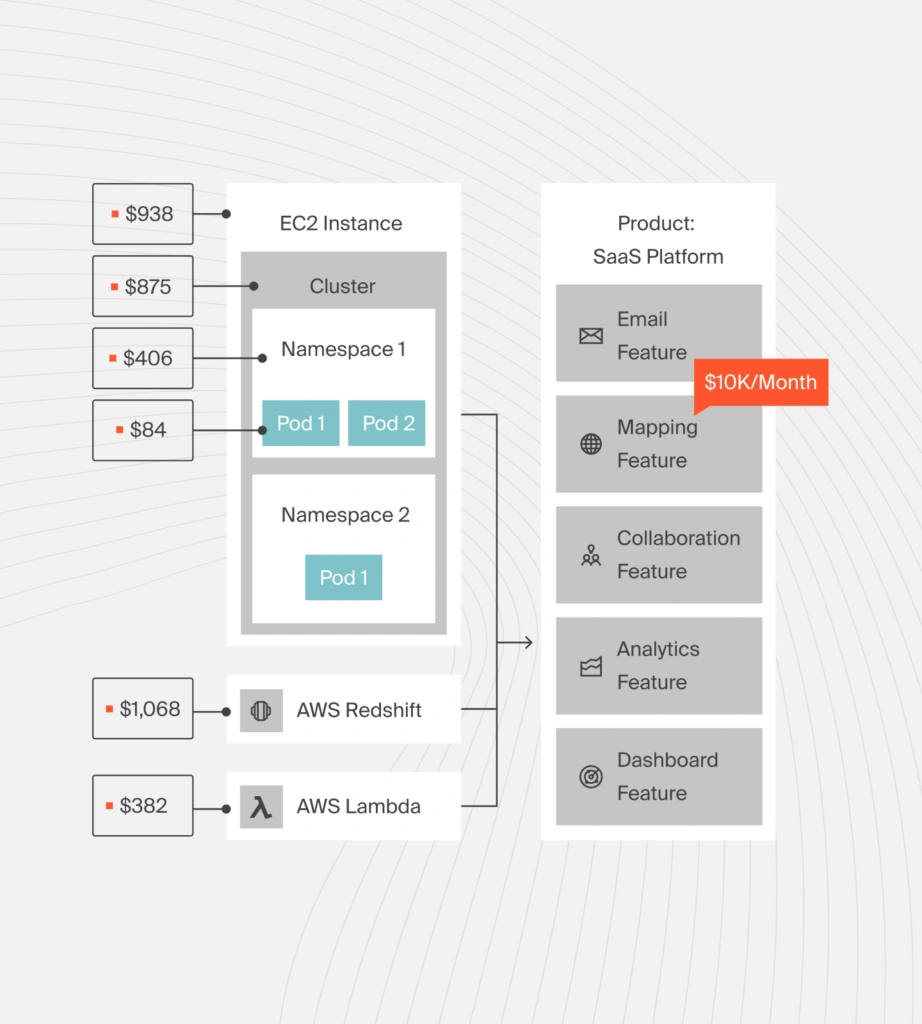
You can get insights into the cost of a product, a namespace, a cluster, or a node down to the hour, as well as per customer, service, software feature, and more.
CloudZero also enables you to bring all your cloud cost analyses under one platform, so you can get the true, full picture of your spend. Want to see CloudZero in action for yourself?  to get started.