A few months back, a backend team at a fast-growing SaaS company shipped what seemed like a harmless feature. Just a simple request validation layer. No new service. No major dependencies. No architectural shock.
Yet two months later, their cloud costs had climbed 38% without any significant increase in traffic, storage, or compute load.
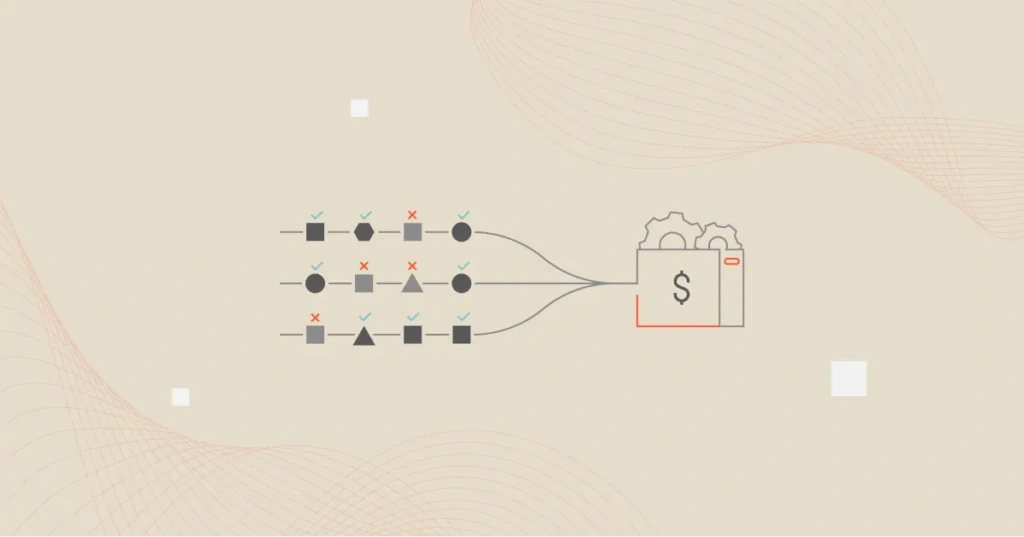
What they’d missed was that the validation layer triggered a fan-out pattern. One API call triggered three microservices, which executed five data lookups and kicked off multiple cross-region transfers. Performance stayed smooth, and latency barely budged.
Now, here’s the thing. Marginal cost is shaped less by finance and more by day-to-day engineering choices made when building systems.
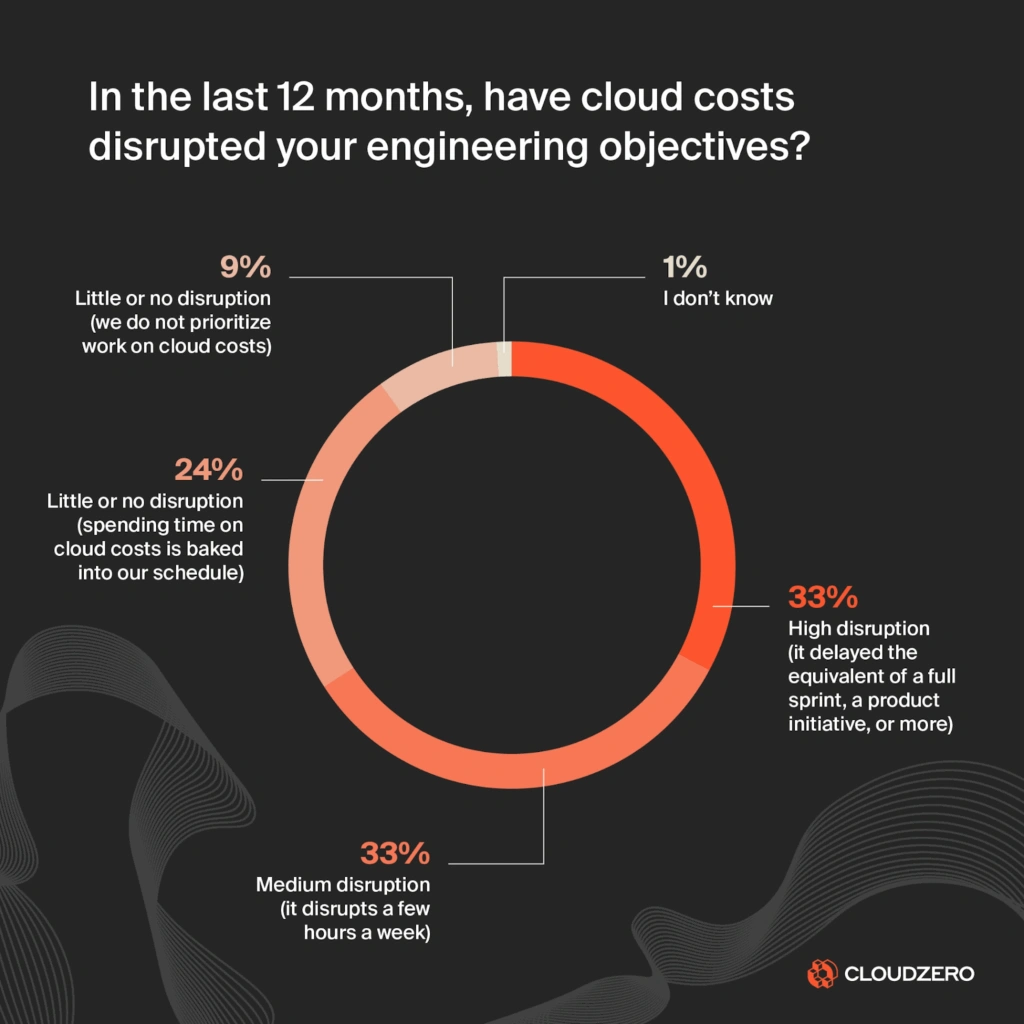
And as we saw in the State of Cloud Cost report, most engineering teams don’t see these cost traps until the system scales and finance sounds the alarm.
By then, it’s either too late or painfully expensive to reverse.
In this guide, we’ll unpack real engineering decisions that quietly drive your marginal cost up (or down).
We’ll also share how to read cost as an architecture signal, so you can design for efficient scale and minimize technical debt (becoming the most profitable engineer in the room).
Marginal Cost in SaaS is More Architecture Than Accounting
Most engineers don’t think in terms of marginal cost, and that makes sense. It sounds like something you’d hear in a finance review, not during an architecture audit.
When you look at it through engineer eyes, marginal cost isn’t exactly about accounting. It’s about understanding how architecture behaves economically under real-world load.
Based on the State of Cloud Cost Report, it’s a real engineering concern: 66% of engineers said a lack of visibility into cloud costs directly disrupts their work. Not finance work; their own.
For cost-aware engineers and CTOs, marginal cost helps answer questions like:
- How does our system behave economically as it scales? Does it get more efficient, or more expensive, with each additional request, tenant, or AI inference?
- When load increases, does a single request trigger one compute function, or twelve downstream calls, five retries, and a region-to-region transfer?
- Can this feature handle 10X or 100X growth without the cost-per-request rising disproportionately?
- Why do two architectures with identical performance have completely different unit economics?
And yes, you can have a stack that scales technically, but not economically.
Economic scalability here means that as usage increases, the cost of serving each additional unit of work (request, user, tenant, inference) stays flat, or ideally, decreases.
But many well-engineered systems only scale technically, not economically.
They perform beautifully under load, autoscale correctly, maintain uptime, and still become progressively more expensive per tenant, per transaction, or per feature as they grow.
The more successful it gets, the more it eats into their company’s bottom line.
And investors, CFOs, and CTOs are watching that trend closely, because marginal cost shapes some of the most critical business outcomes in SaaS:
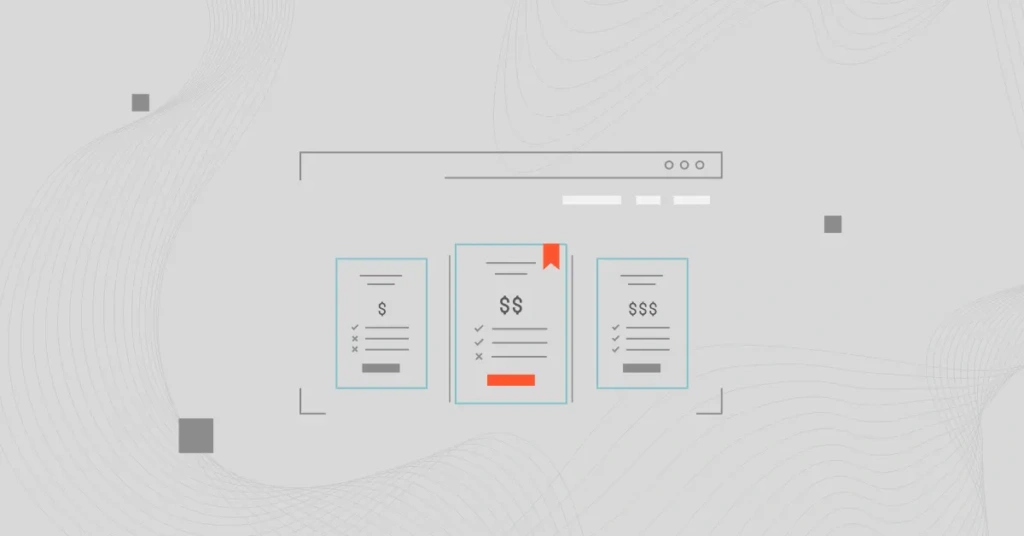
- Marginal cost influences runway and SaaS pricing strategy. If serving customers keeps getting more expensive, you either need to increase prices, accept lower margins, or rebuild parts of the system. And all of this slows growth.
- It reveals whether your platform can scale profitably. Revenue may grow, but if marginal cost grows faster, profitability shrinks with each new customer.
- It guides better architecture decisions. Knowing how marginal cost behaves helps engineers choose between managed vs custom services, batch vs real-time, synchronous vs event-driven, or single vs multi-region workloads.
At its core, marginal cost is where engineering meets economics, and where developers and architects can directly influence profitability.
Now that we’ve established that marginal cost is an engineering signal, let’s look at ten real architectural patterns that can drive your marginal cost up (or down), and fix the leaks.
1. A single request turns into twelve (API fan-out behaviors)
We mentioned this example earlier. A single API call may quietly trigger multiple downstream services, retries, logging pipelines, queue events, and cross-region transfers. The fan-out isn’t obvious in latency dashboards or tracing tools because it’s technically healthy.
What to do: The only way to catch it is by tracking your cost per service, per request, or per workflow, and watching how it changes as traffic scales.
Resources:
2. Chatty microservices and the cost of excessive communication
Microservices often communicate more than needed. They validate, notify, check entitlements, publish events, or query their neighbors for trivial metadata. Each round trip adds network calls, bandwidth charges, latency risks, and per-request billing from services like API Gateway, AppSync, and DynamoDB.
What to do: You’ll want to design services with smarter data ownership and event boundaries.
3. Real-time everything adds up
Modern systems default to real-time processing even for workloads that don’t need millisecond responsiveness. That can lead to unnecessary compute, concurrency, and storage costs.
Real-time pipelines, including streaming, pub/sub, AWS Lambda, and EventBridge, scale cost linearly with volume, while batched or scheduled workflows scale more efficiently.
What to do: So, you’ll want to ask: “Does this actually need to be real-time?” If not, batching, caching, or async processing can help you reduce marginal cost without harming the product experience.
4. Managed services that bill per execution, not per capacity
FaaS and event-driven platforms (think Lambda, EventBridge, Step Functions, API Gateway) are great for agility. But their per-execution pricing means their cost scales directly with traffic.
At low volumes, this feels cheap, but at scale, your bill behaves like a metered taxi, rather than a flat-rate bus.
What to do: That means you’ll want to choose between managed services and provisioned capacity to prevent runaway costs over time.
5. The hidden cost of logging, tracing, and continuous debugging
High-volume apps, chatty services, and verbose tracing can generate terabytes of logs daily. Most of those are never queried. At scale, log volume can exceed compute costs.
What to do: The fix here is to be deliberate about what you retain, how you sample and shape your data, and what actually needs observing in the first place.
6. Scaling workloads faster than efficiency drains
Take Horizontal Pod Autoscaling (HPA) in Kubernetes, for example. It often triggers new pods even when existing ones are underutilized. Engineers frequently overestimate CPU and memory requests “just to be safe.” This leads to cost scaling faster than actual capacity needs.
What to do: To achieve economical scaling here, practice right-sizing, bin-packing, pod-level cost visibility, and understanding when provisioning beats automatic scaling.
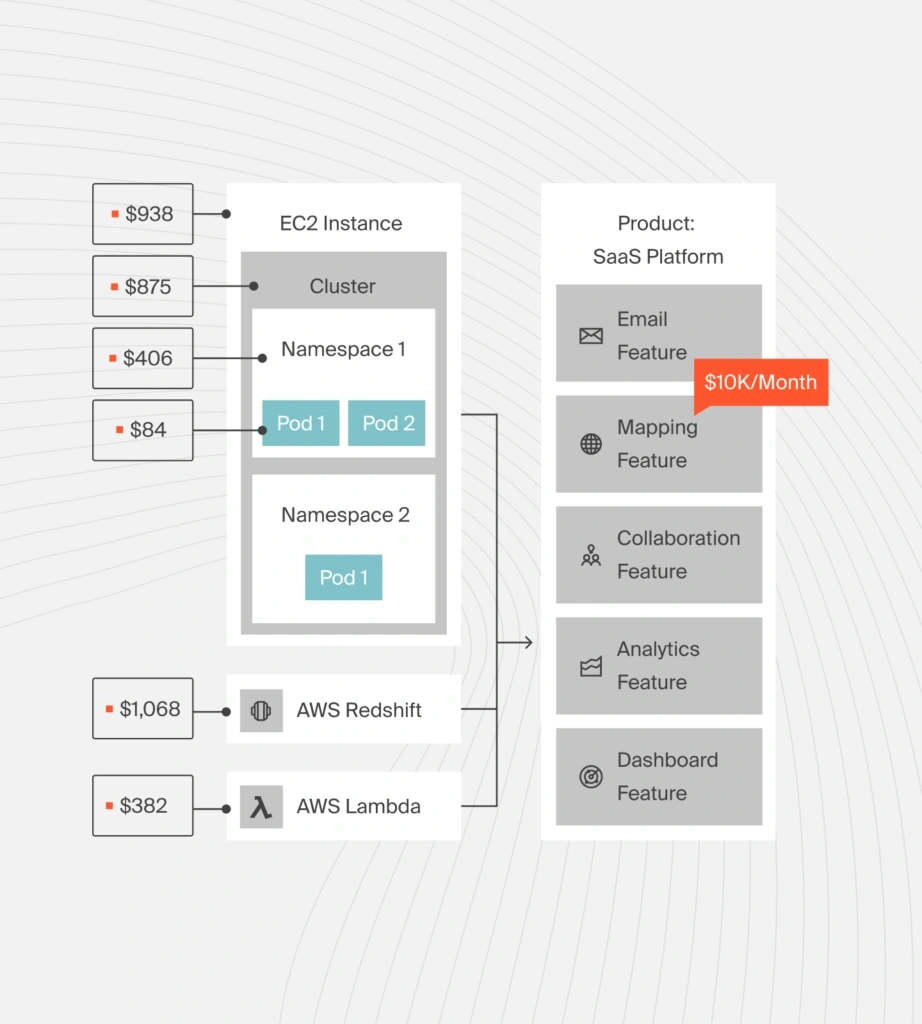
Image: CloudZero’s pod-level cost visibility for Kubernetes
7. Data replication, duplication, and the compound cost of storage
Multi-region replication, cross-account S3 access, and real-time indexing can drastically increase your egress, API requests, and storage costs, especially for high-churn workloads.
What to do: If you have data-heavy systems, watch out that they do not scale technically while doubling or tripling your marginal cost through silent replication and duplication.
8. When high availability becomes a high expense
Architectures designed for resilience often replicate everything (compute, storage, traffic, and even logs) across multiple availability zones or regions. While HA/DR makes sense, over-replicating by default (for every service, every workload) can multiply your marginal cost without improving real reliability.
What to do: The most efficient architectures tier availability, so that critical services replicate intelligently while non-critical ones don’t.
9. Check those always-on GPUs
ML inference workloads often scale poorly because GPU instances stay online even during idle periods. Plus, asynchronous model calls force resource availability per request.
Not every inference needs a dedicated GPU or millisecond response. So, design for right-time inference, not always real-time inference.
What to do: To control the inference cost, stop treating every prediction like a real-time request. Instead, use serverless GPU, dynamic batching, async inference, and model distillation to serve the same model at a fraction of the cost (and without a meaningful impact on the user experience).
10. Tenant isolation shouldn’t automatically mean full-stack duplication
Spinning up dedicated clusters, pipelines, or environments per customer feels clean and secure in early-stage SaaS. But it can lock you into linear (or worse) marginal cost growth as tenant count increases.
What to do: Instead of isolating tenants with separate stacks, isolate them with namespaces, policy controls, logical boundaries (RBAC, IAM, network segmentation), and data-level isolation.
You get the same security guarantees, but with shared infrastructure, pooled compute, and scalable unit economics.
Resource: What Are Cloud Unit Economics, Really?
So, how do you actually detect these behaviors before the invoice does for you?
Research Report
FinOps In The AI Era: A Critical Recalibration
What 475 executives told us about AI and cloud efficiency.
Track Your Marginal Cost In Your Engineering Language
At CloudZero, we help engineers see cost the same way they see latency, throughput, and error rates. As a system signal, not another finance metric.
One of the most powerful ways we do that is with Cost per Deployment. Heck, it’s a favorite unit metric among CloudZero customers like Wise, Skyscanner, New Relic, and Grammarly.
Here’s how it works.
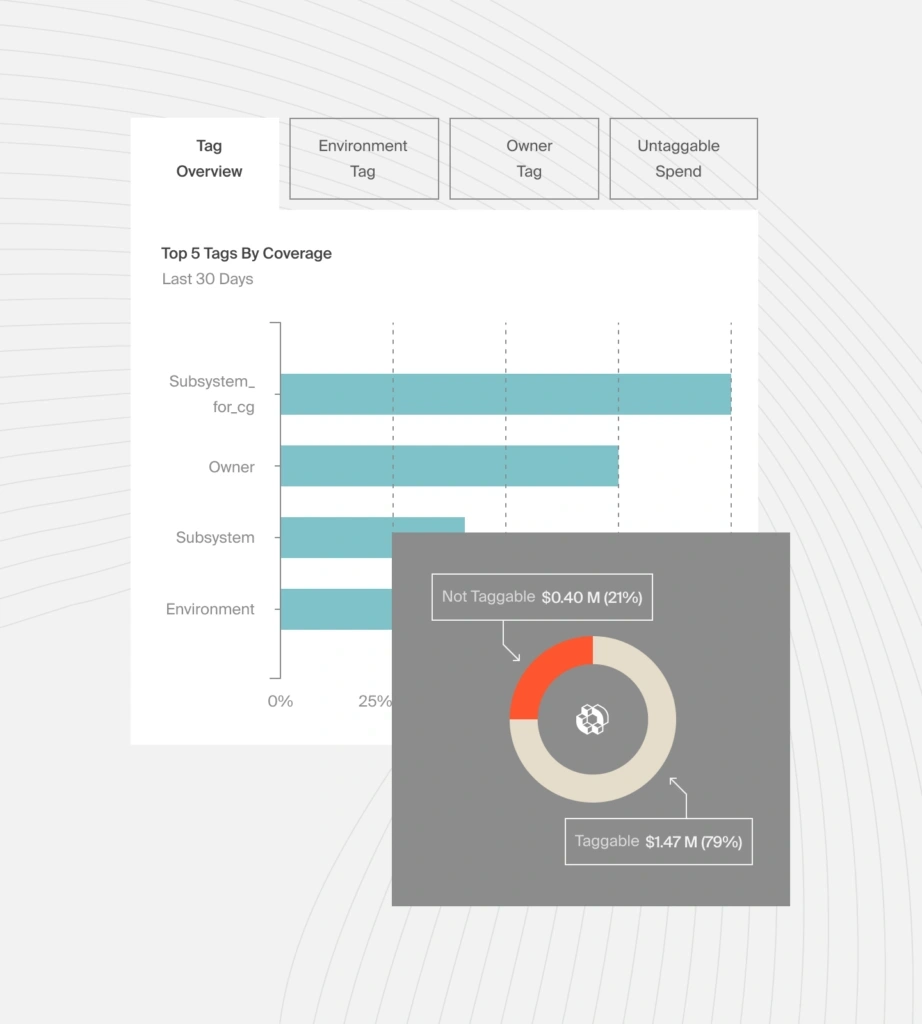
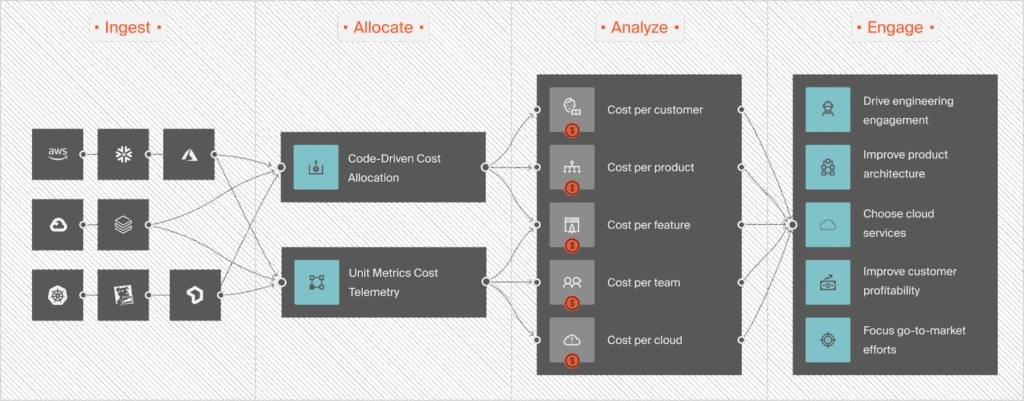
CloudZero ingests your cloud cost and usage data. We then enrich it with metadata from your engineering systems, from deployments and Kubernetes clusters to commit history and feature flags. Yes, even if your tagging is imperfect.
Using lightweight context definitions, CloudZero automatically maps spend into engineering-friendly insights like cost per deployment, cost per environment, cost per feature, cost per customer, and more.
For deployments specifically, CloudZero links spend changes to the exact deployment event that triggered them. So instead of just seeing that cost went up, you can also explain why. For example:
“Our Tuesday deployment increased Lambda fan-out for Feature Y, and that raised the cost per request by 12%, even though performance stayed flat.”
That’s marginal cost, showing in a language engineers actually use.
And when something changes unexpectedly, our real-time anomaly detection flags it. Not based on total spend, but based on unit cost drift. This means you don’t just see a spike but exactly which deployment, which service, and which architectural behavior caused it.
And just like you’d debug a latency regression, now you can debug a cost regression at the root cause.
This is how PicPay, Upstart, and Remitly used CloudZero to turn cloud cost management from a finance exercise into an engineering-led optimization culture. PicPay has saved over $18.6M and Upstart $20M+. We used the same approach internally and uncovered $1.7M in waste hidden inside our own infrastructure.
Want to see your marginal cost behave like an engineering metric? Take your free CloudZero demo here now, and watch your architecture reveal how it really scales.
FAQs
What is marginal cost in engineering?
Marginal cost is the extra cloud cost created by one additional unit of work such as a request, tenant, inference, or API call. For engineers, it reflects how your architecture behaves economically as traffic grows.
Why should engineers care about marginal cost?
Because engineering choices determine it. Fan out, retries, logging volume, autoscaling behavior, and data replication can increase cost per request even when performance looks healthy. Marginal cost shows if your system scales economically, not just technically.
How is marginal cost different from average cloud cost?
Average cost shows your blended efficiency over time. Marginal cost shows the cost of the next request. This is more important for growth because it reveals whether each new user improves or harms your unit economics.
How does CloudZero help engineers track marginal cost?
CloudZero turns cloud spend into engineering focused signals such as cost per deployment, cost per service, cost per environment, and cost per request. This lets engineers trace cost changes to the exact deployment, pod, or workflow that triggered them.


FinOps In The AI Era: A Critical Recalibration
What 475 executives told us about AI and cloud efficiency.