Author Jeff Duntemann said a good tool improves how you work, whereas a great tool transforms your thinking. Companies that want to improve their cloud-based operations can rely on cloud metrics as an effective tool for transforming their cloud operations.
You can’t fix what you don’t measure.
Cloud metrics are the logs of data that a cloud infrastructure or application generates. Using the data, organizations can detect, monitor, and respond to various changes in costs, security, and performance of their cloud environments.
What Tracking Cloud Metrics Will Tell You
By collecting, analyzing, and acting on the right cloud metrics, you can:
- Optimize billing and cloud costs
- Ensure compliance and security management
- Troubleshoot issues as soon as they arise to prevent them from affecting your entire infrastructure
- Manage service level agreements (SLAs)
- Manage application performance
- Properly allocate resources in the cloud
So, what are the crucial cloud metrics to monitor continuously for organizational success?
We’ve covered the vital DevOps metrics to track and key SaaS metrics for reporting before. In this guide, we’ll look at some of the most important cloud metrics you should be monitoring.
Report
Finance needs to prove AI’s return: CloudZero report
260 senior finance leaders (more than half CFOs) told us why the speed of seeing AI spend, not the size of it, separates who pulls ahead on AI from who gets burned.
Cloud Performance Metrics
Cloud-based infrastructure, applications, and other components generate metrics that companies can use to measure the reliability and operational excellence of their cloud services.
1. Uptime or availability
This metric measures the percentage of time a service or system is available to serve customer requests. Downtime is the opposite. Uptime increases your chances of retaining customers and generating revenue.
2. CPU utilization
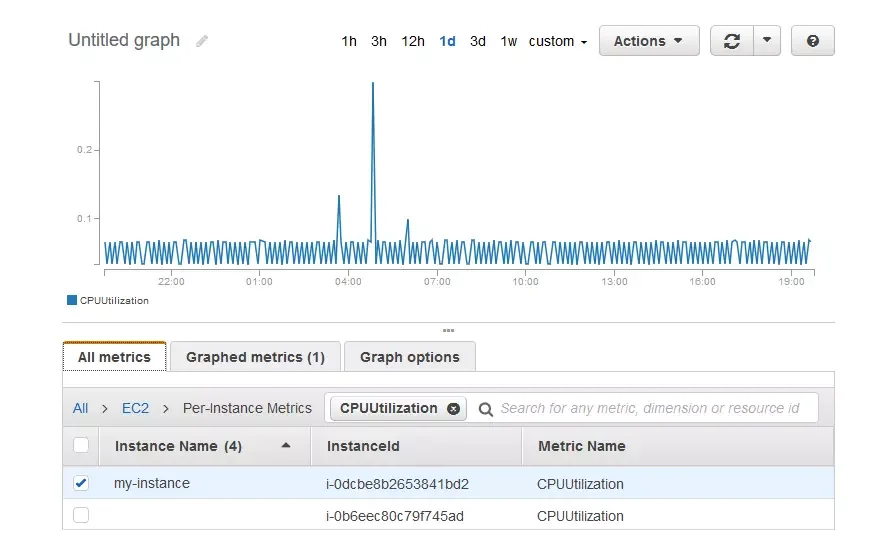
Credit: Amazon CloudWatch
CPU utilization measures the percentage of compute units you use. Tracking it will reveal if a CPU is throttling performance because of under- or over-utilization.
3. Memory utilization
Memory utilization helps to measure memory usage in public, private, and hybrid cloud environments. A consistently high memory utilization may require you to scale up your memory capacity to ensure smooth performance.
4. Requests per minute
Requests per minute tell how many requests a cloud-based application receives each minute. It is crucial to monitor how and when users access the app, so you can scale your cloud resources to meet demand, ensuring optimal performance.
5. Disk utilization
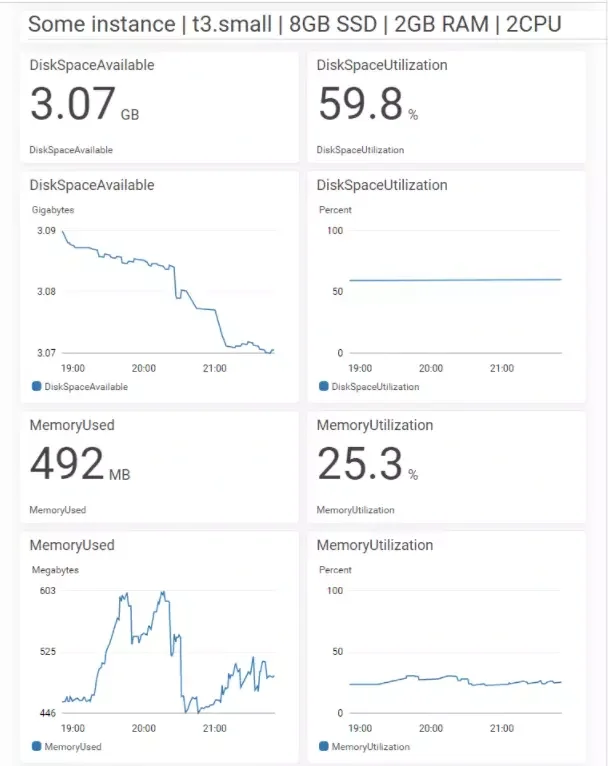
Credit: Letswp
Disk utilization enables you to track the disk volume on a node’s storage capacity to tell if it is sufficient for your workloads. Typical storage metrics include IOPS and throughput. The IOPS metric describes the number of reads and writes per second, whereas throughput measures the amount of data transferred from and to storage in bytes per second (bps).
6. Average time to acknowledge
Average time to acknowledge refers to the average time your application takes to begin a response to a request. If acknowledgement times are slow, then there may be a load balancer issue, or the app is struggling with underprovisioning and other latency issues.
7. Latency
Latency measures the time between when a customer sends a request (request time) and when the cloud provider sends back a response (response time). High latency can negatively impact productivity. Your cloud provider’s backend servers, web server dependencies, and network problems could all lead to increased latency.
8. The error rate
The error rate measures how often a request results in an error. You can troubleshoot issues like improperly configured access credentials by identifying the types of errors the system generates.
9. Swap usage
Swap usage refers to the amount of disk space devoted to holding data that should be in memory. High swap usage degrades application performance and defeats the purpose of in-memory caching.
10. Mean time between failure (MTBF)
Mean Time Between Failure (MTBF) refers to the average time a repairable cloud component works before failing. It will help you understand why systems fail, so you can identify repair methods that improve MTBF and be better equipped to tolerate failures.
11. Mean time to repair
Mean Time to Repair helps measure the average time it takes to repair a failed cloud component and get it back in service. Analyzing the MTTR will help you understand how long it takes your company to restore service after a failure. A shorter MTTR increases your chances of retaining clients and meeting SLAs.
Cloud Performance Testing Metrics
There are a variety of metrics to gauge the robustness of cloud infrastructure and the applications it hosts. They include:
12. Capacity test metrics
Capacity test metrics indicate the maximum load amount or traffic your cloud system can handle without throttling performance in production.
13. Target infrastructure metrics
Targeted infrastructure metrics enable you to isolate and fix problem areas of a specific layer or application component.
14. Stress testing metrics
Stress testing metrics help gauge the stability and responsiveness of your cloud environment and its components under high loads.
15. Load testing metrics
Load testing metrics enable engineering to check how cloud resources perform when multiple users try to access and use them simultaneously.
16. Failover test metrics
Failover test metrics measure a system’s ability to call up additional cloud resources to handle heavy or peak loads.
17. Latency test metrics
Latency test metrics help you determine the time it takes your cloud resources to transfer data messages between two points on the network.
18. Soak test metrics
Soak test metrics are indicators of your cloud system’s resilience during prolonged periods of heavy traffic.
Overall, cloud performance test metrics will help verify if your system will perform efficiently in a production environment.
Cloud Security Metrics
Keeping track of security and compliance KPIs is particularly challenging in the cloud’s dynamic computing environment. Yet, it is possible. To mitigate threats, monitor metrics such as:
19. Patched/unpatched known vulnerabilities
Patched/unpatched known vulnerabilities will indicate how timely and adequately you patch cloud security risks in your system — or if you leave them open for too long.
20. Requests per minute metrics
Requests per minute metrics not only measure cloud performance but also risks. A high number of requests per minute may indicate an ongoing threat, such as a Distributed Denial of Service (DDOS) attack.
21. Peer-to-peer-sharing metrics
Peer-to-peer file-sharing metrics help monitor changes in the number of files downloaded or shared through authorized means. An increase may indicate a compromised cloud security posture.
22. Other important security threats
- New user accounts that delete multiple users
- A computer instance that starts and stops programmatically could be a warning sign of an ongoing or inevitable attack.
- Temporary security credentials that last a long time
- Employee access credentials that are reassessed frequently
- Cloud activity that deletes CloudTrail logs (in Amazon Web Services)
- A sudden spike in “super user” usage levels
Data on violations, compliance score, and resolution progress are examples of compliance metrics.
By monitoring security and compliance metrics, you can prevent your cloud system from leaking confidential business information, customer data, and damaging your reputation.
Cloud Networking Metrics
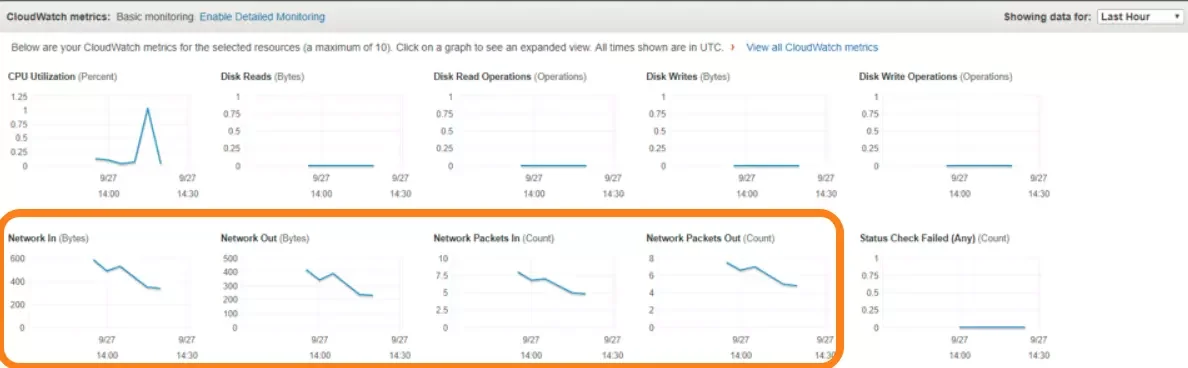
Credit: Opsview
It was fairly straightforward to fix network issues when apps were hosted over a Local Area Network (LAN). It takes greater attention to identify the cause of network issues in the cloud.
Here are two crucial cloud networking metrics to keep an eye on:
23. Network capacity
Network capacity is the maximum data transit rate possible between a source and destination through the most congested hop in the application delivery path.
Available capacity measures the actual amount of network resources available to applications, while Utilized capacity is a strong indicator of network performance degradation. Both metrics will help you determine the root cause of service degradation.
24. Packet loss
Packet loss is a measure of the percentage loss of network packets between the source and destination. Packet loss can cause latency and network congestion when an internet protocol retransmits the data. Track this metric to make sure your system doesn’t drop users’ requests, resulting in customer frustration.
Network metrics provide a good indication of the kind of customer experience your organization provides. While modern networking technologies can easily handle small packet losses and jitter, sustained network problems can cause customers to unsubscribe from your service.
Cloud Cost Metrics
Cost-conscious teams treat cloud costs as a first-class metric. Engineers can then build cost-effective solutions while finance optimizes cloud costs without hindering innovation.
But it is not enough to collect high-level cost metrics that are difficult to link to actual business activity. Instead, monitor unit costs that relate to specific business activities, such as:
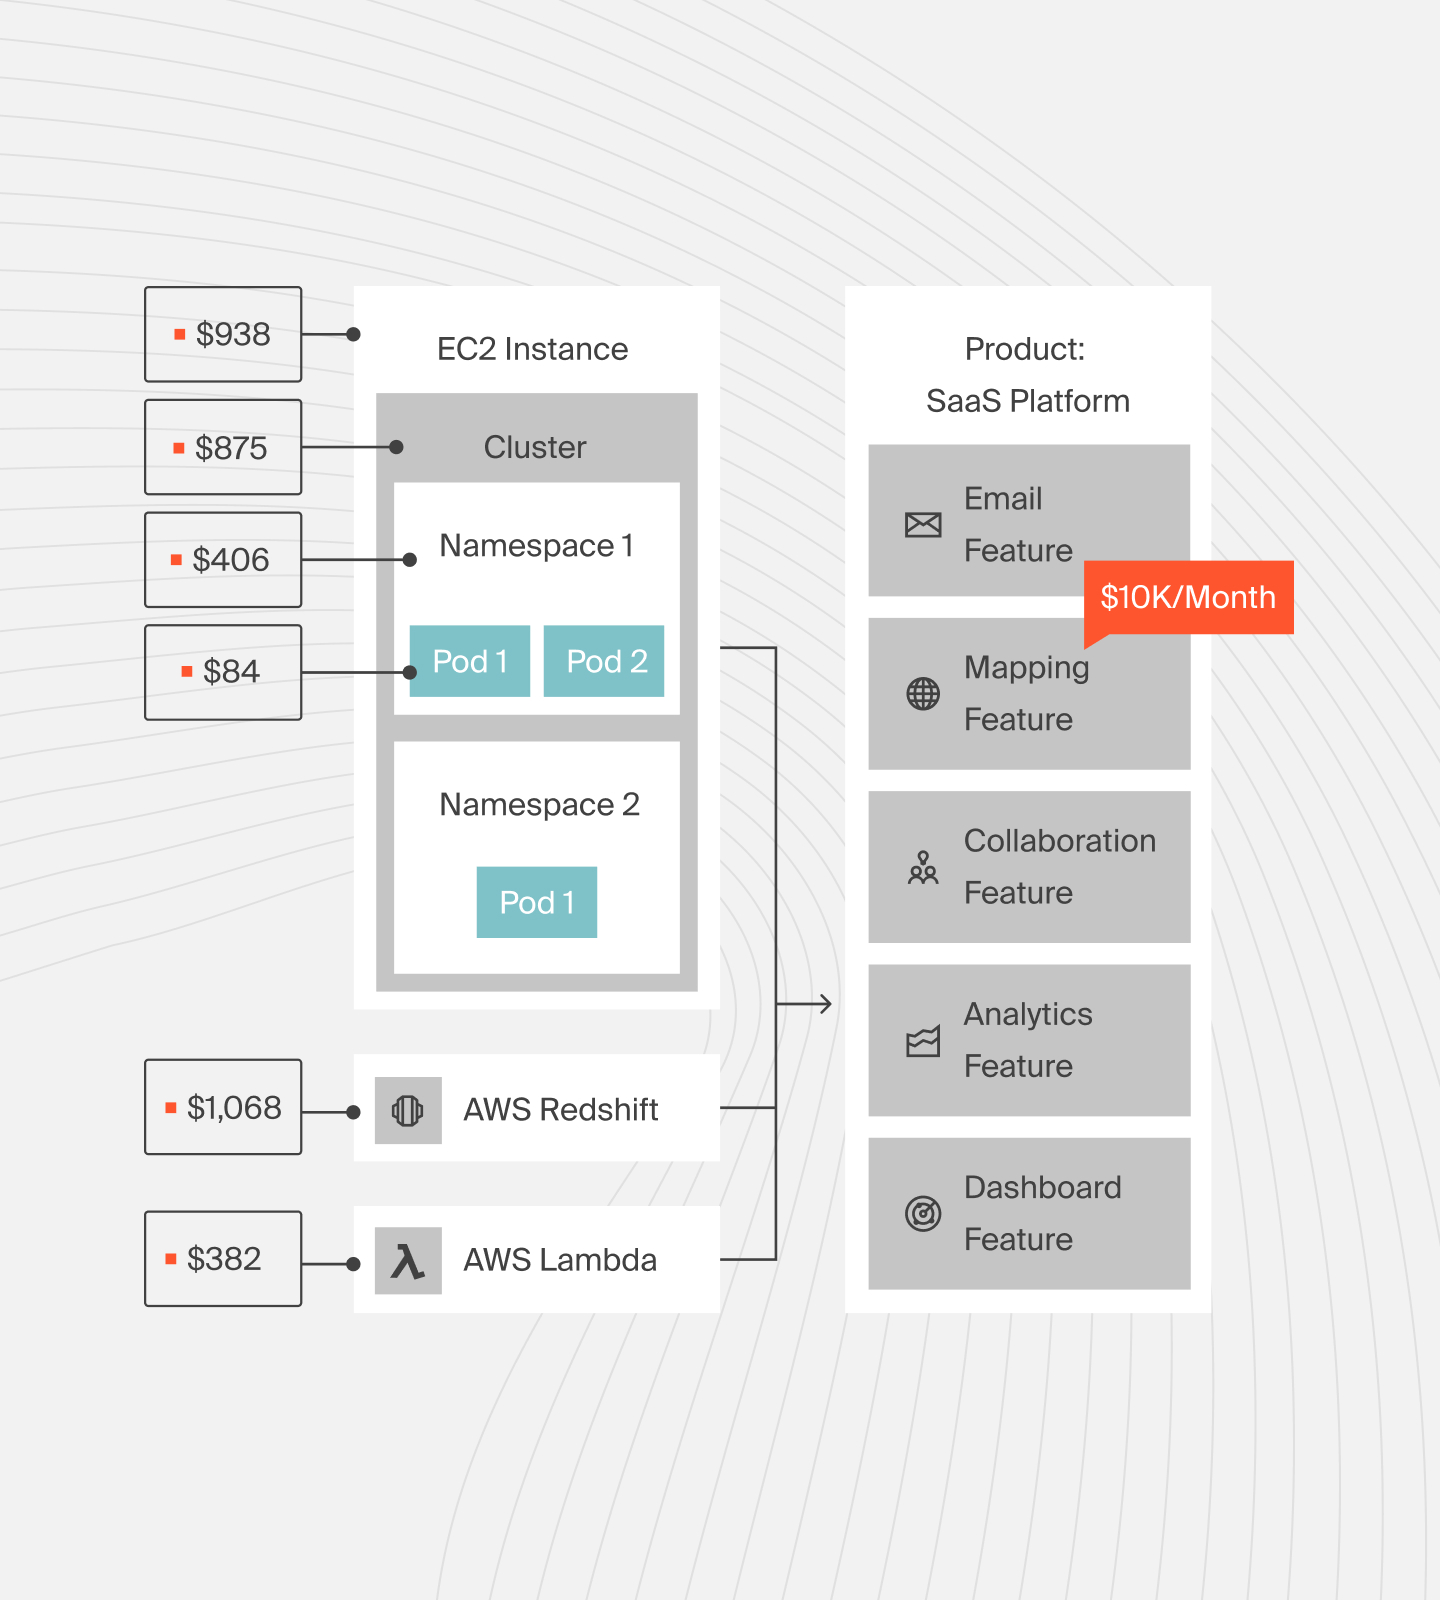
25. Cost per feature
Cost per feature is a measure of the amount you spend to release and support a particular product feature. You can track which customers use it, when, and how often. You can also use this metric to calculate how much you need to charge for the feature to turn a profit.
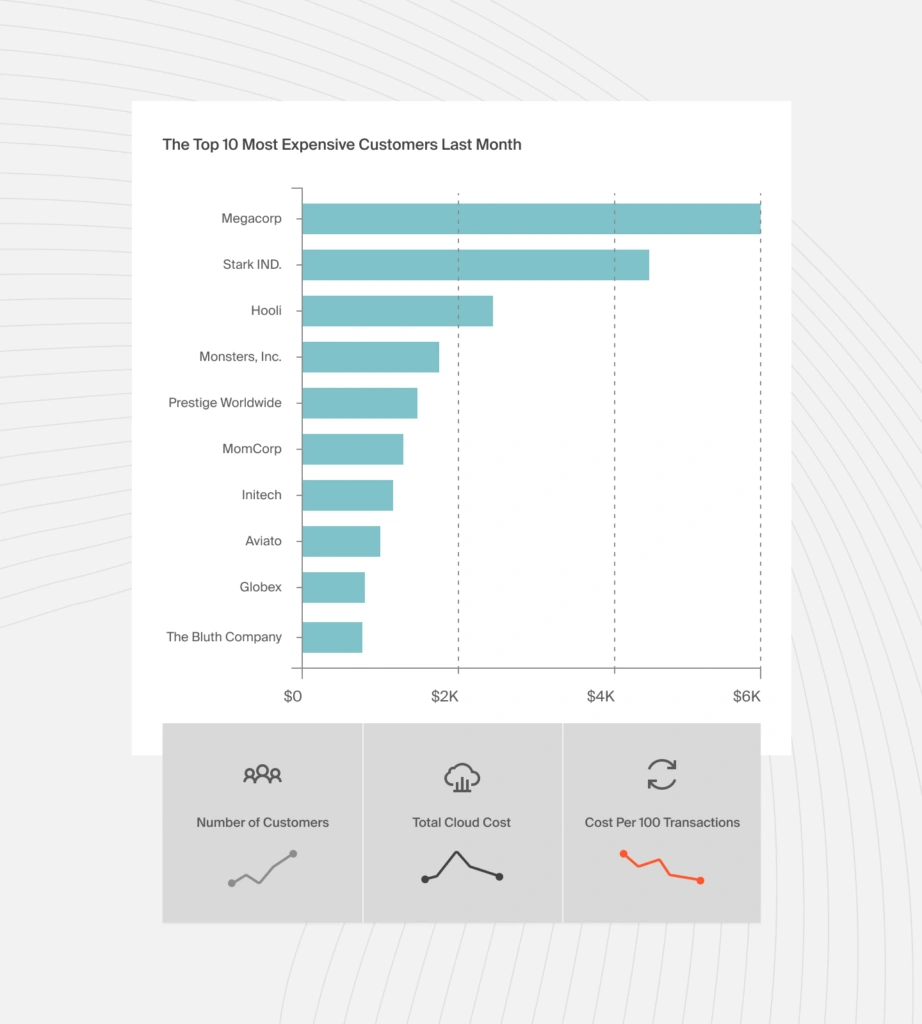
26. Cost per customer
The average cost per customer does not tell you how much you spend on specific customers. But with cost per customer, you can identify your most expensive customers and adjust pricing across different customer segments to improve margins.
27. Cost per team
Cost per team indicates whether your team is as efficient as others in the industry or as you’d like. It is difficult for distributed teams to track their cloud costs without a robust tool.
28. Cost per deployment
Cost per deployment allows your engineering and finance teams to visualize how much a given deployment project costs from beginning to end. As you collect insight, you will be better able to allocate cloud resources and lower waste.
29. Kubernetes cost metrics
Cost metrics in containerized applications and Kubernetes clusters are difficult to monitor using most cloud cost management tools.
30. Multi-cloud cost metrics
Multi-cloud cost metrics are generated across different clouds, making it tough to collect, enrich, and present them to various stakeholders in a language they understand.
31. FinOps maturity score
Your FinOps maturity score reflects how well your organization understands, tracks, and optimizes cloud spend. It covers things like cost visibility, team collaboration, automation, and accountability. Tracking this score helps benchmark progress and align engineering, finance, and leadership toward smarter cloud cost management.
32. Idle resource metrics
Idle resource metrics track unused or underused cloud assets like unattached volumes or reserved instances you’re still paying for but not using. Idle resources lead to wasted spend and skew your cloud efficiency. Monitoring idle resources helps teams shut down or reallocate them before they inflate costs.
Enter Cloud Cost Intelligence
Using CloudZero, you can easily collect, analyze, and report on multiple unit cost metrics that matter to your business. Like an observability tool, CloudZero collects cloud metrics from multiple sources, so you don’t have to have perfect AWS tags to get accurate cost insights.
It also recognizes abnormal cost changes. CloudZero will then alert the right person or team instantly via Slack to prevent overspending.  to see how CloudZero turns cloud metrics into powerful cost insights for your business.


