
While Kubernetes enables teams to deliver more value faster, understanding and controlling Kubernetes costs remains challenging.
You have disposable, replaceable compute resources constantly coming and going across a range of infrastructure types. Yet at the end of the month, you only get a billing line item for EKS costs and several EC2 instances.
When you try to do a Kubernetes cost analysis, the bill doesn’t have any context about the workloads being orchestrated — and it certainly doesn’t link those costs to your business contexts, like cost per customer, tenant, or team.
Let’s begin at the start.
What Is Kubernetes Cost Monitoring And Cost Reporting?
Kubernetes cost monitoring and cost reporting is the process of tracking, analyzing, attributing, and surfacing resource costs within Kubernetes clusters by combining three elements:
- Infrastructure costs (nodes, compute, memory)
- Kubernetes usage data (pods, namespaces, workloads)
- Time-based visibility (hourly or daily granularity)
The goal is to understand who or what is driving cost, not just how much was spent.
Effective Kubernetes cost monitoring enables four capabilities:
- Break down costs by cluster, namespace, pod, deployment, or workload
- Compare costs across time periods to identify trends
- Identify expensive resources like high-cost namespaces or services
- Detect cost anomalies in real time as they occur
Dashboards and visualizations are critical here.

They surface patterns that raw metrics or command-line outputs often miss.
Accurate Kubernetes cost visibility enables teams to:
- Share cost insights between engineering and finance teams using a common language
- Reconcile Kubernetes spend with cloud bills to understand true workload costs
- Establish baselines for optimization and measure improvement over time
Most importantly, it enables cost reduction without degrading performance, reliability, or SLAs.
So, how do you understand Kubernetes costs? Here’s how to perform a detailed Kubernetes cost analysis.
Report
Finance needs to prove AI’s return: CloudZero report
260 senior finance leaders (more than half CFOs) told us why the speed of seeing AI spend, not the size of it, separates who pulls ahead on AI from who gets burned.
How To Calculate And Monitor Kubernetes Costs
If you’re running Kubernetes on AWS EKS, the initial costs appear as EC2 instance charges.
At the billing level, you see two line items:
- EKS control plane costs
- EC2 instances backing your clusters
But those line items do not explain which workloads are driving spend.
To illustrate why, consider a simple example;
A simple service model
Imagine a product with three backend services:
- Content: Stores posts, comments, and reactions
- Users: Manages user timelines and references
- Chat: Handles real-time messaging
In a traditional server-based setup, each service might run on its own EC2 instances behind a load balancer. See Amazon EC2 pricing here.
If Chat runs on three t3.medium instances, its cost is easy to calculate.
The service cost equals the cost of those instances. But:
Instance costs alone don’t capture the full picture. Each service relies on shared resources:
- Object storage (S3) for content
- Databases (RDS) for metadata
- Ephemeral storage for active sessions
- Load balancers and data transfer
These shared dependencies introduce indirect costs. Calculating true service cost requires distributing three cost types:
- Infrastructure costs: EC2 instances, storage volumes
- Shared service costs: Databases, load balancers, caches
- Usage-driven costs: Data transfer, API calls, storage operations
However, for direct compute costs, Kubernetes changes the problem entirely.
Now imagine your cloud bill is rising and you need to find the cause.
Scenario 1: Separate infrastructure
Your chat service runs on 20 c5.18xlarge instances and still hits CPU limits. Users and content run on three m5.large instances without issues.
In this setup, the cost driver is obvious. Chat is driving most of the spend.
Scenario 2: One Kubernetes cluster
All services run on a single Kubernetes cluster with 21 c5.18xlarge nodes (same total cost).
But your AWS bill shows only the cluster cost. It doesn’t show:
- Which service triggered node scaling
- Which workload consumed CPU or memory
- Which feature drove cost increases
- Which team or customer generated the demand
This visibility gap is the core challenge with Kubernetes cost monitoring.
Why cluster totals aren’t enough
Kubernetes pools compute across workloads. That hides cost drivers inside the cluster.
To understand service-level cost, we need a model that:
- Starts from node costs
- Breaks them down by workload
- Assigns cost based on actual usage
That’s where Kubernetes cost analysis goes deeper than raw billing data.
Useful resources:
What Actually Drives Kubernetes Cost?
Scaling.
The primary Kubernetes cost driver is scaling. Clusters scale up when workloads demand more CPU or memory, forcing the addition of larger or additional nodes. Every scaling event translates directly to increased EC2 costs.
Related reads:
CPU and memory drive cost
Assume a node’s resource usage:
- Chat: 80% CPU, 20% memory
- Users: 3% CPU, 3% memory
- Content: 3% CPU, 3% memory
- Unused: 14% CPU, 74% memory
The node costs the same regardless of utilization. But to understand cost drivers, you must split the node cost proportionally across:
- Chat (dominant consumer)
- Users (minimal usage)
- Content (minimal usage)
- Unused capacity (waste)
How CloudZero weighs CPU vs memory
CPU and memory have different cost impacts. CloudZero uses a cost model that estimates the relative value of one additional vCPU compared to one additional GB of memory based on EC2 instance pricing patterns.
This is a modeling technique for cost allocation, not an AWS pricing mechanism.
Example: c5.18xlarge cost allocation
Instance specifications:
- Hourly cost: $3.06 (on-demand pricing)
- 72 vCPUs, 144 GB memory
- Cost ratio: 1 vCPU costs 8.9× more than 1 GB RAM
Hourly cost breakdown:
- Compute (CPU): $2.45
- Memory (RAM): $0.61
If Chat dominates resource usage (80% CPU, 20% memory):
- Chat: $2.07 (68% of total cost)
- Users: $0.09 (3% of total cost)
- Content: $0.09 (3% of total cost)
- Unused capacity: $0.81 (26% waste)
Now the cost driver is visible.
Useful resource: Tracking Kubernetes Spend With CloudZero in 3 Easy Steps
Why this works for Kubernetes
Kubernetes schedules workloads as pods across shared nodes.
Pods are the smallest scheduling unit. From pods, you can reconstruct:
- Services
- Deployments
- Namespaces
Node costs can be broken down the same way.
What metrics make this possible
AWS bills nodes hourly. Pods start and stop inside that hour.
Kubernetes exposes metrics such as:
- pod_cpu_utilization
- pod_memory_utilization
Pods may also reserve CPU and memory. Actual usage is the higher of reserved capacity and real utilization.
Over-reservation is also common.
Even then, the real cost driver is the demand for CPU and memory. That’s what ultimately forces scaling and spend.
At this point, we have what we need to calculate Kubernetes cost.
Step 1: Start With node costs
Begin with your AWS bill. This gives you per-instance costs for the EC2 nodes running your cluster.
Step 2: Collect pod usage metrics
Next, collect CPU and memory metrics from Kubernetes.
Amazon Container Insights provides:
- Minute-by-minute usage
- Pod-to-node mapping
Any metrics system works, as long as it captures:
- CPU and memory usage
- Reserved capacity
- Pod → EC2 instance correlation
Step 3: Calculate pod utilization
For each pod:
- Take the max of reserved or used CPU and memory
- Sum usage across each collection interval
- Divide by the number of intervals per hour
If a pod didn’t run, its cost for that period is zero.
Step 4: Allocate node cost to pods
Split each node’s hourly cost into:
- CPU portion
- Memory portion
Then allocate those costs to pods based on utilization.
The result: per-pod cost.
Roll costs op
Once you have pod costs, everything else is simple. You can calculate:
- Cost per service
- Cost per namespace
- Cost per deployment
Each is just the sum of its pods.
The reality check: this method works, but manual implementation requires:
- Processing millions of pod metrics hourly
- Recalculating costs continuously as pods start and stop
- Managing complex spreadsheets that quickly become unmaintainable
This raises the critical question: is there a better way to analyze Kubernetes costs?
How CloudZero Helps You Understand, Optimize, And Save On Kubernetes Costs
CloudZero measures Kubernetes costs with full business context, showing actual costs by:
- Cluster
- Namespace
- Pod
- Hour
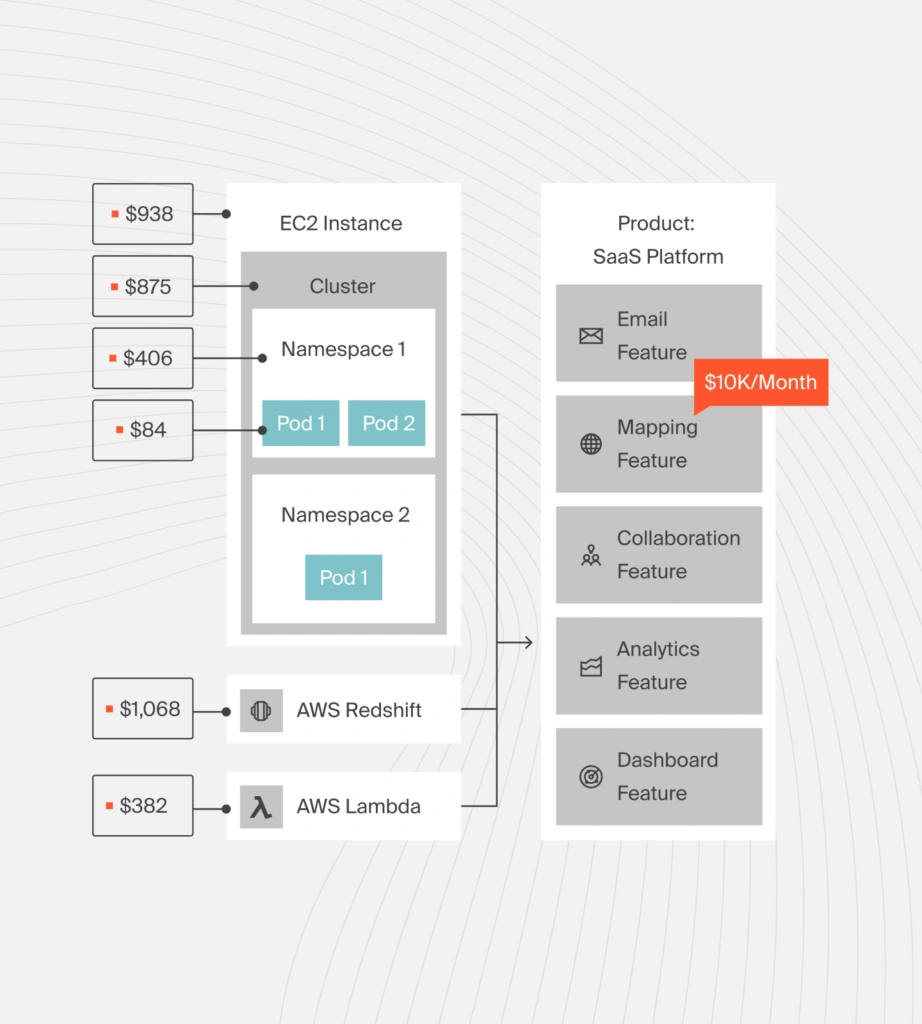
More importantly, costs are tied to business drivers, enabling you to answer:
- What does this feature cost to run? (cost per feature)
- Which teams drive Kubernetes spend? (cost per team)
- How much does each customer cost? (cost per customer or tenant)
- Which services consume the most resources? (cost per service)
Beyond container-only views
Kubernetes does not exist in isolation. CloudZero connects container costs with:
- Compute
- Storage
- Networking
- Managed services
So you see true COGS, not partial numbers.
With CloudZero, you can also:
- Track Kubernetes cost trends over time
- Allocate costs accurately across workloads
- Identify idle and unused capacity
- Detect cost anomalies as they happen
All in one place. No spreadsheets. No manual modeling.
If you want to see how this works, take a product tour or  to see how CloudZero can help your organization analyze and manage Kubernetes costs with clarity.
FAQs
Why is Kubernetes cost analysis difficult with cloud bills?
Cloud bills list node and control-plane charges but do not link those costs to individual workloads. Kubernetes pools compute across services, so cost drivers are hidden without additional usage data.
What actually drives Kubernetes costs?
The primary cost drivers are CPU and memory usage, which determine how nodes scale up and down. Pods consuming more CPU or memory force the cluster to add more resources.
What metrics are used to attribute Kubernetes costs?
Key metrics include:
- pod_cpu_utilization
- pod_memory_utilization
- Reserved vs. actual usage: Correlating these with node costs enables an accurate cost breakdown.
Can Kubernetes costs be attributed to business metrics like customer or feature?
Yes. By combining usage signals with cost data, teams can assign Kubernetes costs to product features, customers, tenants, teams, or business units, rather than just infrastructure.
What does Kubernetes cost per namespace mean?
Cost per namespace is the sum of all pod costs within a namespace. It shows how much each logical group (team or app area) contributes to the total cluster cost.
How does Kubernetes cost per service differ from cost per pod?
Cost per pod is the foundational unit of cost. Cost per service aggregates all pod costs for that service, providing a higher-level view of cost drivers.
How often should Kubernetes cost data be tracked?
Cost data is tracked hourly or daily to capture usage patterns and detect spend trends or anomalies early.
What is the difference between Kubernetes cost monitoring and Kubernetes cost reporting?
Kubernetes cost reporting surfaces aggregate spend across clusters and namespaces, while Kubernetes cost monitoring combines billing with usage data to link costs to individual workloads and business context.
What role does resource reservation play in cost?
Reserved CPU and memory set a floor on usage. If pods reserve more than they use, that can drive unnecessary scaling and higher costs.