Cloud computing offers several undeniable benefits to businesses. Some of the biggest ones are agility, cost savings, data recovery, and developing new apps and services to meet changing customer needs.
Despite these benefits, the cloud can be complex, demand specialized skills, and require companies to follow up-to-date cloud security best practices. Why?
A 2025 cybersecurity report showed that software companies experienced a 109% increase in weekly cyberattacks from 2023 to 2024, the second-highest reported increase of any industry (with hardware companies experiencing the highest). More recent data suggests this trend has continued into 2025 and 2026.
Companies have struggled with cloud observability challenges since the inception of the cloud. In addition to security, these issues include:
- Improving cloud cost visibility and monitoring cost metrics like COGS and unit cost
- Gathering timely data to identify potential issues before they affect staff or customers
- Measuring the right metrics to optimize an application’s performance in the cloud
- Compiling, analyzing, and acting on metrics, logs, and transactional traces relevant to regulatory compliance and other criteria
So, how do you overcome these challenges to fully leverage your cloud environment?
Enter: Cloud monitoring.
In this guide, we’ll cover exactly what cloud monitoring is, its benefits, what you should monitor, and best practices for effective monitoring. We’ll also cover specific cloud monitoring tools you can use to get started, no matter what metrics you need deeper visibility into.
What Is Cloud Monitoring?
Cloud monitoring is the process of observing, evaluating, and managing the health, performance, and availability of cloud-based applications, architecture, and services.
Cloud computing monitoring often involves using automated or manual techniques and tools to determine if your cloud infrastructure is performing as expected.
Cloud monitoring is a vital component of cloud security and management. This process often involves observing your cloud environment in real time and continuing to identify any issues that may affect service availability.
However, experienced engineers can do more.
What are the capabilities of cloud monitoring?
Through cloud monitoring, engineers can:
- Utilize cost anomaly alerts to avoid cost overruns and overspending
- Monitor data flowing through multiple locations via various devices
- Get visibility into user, file, and application behavior to improve the performance of their cloud environment
- Identify potential vulnerabilities before they become a significant issue
- Prepare security audit reports for compliance purposes
- Scale observability capabilities as architecture grows
- Use monitoring insight to make informed engineering and product decisions
With proper execution, cloud monitoring capabilities can yield powerful, practical, and sustainable benefits for engineers and the entire organization.
Report
Finance needs to prove AI’s return: CloudZero report
260 senior finance leaders (more than half CFOs) told us why the speed of seeing AI spend, not the size of it, separates who pulls ahead on AI from who gets burned.
The Benefits Of Cloud Monitoring
Overall, cloud monitoring provides engineers with a greater level of visibility into their cloud environment. Further benefits include the ability to:
- Reduce the cost of fixing security issues that might cost thousands or even millions of dollars. Cloud monitoring enables DevOps to mitigate risk continuously.
- Identify and minimize issues that can lead to cost overruns which can eat into your margins over time.
- Resolve architectural problems, such as misconfigurations that may affect customer service.
- Get a better understanding of your application’s performance. You can use the insight you collect to improve user experiences and avoid losing customers to your competitors.
- Analyze how your cloud-based services perform on different devices so you can optimize their performance.
- Ensure the most relevant people are made aware of a cloud architecture problem so they can fix it ASAP.
- Enhance visibility and manage cloud environments through automation.
- Identify the root cause of cloud problems so engineers can patch them efficiently and thoroughly.
How does cloud monitoring help with all of these?
How Cloud Monitoring Works
Different cloud environments require unique monitoring methods. However, the basic principles remain the same.
Still, the complexity of a cloud environment makes it difficult for some engineers to execute a structured cloud monitoring strategy. Start by assessing these five different types of cloud monitoring.
The 5 Types Of Cloud Monitoring Explained
Each type of cloud monitoring focuses on a specific component of cloud architecture. Monitor the following components and areas:
- Website monitoring is a type of cloud monitoring that helps administrators track various aspects of cloud-based websites, such as traffic, availability, and resource usage.
- Monitoring virtual networks includes monitoring activities and components that involve virtual network connections, performance, and devices.
- Database monitoring analyzes data integrity, availability, querying, access, and how your application uses this data, as well as identifying any bottlenecks that could hinder efficient data transmission.
- Monitoring virtual machines include monitoring health, as well as traffic logs and scalability in response to fluctuating workloads.
- Monitoring cloud storage provides insight into performance, users, storage costs, bugs, and other key performance indicators.
Those five areas are important to experienced cloud engineers, but what kind of insights do they look for?
5 Factors You Should Monitor
Engineering teams can use various metrics, logs, and events to see how their cloud infrastructure is performing. Aspects worth capturing and analyzing include:
Cloud security
One of the top concerns for engineers and CTOs today is the possibility that their organization will experience a cyber attack.
Account hijacking, insecure interfaces, and unauthorized access are all risks that companies operating in the cloud face.
Good news: monitoring your cloud security can help you identify suspicious activity before it escalates into a full-scale attack.
These examples may indicate an impending security breach:
- A new user account deleting other users
- Temporary security credentials having long lives
- Seeing multiple instances that stop and start programmatically
- Activity that erases security logs and events
You’ll also want to keep an eye on how your cloud architecture decisions affect your budget.
Cloud costs
One of the most common goals for companies moving to the cloud is to reduce costs. Sadly, many businesses do not have adequate mechanisms to observe costs in a way that makes sense to their businesses.
Because most companies do not know where, when, and how their cloud budget was used, they are unlikely to optimize cloud costs.
But with a solid cloud cost monitoring platform, both engineers and finance teams can gather the insights they need to avoid overspending on their cloud infrastructure projects — and even improve COGS, cost per customer, and other important unit cost metrics.
Cloud-based application performance (APM)
Setting up a robust application monitoring tool with monitoring and analytics capabilities can easily understand the logs, metrics, and alerts that cloud infrastructure generates. These include DevOps monitoring metrics that can track the performance of the underlying infrastructure.
Cloud performance issues can range from disk utilization to latency and scalability challenges. Modern APM tools allow you to track these aspects in real time so you can take a proactive approach to application performance optimization in the cloud.
Application/service availability
This is especially important for companies that use the Software-as-a-Service (SaaS) model. As your application depends on cloud-based servers to fulfill user requests, monitoring the health of your SaaS environment and components is vital to ensure issues like overloading do not impede service delivery.
Cloud-based services are typically highly integrated and depend heavily on other services to function. When a cloud infrastructure component is not monitored, it can lead to availability issues in many other parts of the cloud.
Infrastructure monitoring
Cloud infrastructure best practices include monitoring virtual machines, Kubernetes, storage, databases, and their health and dependencies. Monitoring will help you observe, track, and react to changes that could affect your environment’s security, performance, availability, and cost.
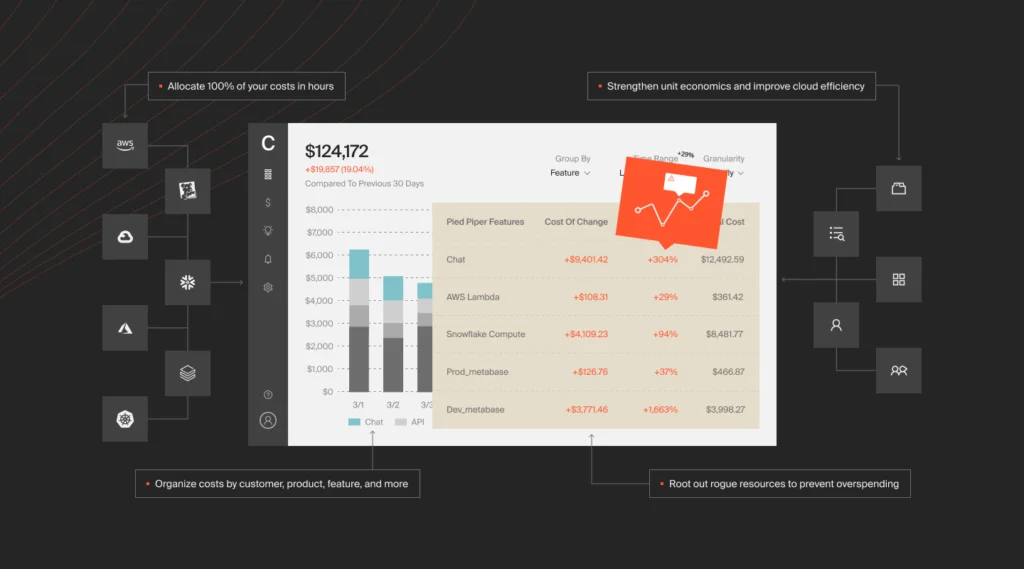
By using solutions such as CloudZero, you can also find out which services, teams, products, features, and customers you spend the most on, why, and whether they are eating into your gross margins.
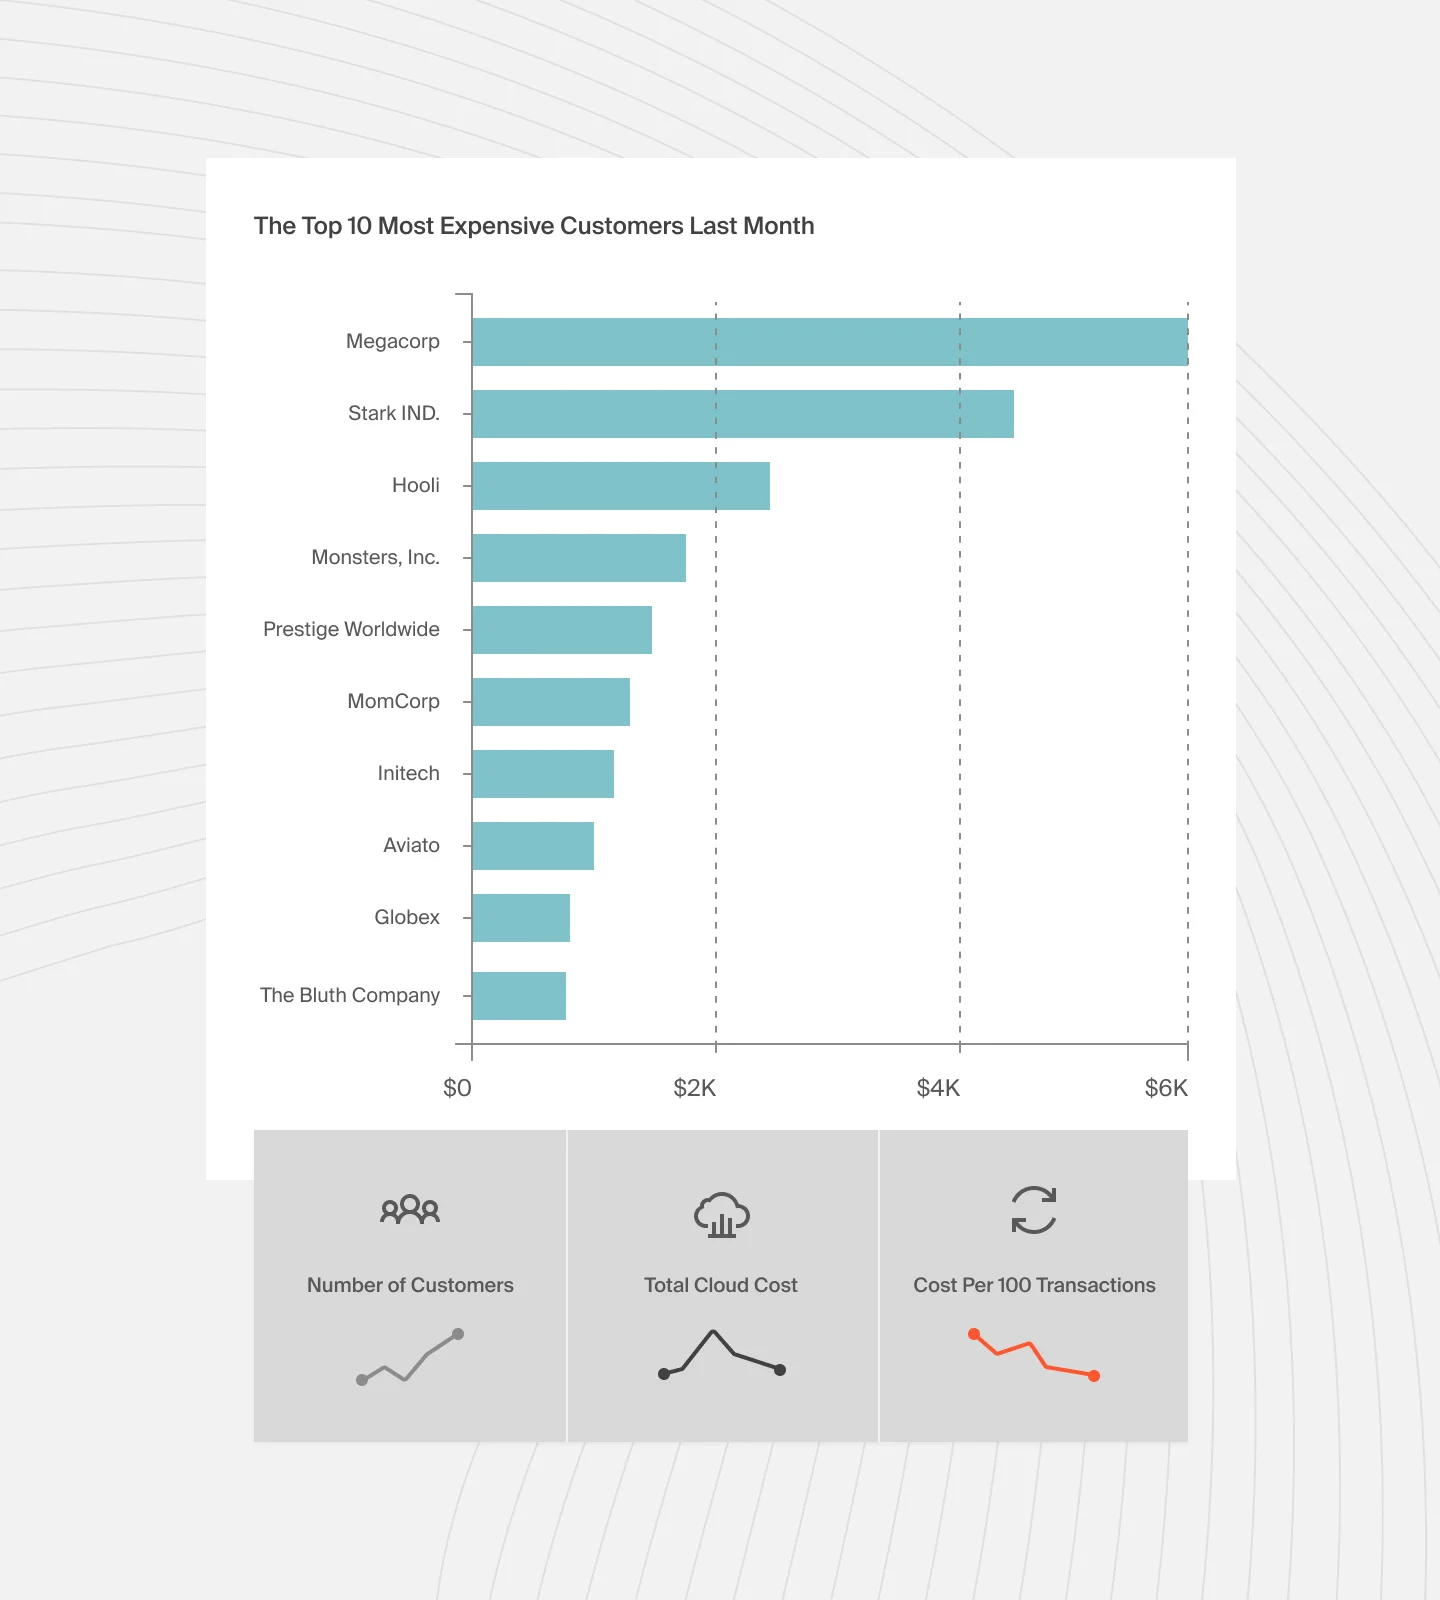
CloudZero aligns cloud costs to key business metrics, such as cost per customer or product feature. Our cost per customer report allows teams to see how individual customers drive their cloud spend and impact their business.
Cloud Monitoring Challenges And Pitfalls to Avoid
Cloud monitoring can be complex and fraught with potential pitfalls. Here are some of the common challenges and ways to mitigate them.
Data overload
The vast amounts of data generated in the cloud can overwhelm monitoring systems. To optimize data handling, focus on sorting and prioritizing essential data.
Lack of unified visibility
Monitoring various cloud environments with different tools can result in fragmented visibility. Detecting anomalies can be difficult, resulting in delayed response times. Consider a single monitoring platform like CloudZero to give you a complete view of your cloud infrastructure. This not only simplifies cloud management but also cloud monitoring.
Scalability issues
As organizations expand, their requirements for cloud infrastructure and monitoring also develop. Inadequate monitoring tools for your cloud environment can cause performance bottlenecks. Opt for monitoring solutions that can scale accordingly.
Performance overheads
If monitoring is not handled correctly, it can lead to performance overheads. Intensive data collection and thorough logging can use up a lot of system resources. This usage could affect how well the monitored applications perform. It is essential to balance the level of monitoring detail and its effect on performance. Utilize effective strategies to collect data. Additionally, adjust monitoring frequencies to reduce these additional costs.
Inadequate alert system
Setting up alerts is vital. However, incorrect setup can result in alert fatigue, causing essential notifications to be disregarded. On the other hand, if there are not enough alerts, critical issues could be overlooked. To prevent this, adjust alert thresholds. Use new alerting systems that prioritize important anomalies over lesser ones. This ensures that alerts are helpful and can be acted upon.
Security and compliance risks
Cloud environments have many security risks. Monitoring them may not ensure adherence to industry rules and regulations. Regularly update security policies and incorporate compliance checks into your monitoring process.
Integration difficulties
Integrating monitoring tools with current systems and workflows can be challenging. Ensure your monitoring solutions have robust APIs and easy integrations to support smooth data transfer and unified monitoring.
Incomplete metrics and logs
Relying on complete or accurate metrics and logs may lead to effective troubleshooting. However, it is crucial to ensure thorough and precise data collection for successful monitoring. Check your monitoring configuration. Make sure it accurately tracks all vital logs and metrics.
Human error
Manual monitoring is prone to human error, leading to overlooking issues or setting off unnecessary alarms. Automating as many monitoring tasks as possible can reduce the chance of human error.
Cloud Monitoring Best Practices To Implement Now
The following best practices can help you to build and improve your cloud monitoring strategy — whether you’re monitoring public cloud, private cloud, or a hybrid environment:
- Establish goals for your cloud monitoring investment so that you can measure progress.
- Set up a process for continuous monitoring and improve it as you gather more information.
- Collect different teams’ insights about metrics are important to monitor and what to do with the data.
- Map monitoring metrics to actual business outcomes within your organization.
- Monitor as many components directly affecting your business’s bottom line as possible.
- Monitoring tools allow engineers to observe what happens during multi-point failures, allowing them to troubleshoot and debug them.
- You need to set thresholds that inform engineers when to react to issues and fix them before they become huge problems for your end users.
- Start with simple, native tools provided by your cloud service provider before integrating a more robust cloud monitoring solution.
- Centralize your monitoring data and display it via unified dashboards and charts. This reduces the need for using multiple tools, services, and APIs to monitor different data.
- Automate cloud monitoring. Manual monitoring is possible. However, it can be time-consuming and prone to human error.
- Monitor your cloud costs. Many tools lack complete cost visibility, especially within public and hybrid clouds. Implement a cloud-based cost intelligence solution to see your cloud investment’s what, why, and how. A tool that displays data in a way that makes sense to your business, such as cost per customer, team, or product, is even better.
- Monitor end-user experience. Crash reports, response times, network requests, and page loading details are some metrics that can help you do so.
- Run regular chaos tests on your cloud monitoring strategy and tools. Improve your cloud-based applications, services, and architecture as you collect, analyze, and gain insights from more data.
What’s the difference between monitoring public, private, and hybrid clouds?
Monitoring strategies vary depending on whether the cloud deployment is public, private, or hybrid. Here is a quick overview.
Cloud type | Overview | Examples | Challenges | Monitoring tools |
Public cloud |
| AWS, Microsoft Azure, Google Cloud Platform (GCP) | Scalability, visibility, and security. | Native tools (AWS CloudWatch, Azure Monitor, Google Cloud Operations Suite), third-party tools (Datadog, New Relic, SolarWinds). |
Private cloud |
| VMware, OpenStack, Azure Stack | Complexity, resource management, and strict security/compliance requirements. | In-house tools (Prometheus, Grafana), enterprise solutions (VMware vRealize, Red Hat CloudForms |
Hybrid cloud |
| IBM Cloud, Azure, Google Anthos | Managing the connection between public and private components, secure data transfer, and consistent monitoring. | Unified tools such as CloudZero, Datadog, Dynatrace), APIs and integrations, and custom dashboards. |
So, what are some of the best cloud monitoring tools available today to use with these best practices?
11 Cloud Monitoring Tools To Get Started
More than two dozen tools provide cloud monitoring as a service. While many tools offer similar features, some are more tailored to your organization’s monitoring strategy.
Let’s take a look at the top cloud monitoring tools available right now.
1. Sematext
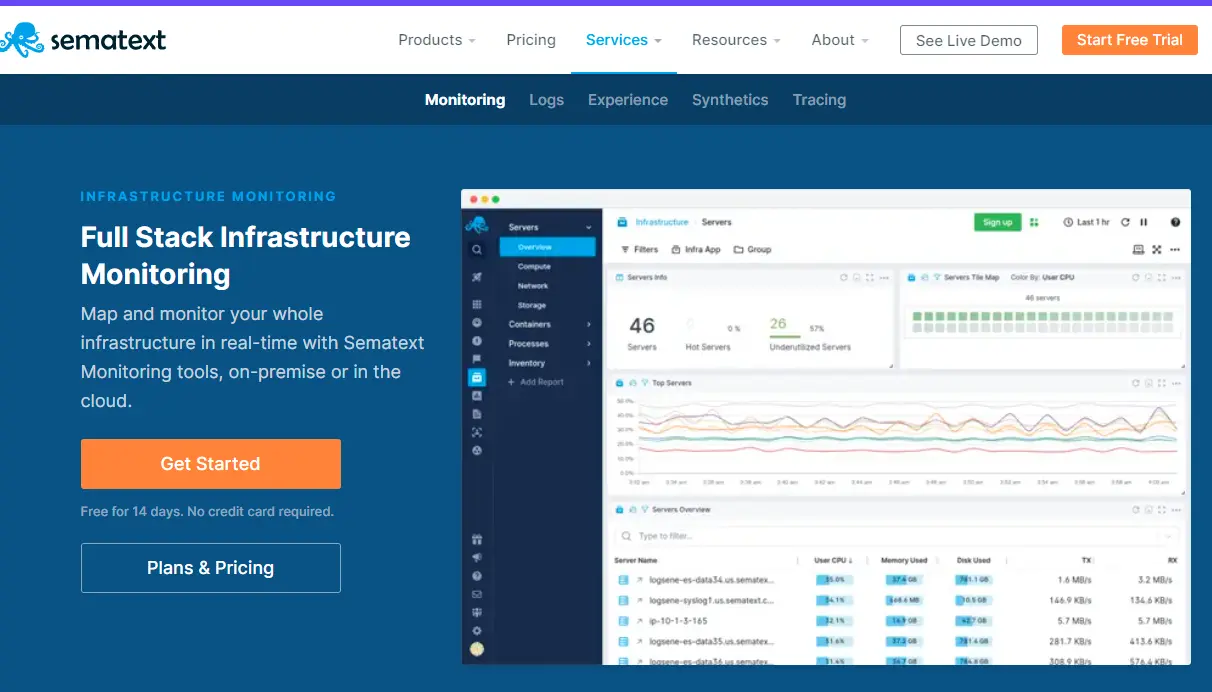
Sematext is a comprehensive infrastructure monitoring tool designed for DevOps teams to view all of their logs, metrics, and events in one unified dashboard. Sematext can monitor everything in real-time, including applications, servers, networking, and real-life users. It also keeps a history of your stack’s metrics.
In addition, now that Sematext has been open-source since 2018, you can better integrate it with your technology stack. Several sources are available for collecting metrics, such as REST APIs, JMXs, and SQL databases.
Sematext offers anomaly detection and alerting for hybrid, private, and on-premises environments so that you can stay ahead of failures everywhere.
2. Dynatrace
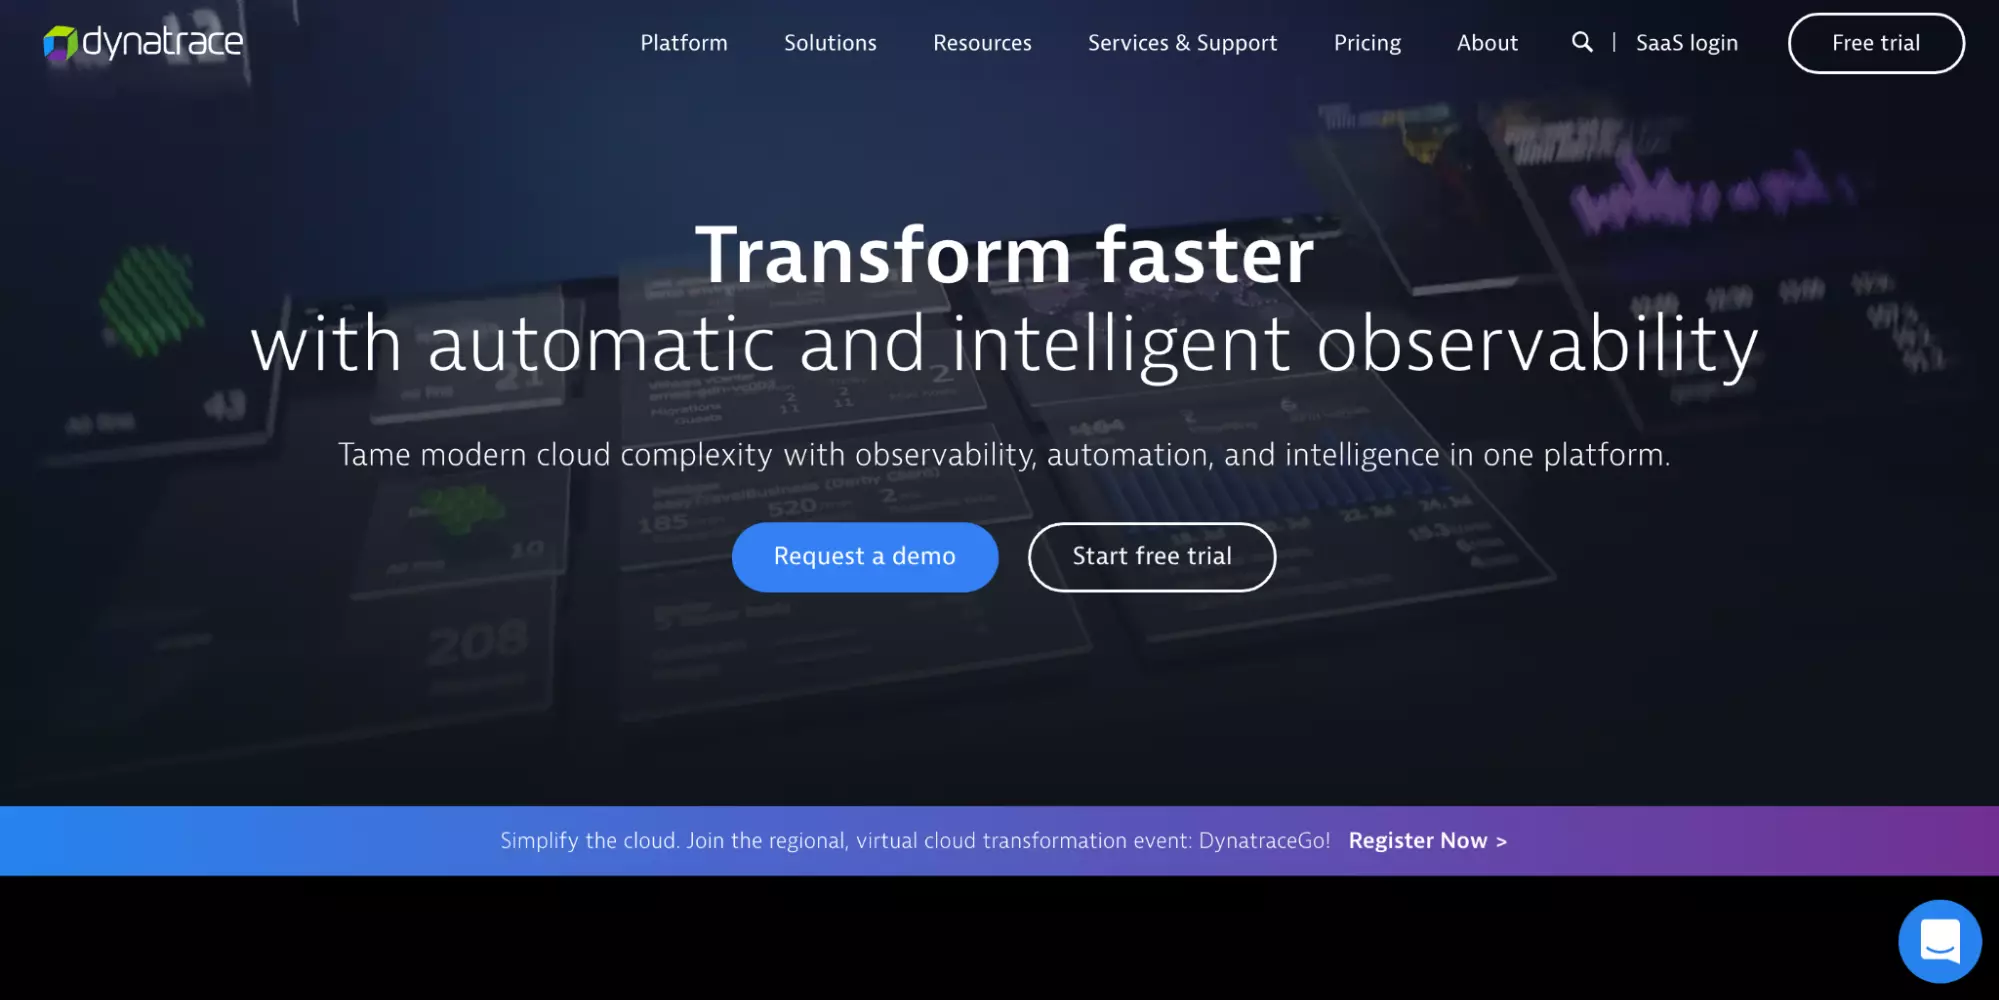
Dynatrace also offers full-stack monitoring, including app, cloud, and hybrid environment monitoring. You can also monitor real-user behavior on your online assets with it, so you can tailor your digital strategy to provide more fulfilling customer journeys.
Dynatrace also shows real-time and historical logs and events for microservices, containerized, application, services, serverless, and Kubernetes.
With Dynatrace’s open source project support on GitHub, you can easily connect it to your stack and improve cloud observability using over 400 integrations. Dynatrace is available as both a SaaS offering and as an on-premises solution.
3. Amazon CloudWatch
CloudWatch is a great place to start for running cloud-based applications and services in the Amazon Web Services (AWS) ecosystem. It provides a big-picture view of AWS services, metrics, logs, and events, such as Amazon EC2, Amazon RDS DB, and Amazon EBS Volume instances.
CloudWatch was developed to respond to customer complaints about lack of visibility, particularly into AWS resource utilization. Therefore, you can expect it to offer proactive resource utilization.
4. SolarWinds
One of the best SolarWinds features is it provides a unified visual monitoring dashboard for various components. The interface makes it simple to follow, zoom in and out of specific areas, or view how a cloud component affects the rest of your technology stack.
SolarWinds is also interesting in that you can use it as an all-in-one cloud monitoring platform or monitor specific items with one or more of its tools.
- Loggly for aggregating and analyzing logs
- Pingdom for monitoring websites and other digital experiences/assets
- Papertrail to grab quick views of your logs
- AppOptics for monitoring and analyzing application and infrastructure health, performance, and networking
SolarWinds offers comprehensive networking monitoring tools within and across clouds, such as Azure and Google Cloud.
5. Datadog
Datadog may suit you if you want to do large-scale application performance monitoring (APM) and boost visibility into your infrastructure with end-to-end tracing. Datadog can also track, view, and analyze logs, metrics, and events from networks, containers, databases, third-party tools, services, and more.
In addition, you can monitor synthetics, security, and real users in real time. You can also set up alerts using its incident management tool to determine when your cloud environments aren’t functioning correctly.
6. Redgate
Redgate can help those who do not need a comprehensive tool but need performance, availability, and security capabilities for their database. It is compelling for DevOps teams that use .NET, Azure, and SQL Server environments. You can use Redgate in the cloud or on-premises.
With Regate, your engineering team can run realistic database tests, monitor entire databases, and quickly secure sensitive data.
Then again, if you want to monitor more than your databases, here are a few more cloud monitoring tools you can use.
7. New Relic
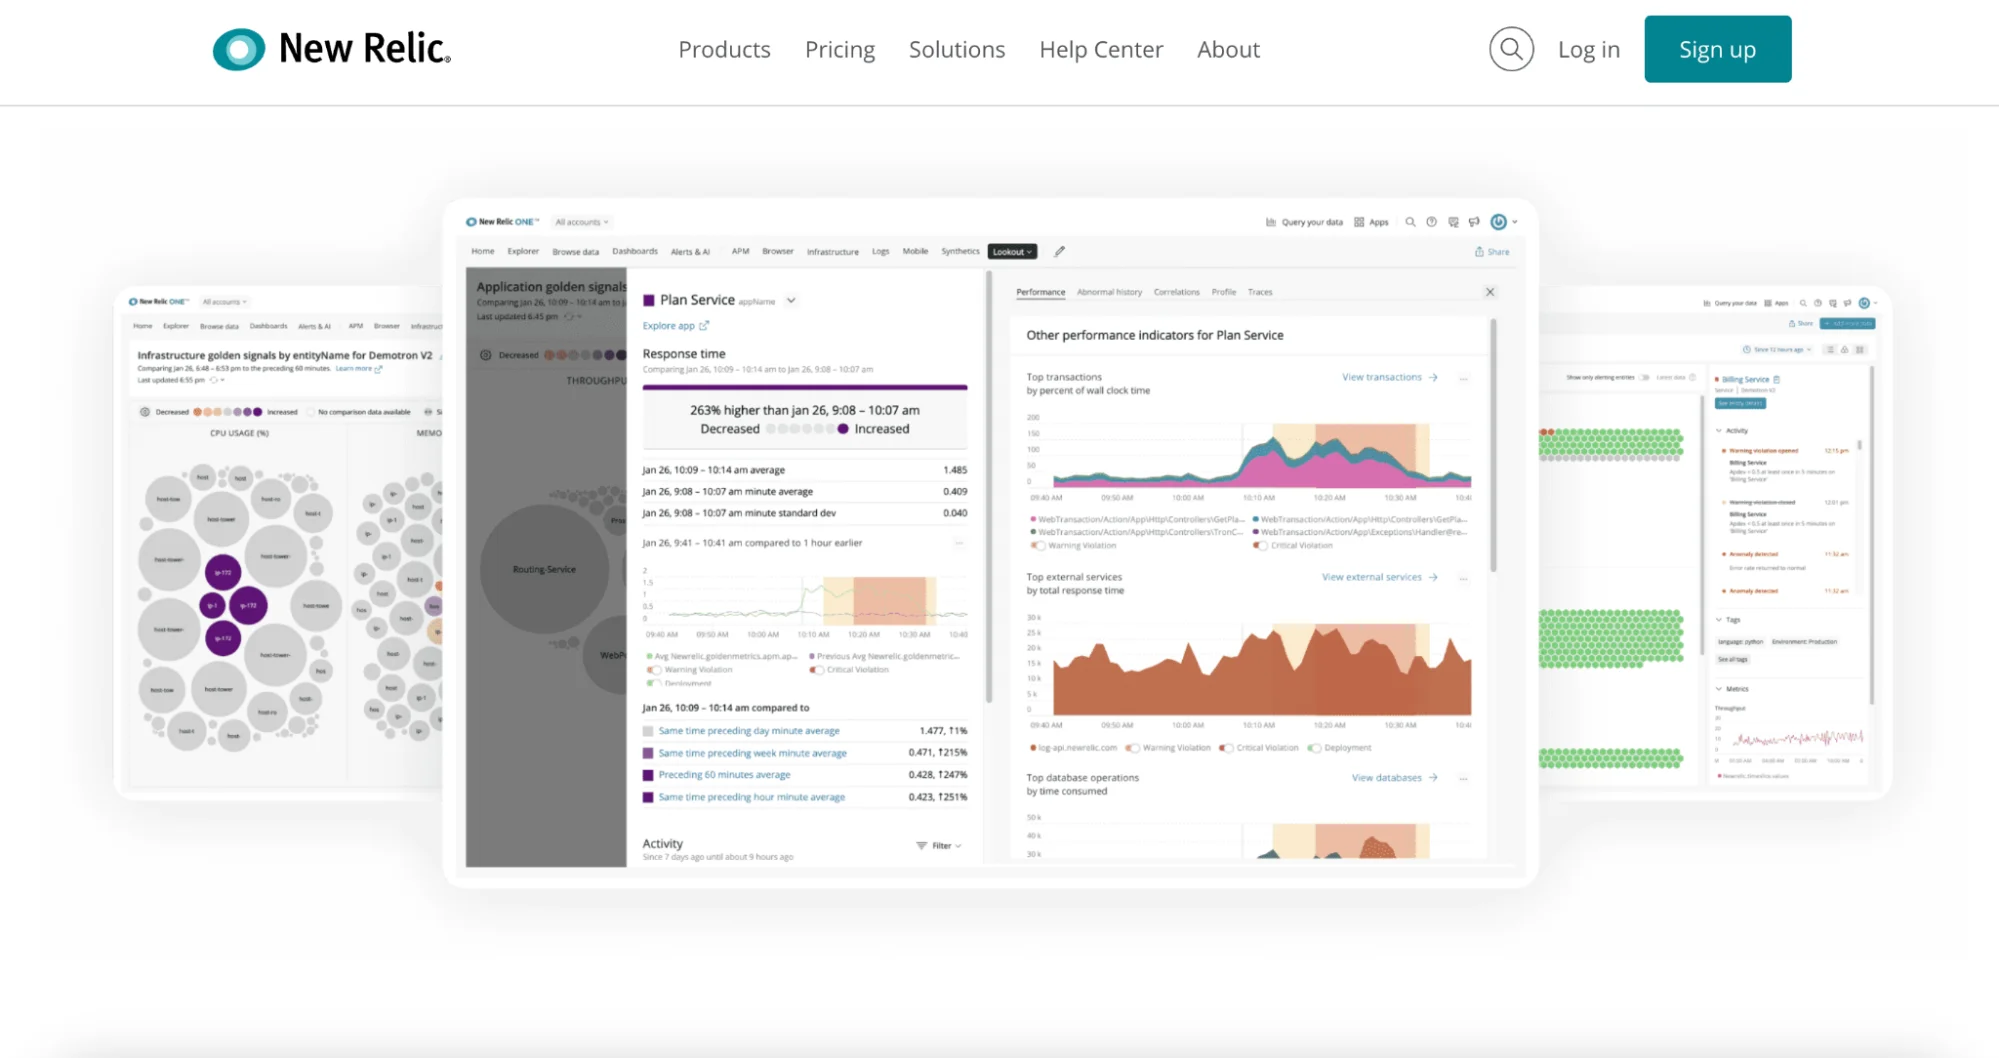
New Relic is a modern, top-to-bottom, and visually stunning tool for monitoring your mobile, web, cloud, and on-premises environments. It also supports real users, synthetics, logs, distributed tracing, and multi-cloud monitoring.
New Relic offers elegantly visual insights with Grafana Dashboards. It also displays the specific method calls for different app sizes to help discover incidents’ root causes.
The tool provides one of the most powerful querying languages (NRQL), as well as a comprehensive free plan to test it in a live environment before you subscribe.
8. Azure Monitor
Azure Monitor is a native monitoring tool for workloads running on the Microsoft Azure Cloud. It also supports custom metrics for external monitoring. With it, engineers can collect, analyze, and use telemetry-based insights to optimize Azure and on-premises environments.
You can expect a platform well-specced for gathering insights about infrastructure, apps, and services. The tool also monitors your application’s networking layout, services, and activity and will alert you when something is off. If you enjoy BI support, you’ll be pleased to see that it is included here, along with powerful workbooks for dashboarding.
9. Sumo Logic
With Sumo Logic’s cloud monitoring tool, you can capture and analyze all three types of telemetry (events, logs, and transaction traces) for security, operations, and business intelligence.
Sumo Logic can collect indicators of compromise (IoC), machine learning analytics, and real-time user activities so you can identify any security or operational issues before they affect your end-users. Its ability to analyze over 200 petabytes of data and complete over 20 million searches daily makes Sumo Logic ideal for enterprises or fast-growing startups.
The solution has multi-cloud support, and while it doesn’t offer as many integrations as the likes of New Relic, AppDynamics, and Datadog, it still provides enough to meet most needs with more than 150 integrations.
10. AppDynamics
AppDynamics provides robust monitoring and analytics for cloud-native environments. Like several other tools here, it is also a cloud monitoring tool and can be used on-premises.
Check it out if you’re interested in application performance management (APM), infrastructure health data, and enterprise-grade business analytics. You can also use it for monitoring Internet of Things (IoT) environments, web apps, mobile devices, and synthetic monitoring.
But AppDynamics goes even further to show DevOps engineers and executives the connection between their entire technology stack and actual business transactions. Expect it to support all the popular cloud providers, including Azure, Google Cloud, AWS, and on-premises workloads.
11. CloudZero
Most cloud monitoring tools track performance, security, networking, and dependency issues. However many don’t show how an item’s metrics, logs, and events relate to specific areas of your business and how they directly affect your bottom line.
This is where CloudZero comes in.
Using CloudZero’s cloud cost intelligence platform, you can detect, observe, and track changes in your cloud environment and see how those changes affect your cloud costs. Additionally, CloudZero allows organizations to see spend in the context of their business, such as how much specific customers, products, features, teams, and more, cost their company.
CloudZero’s automated cost anomaly alerts also help companies control their cloud budget and prevent cost overruns by detecting cost issues before they spiral out of control.
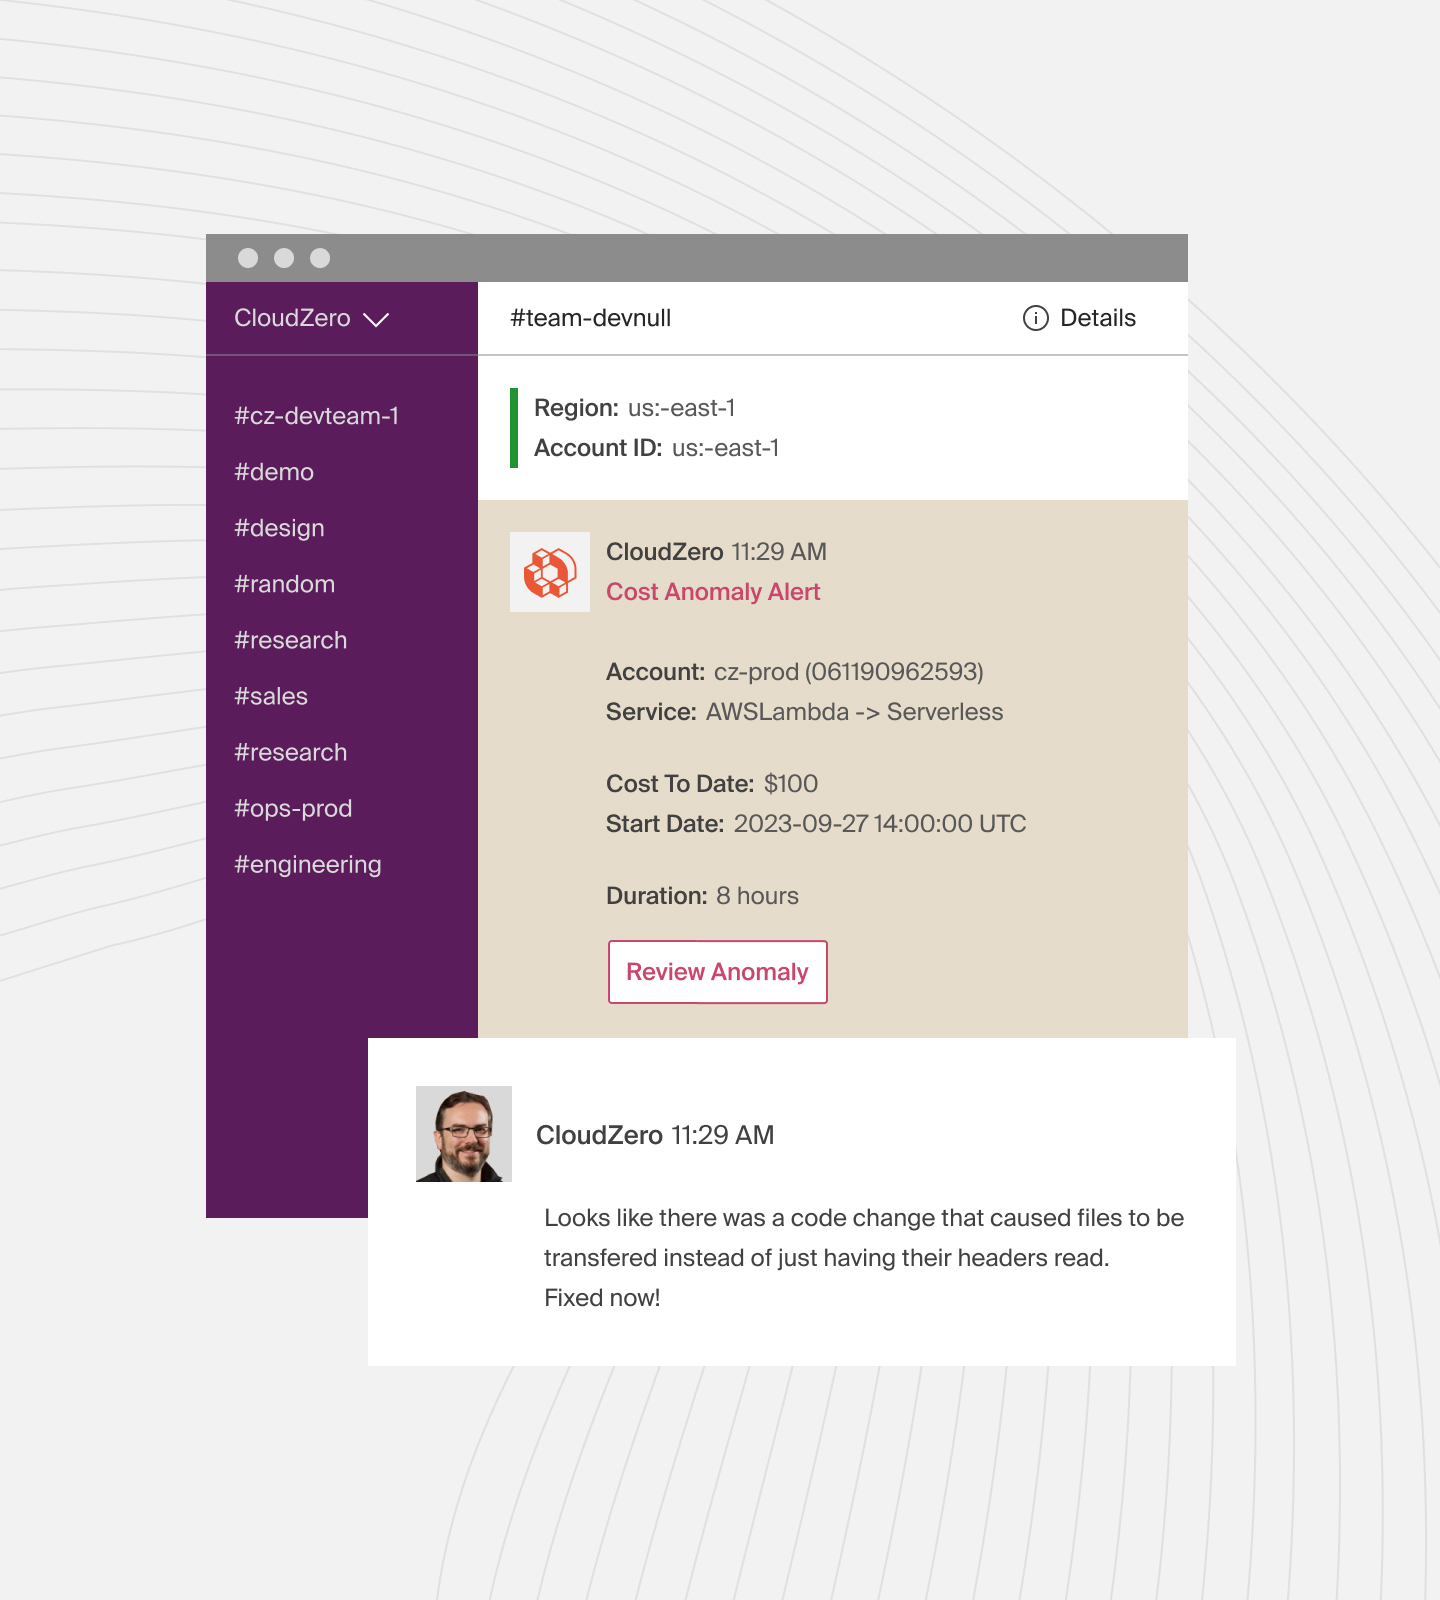
Ultimately, CloudZero gives organizations the visibility they need to monitor, control, optimize, and reduce their cloud spend — while also translating cloud costs to business metrics they care about, like unit cost, COGs, cost per customer, feature, product, and more.
Final Note: Align DevOps And FinOps To Your Cloud Monitoring Strategy
Aligning DevOps and FinOps with your cloud monitoring strategy is essential. Here are the impacts, and how you can use this strategy to maximize cloud performance and cost-effectiveness.
Improved cost management
Integrating FinOps with DevOps ensures that costs are considered in development and operations. This alignment helps teams understand the financial impact of their decisions. It also leads to more efficient use of cloud resources.
Optimized resource use
Aligning the practices of DevOps and FinOps enables more precise resource allocation and scaling. DevOps teams can use financial data to make informed choices about resource allocation. This prevents both the overuse and under-use of resources.
Enhanced visibility and accountability
Collaboration between DevOps and FinOps provides improved insight into cloud use and costs. DevOps teams understand the costs of their infrastructure and applications. FinOps, on the other hand, comprehends resource usage better. This openness promotes a culture of responsibility. In it, everyone is accountable for controlling costs and maximizing the efficient use of cloud resources.
Strategic decision-making
Collaboration between DevOps and FinOps allows for data-driven decision-making. Combining financial metrics with performance data gives organizations a clear understanding of the cloud environment. This enables strategic decisions about scaling, architecture adjustments, and new deployments. Aligning these teams ensures that both business goals and financial objectives are achieved at the same time.
Cultural shift towards cost awareness
Aligning DevOps and FinOps fosters a culture of financial awareness. This encourages teams to strive to cut costs without hurting performance or innovation.
 to see how CloudZero can give you holistic visibility into your cloud and AWS costs.