DevOps emphasizes continuous improvement, rapid delivery, and cost optimization. It does this by recommending several engineering best practices you can implement in your IT environments.
DevOps also emphasizes automation to improve efficiency and engineering velocity in software delivery.
In this guide, we will cover the importance of DevOps monitoring. This will include what to monitor and a list of some of the best monitoring tools for DevOps teams.
What Is DevOps Monitoring?
A DevOps monitoring process involves continuously identifying, tracking, analyzing, and reporting on specific components of IT infrastructure. Engineers also refer to DevOps monitoring as Continuous Monitoring (CM) and Continuous Control Monitoring (CCM).
DevOps monitoring has evolved significantly in recent years. Where teams once relied on siloed tools for infrastructure, applications, and logs, the industry has shifted toward unified observability platforms that correlate metrics, logs, and traces in a single view. This convergence — alongside the rise of AI-powered analysis and ephemeral infrastructure like containers and serverless functions — means the monitoring tools landscape looks very different than it did even two years ago.
In DevOps, the process follows a continuous pipeline. This pipeline consists of planning, developing, integrating, testing, deploying, and operating phases.
Practicing DevOps can be quite involving, but the benefits justify the effort. Some benefits of DevOps monitoring include:
- Define, track, and measure actual key performance indicators across all aspects of DevOps.
- Increase the observability of various components of your DevOps stack so you can identify when they degrade in performance, security, cost, or other aspects.
- Detect and report anomalies to the relevant teams quickly so they can resolve issues before they affect the user experience.
- Analyze logs and metrics to uncover root causes as quickly as possible. Tracking logs and metrics can help pinpoint where an issue started or occurred. As a result, your Mean Time To Detection (MTTD), Mean Time To Isolate (MTTI), Mean Time To Repair (MTTR), and Mean Time To Recovery (MTTR) can improve.
- Respond to threats on-call or automatically using a variety of tools.
- Find opportunities for automation throughout the DevOps process that will improve engineers’ DevOps toolchains and efficiency.
- Identify patterns in system behavior that a DevOps engineer should be on the lookout for in the future.
- Create a continuous feedback loop that improves collaboration among engineers, users (internal and external), and the rest of the organization.
By monitoring DevOps activities, an organization can maintain optimal customer experiences while reducing costs throughout the DevOps lifecycle.
Report
Finance needs to prove AI’s return: CloudZero report
260 senior finance leaders (more than half CFOs) told us why the speed of seeing AI spend, not the size of it, separates who pulls ahead on AI from who gets burned.
Why DevOps Monitoring Is Important
DevOps monitoring ensures efficient performance and security of IT systems. But it doesn’t just end there. Here are more reasons why DevOps monitoring is essential:
Improved performance tracking
DevOps monitoring enables teams to continuously and vigilantly monitor the performance of applications and infrastructure. This guarantees that issues are promptly identified and addressed. It also offers constant reassurance of enhanced system efficiency and user satisfaction.
Cost optimization
DevOps tools help monitor resource use and pinpoint areas for cost reduction. By understanding the impact of various components and activities, organizations can save costs and improve their budgets.
Proactive anomaly detection
DevOps teams can identify anomalies early by tracking important metrics and logs, preventing them from affecting end users. Taking proactive measures helps reduce downtime and ensure application reliability.
Enhanced collaboration
Continuous monitoring encourages collaboration between development and operations teams. By sharing insights and data, teams can solve issues and enhance productivity. This results in a smoother and more effective work process.
Continuous improvement
DevOps monitoring offers critical data that can enhance DevOps processes. By analyzing performance patterns, teams can improve the efficiency and effectiveness of their workflow.
Quick troubleshooting
Thorough monitoring allows teams to rapidly identify issues. This speeds up problem-solving processes. It also reduces the time needed to restore regular operations.
Better decision-making
Data insights from monitoring tools help make well-informed decisions. Teams analyze this information to determine which tasks to prioritize and allocate resources effectively.
Improved user experience
Through consistent monitoring, DevOps teams can ensure a smooth and satisfactory experience for end users. This includes ensuring services have optimal response times, availability, and reliability.
Security and compliance
DevOps monitoring involves monitoring security metrics and verifying adherence to industry standards. This assists in discovering vulnerabilities and upholding a safe IT setting. It also helps safeguard confidential data and maintain user trust.
Types Of Monitoring In DevOps: What Should You Monitor?
Continuous monitoring in DevOps comes in four main forms:
- Infrastructure monitoring
- Application monitoring
- Network monitoring
- Cost monitoring
Here are brief descriptions of each.
Infrastructure monitoring
Monitoring your DevOps infrastructure involves detecting, tracking, and compiling real-time data on your components’ health and performance. These components include servers (virtual or physical), databases, and middleware.
There are two types of infrastructure monitoring:
- In agent-based infrastructure monitoring, engineers install an agent (software) on each of their hosts, either physical or virtual. The agent collects infrastructure metrics and sends them to a monitoring tool for analysis and visualization.
- Agentless infrastructure monitoring doesn’t involve installing an agent. Instead, it uses built-in protocols such as SSH, NetFlow, SNMP, and WMI to relay infrastructure component metrics to monitoring tools.
There are advantages and disadvantages to each approach. Monitoring using agents, for example, collects more detailed information because it is tailored to the device or components you wish to monitor.
On the flip side, if you want to migrate to another platform, the agent may not be compatible with your new platform, resulting in data loss. Plus, the agents can be resource-intensive on your servers causing latencies or additional costs
Several infrastructure components, including VMs (such as Hyper-V and VMware), servers, networking, storage, and flow devices, come with built-in agentless monitoring capabilities. You can also manage these components’ monitoring centrally. You can combine the two approaches to build a comprehensive monitoring strategy.
Application (APM) monitoring
This ongoing process involves monitoring an application’s performance and availability, along with the effects the two have on a user’s experience. A monitoring application tracks your app’s hardware utilization, SLA status, platform performance, and user response times.
Server diagnostics, error logs, network traffic reports, historical statistics, and failure diagnostics are among the metrics DevOps engineers can monitor here.
Network monitoring
Here, engineers use software and hardware to monitor the health and performance of network components, such as switches, servers, and routers. Monitors track bandwidth, uptime, and bottlenecks, such as failed switches.
By performing periodic checks, monitoring tools can detect failing or failed incidents before they have an impact on user experience.
Cost monitoring
Tracking costs throughout the DevOps pipeline is essential for avoiding cost overruns. For a broader view of cost monitoring across cloud environments, see our guide to cloud monitoring tools.
Monitoring costs involves identifying resource usage. Besides real-time metrics, some advanced cost intelligence tools can collect exact costs per unit and per customer or project and share them with engineers and finance teams for further action.
This capability enables you to understand your Cost Of Goods Sold (COGS), gross margins, and resource usage at each phase of DevOps.
Security monitoring
Security monitoring in DevOps — sometimes referred to as DevSecOps monitoring — focuses on detecting threats, vulnerabilities, and compliance drift across your infrastructure and applications. This includes tracking access logs, audit trails, intrusion attempts, and configuration changes in real time. Tools like Splunk, Dynatrace, and Sumo Logic offer built-in security monitoring capabilities that integrate directly into CI/CD pipelines, enabling teams to catch misconfigurations and suspicious activity before they reach production.
Container and orchestration monitoring
As Kubernetes adoption continues to accelerate, container monitoring has become a distinct monitoring discipline. Container and orchestration monitoring tracks pod health, resource allocation, scheduling efficiency, and cluster-level performance metrics. Unlike traditional infrastructure monitoring, it must account for the ephemeral nature of containers and the dynamic scaling behavior of orchestrators. Tools like Prometheus (with kube-state-metrics), Datadog, and Sysdig specialize in providing teams with deep visibility into containerized workloads.
Metrics To Watch With Your DevOps Monitoring Tools
DevOps monitoring involves tracking the necessary metrics to ensure optimal system performance, reliability, and security. Below are some of the metrics to keep an eye on:
CPU usage
Tracking CPU usage is crucial as it provides insight into the amount of processing power your applications utilize. High CPU usage could be a red flag, signaling poor performance and the need for immediate action. On the other hand, reduced usage may imply resources are not fully utilized, indicating potential for optimization.
Memory usage
Monitoring memory usage is not just a task, it’s a critical responsibility. It’s essential for detecting memory leaks and ensuring applications have sufficient resources to operate smoothly. Excessive memory usage can lead to decreased performance and potential system crashes.
Log data
Analyzing log data offers essential insights into how applications and systems function. Monitoring logs helps recognize patterns, solve issues, and guarantee security adherence.
Network traffic
Monitoring network traffic helps in understanding the flow of data within your infrastructure. This helps identify bandwidth problems and potential attacks on networks. It also optimizes data transfer processes.
Disk input/output (Disk I/O)
Disk I/O metrics offer information about your storage equipment’s read and write processes. Keeping track of disk I/O can help identify storage performance problems, including issues with latency and throughput.
Service latency
Monitoring service latency assists in pinpointing communication delays within your application. High latency can affect overall performance and user experience.
Error rates
Monitoring error rates helps identify problems within your workflow. A sudden increase in errors can indicate deployment failures or misconfigurations.
Resource use
Monitoring resource use enables you to understand the efficiency of your infrastructure’s resource allocation. This involves monitoring your system’s CPU, memory, disk, and network use.
Response times
Keeping track of response times ensures your applications meet the desired performance levels. Delayed response times may result in poor user experiences. It also indicates underlying issues that call for immediate attention.
Deployment frequency
Monitoring the frequency of new code deployments can offer valuable information about the effectiveness of your CI/CD process. Frequent deployments can indicate a well-established DevOps process. Infrequent deployments might point to issues within the development cycle.
Uptime and availability
High availability and minimal downtime are crucial for keeping users satisfied. Monitoring uptime and availability metrics helps uphold service dependability. It also identifies areas for improvement.
Transaction volumes
Monitoring the number of transactions handled by your application helps you understand usage trends and determine scaling needs. It also helps you identify performance bottlenecks when there is high demand.
What Factors To Consider When Choosing A DevOps Monitoring Tool
Here’s a quick checklist of some of the crucial considerations to make when selecting monitoring tools for DevOps teams.
- All-in-one observability – Rather than having separate views that often lead to visibility gaps, you’ll want a solution that lets you view most components together.
- User-friendly interface – Select a monitoring tool with customizable dashboards and interactive features to help you tailor the information to your requirements.
- Automatic discovery – This automates the process of searching for and identifying IT assets in a network. It saves time and effort. Many monitoring tools offer this, but not all of them do.
- Real-time metrics, events, and distributed traces – Real-time analytics uses monitoring data as it becomes available, enabling you to detect errors before they become costly problems.
- Root cause analysis – This approach enables you to identify and fix the root cause instead of simply settling symptoms for a while before they return.
- Data retention periods – Most DevOps monitoring tools have specific data retention limits. A longer retention period will cost more, but it can help you identify system health patterns, especially when problems occur occasionally.
- AIOps and Machine Learning – AI-driven monitoring has moved from a differentiator to a baseline expectation across leading platforms. Modern tools use machine learning for anomaly detection that adapts to your specific traffic patterns, automated root cause analysis that correlates signals across services, and predictive alerting that flags degradation before it triggers an outage. When evaluating tools, look for AI capabilities that reduce alert noise and surface actionable context rather than simply adding another layer of dashboards.
- Resource usage and related cost monitoring – Cost is now a first-class metric for most organizations, as an estimated 27–32% of cloud budgets are wasted on average (Flexera 2025). Yet, most cost tools are clunky, inexact, and mostly deliver total and average cost — not specifics such as Cost per Customer, Cost per Deployment, or Cost per Request.
With these factors in mind, here are some of the best DevOps monitoring tools to support continuous improvement.
Top DevOps Monitoring Tools By Category
DevOps tools offer several benefits:
- A DevOps tool automates repetitive tasks. You can use this to free your engineers up so they can focus on only the most critical tasks, such as patching security threats or releasing advanced features more quickly to boost your organization’s competitiveness.
- Reduce human error to release reliable code more quickly.
- Improve the software development process using Continuous Integration and Continuous Development (CI/CD).
- Combining these DevOps benefits optimizes costs.
Here are some of the top monitoring tools you can use, organized into several DevOps categories.
Open-source DevOps monitoring tools
If you are on a tight budget or want continuous monitoring that you can customize, open-source software may be helpful. Here are four examples:
1. Nagios
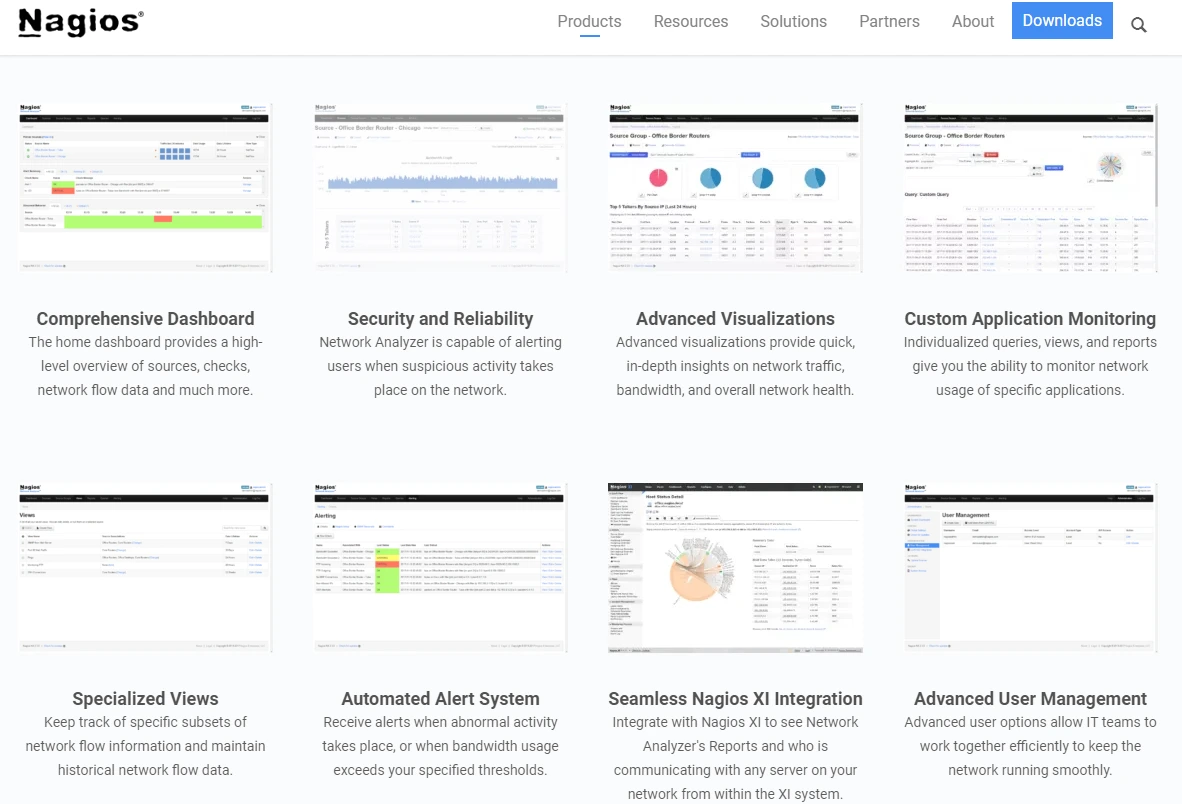
A pioneering DevOps monitoring tool, Nagios offers server, application, and network monitoring capabilities. It can track any device with an IP address. It also monitors multiple server services, including POP, SMTP, IMAP, HTTP, and Proxy under Linux and Windows. It enables application monitoring as well, including CPU, swap, memory, and load analysis.
Nagios is a free download, has a simple web interface, and supports over 5,000 server monitoring integrations. The free, open-source version of Nagios is called Nagios Core. The paid version, Nagios XI, monitors infrastructure, applications, networking, services, log files, SNMP, and operating systems.
2. Prometheus
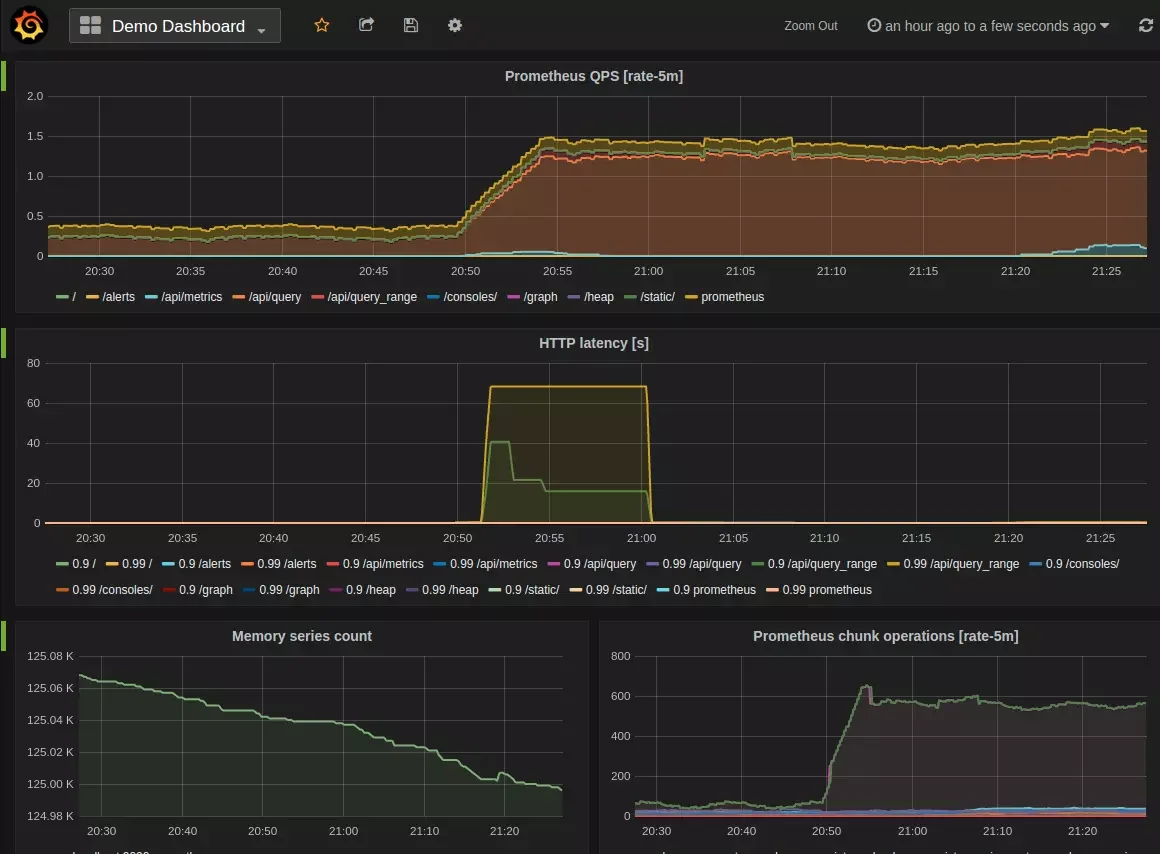
Prometheus is also downloadable. It comprises several monitoring tools useful in a DevOps culture, such as alerting, saving time series on local disks or memory, and displaying data graphically (with Grafana). It also supports many integrations, libraries, and metrics types.
Take a look at SysDig if you prefer a managed enterprise Prometheus monitoring service.
3. Zabbix
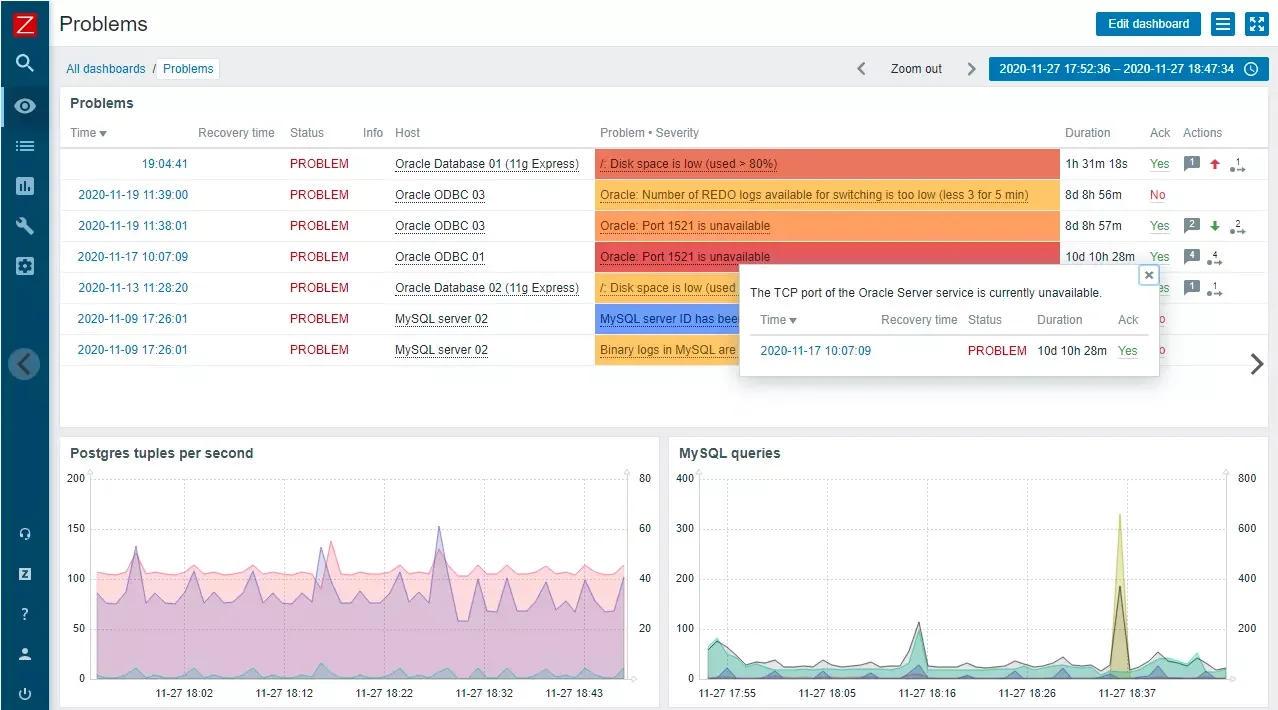
A top Nagios alternative, Zabbix also monitors real-time network traffic, services, applications, clouds, and servers. You can also run it on-premises or in the cloud. Zabbix 5.4 features improved distributed monitoring, high availability, and support for many types of monitoring metrics, allowing you to scale your monitoring capabilities in a continuously evolving culture like DevOps.
4. Monit
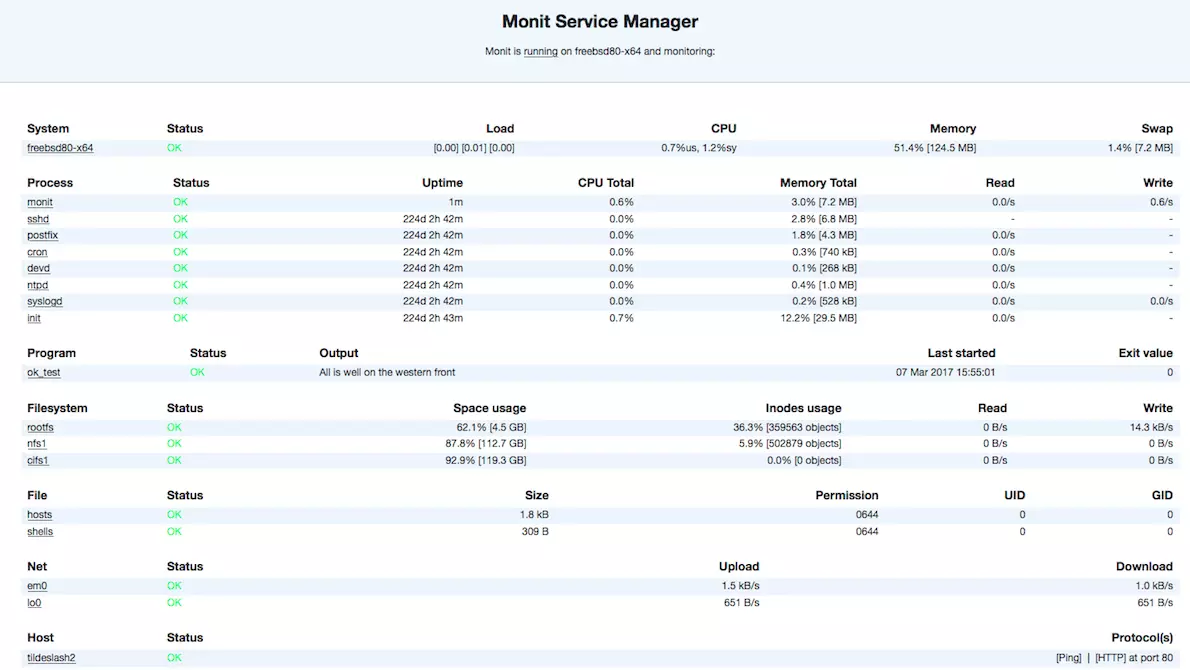
If you are looking for a small monitoring solution for Unix systems, Monit can help. In Monit, you can observe daemon processes, especially those that start at system boot from /etc / init /, such as Apache, sshd, SendMail, and MySQL.
Monit also offers error detection and alerting as well as monitoring for filesystems, directories, and files on the localhost. Also, you can use it to monitor cloud, host, and systems, including various internet protocols (HTTP, SMTP, etc.) and CPU and memory usage, as well as load average.
All-in-One DevOps monitoring tools
Here are some platforms that offer comprehensive DevOps observability and monitoring capabilities. By eliminating the need to operate different tools for different monitoring needs, these single sources of truth minimize costly visibility gaps, complexity, and waste.
5. Datadog
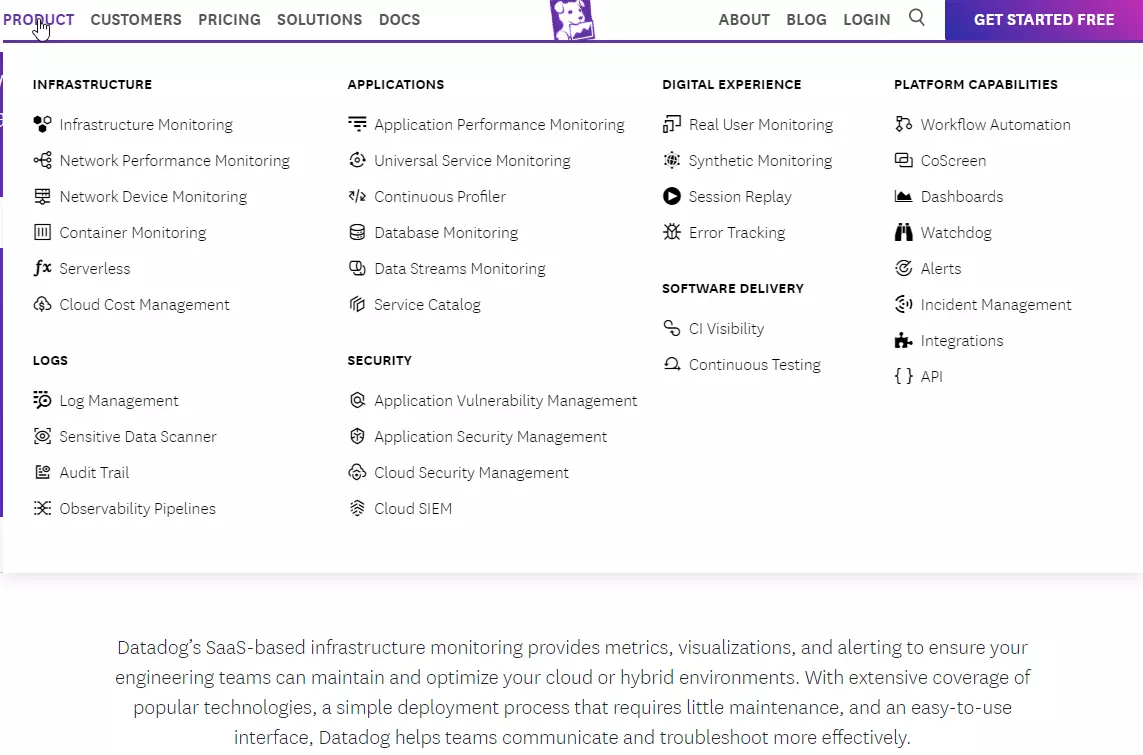
DevOps teams prefer Datadog because it delivers deep observability data with solid root cause analysis. You can use Datadog to collect, analyze, and share system monitoring data across on-premises infrastructure and cloud environments (private, public, hybrid, multi-cloud). This makes Datadog a robust choice for enterprise use.
The Cloud Monitoring as a Service platform is built on Go architecture and works across cloud providers, including AWS, Azure, and GCP. And if you are considering it for digital experience monitoring, it supports most devices and operating systems. It also helps that Datadog includes a cloud costs management function.
Datadog customers, however, complain that the service is expensive. So, below are a few competitors who are more affordable and capable. Or, visit 15 Datadog alternatives guide if you want a complete comparison of the competition.
6. New Relic
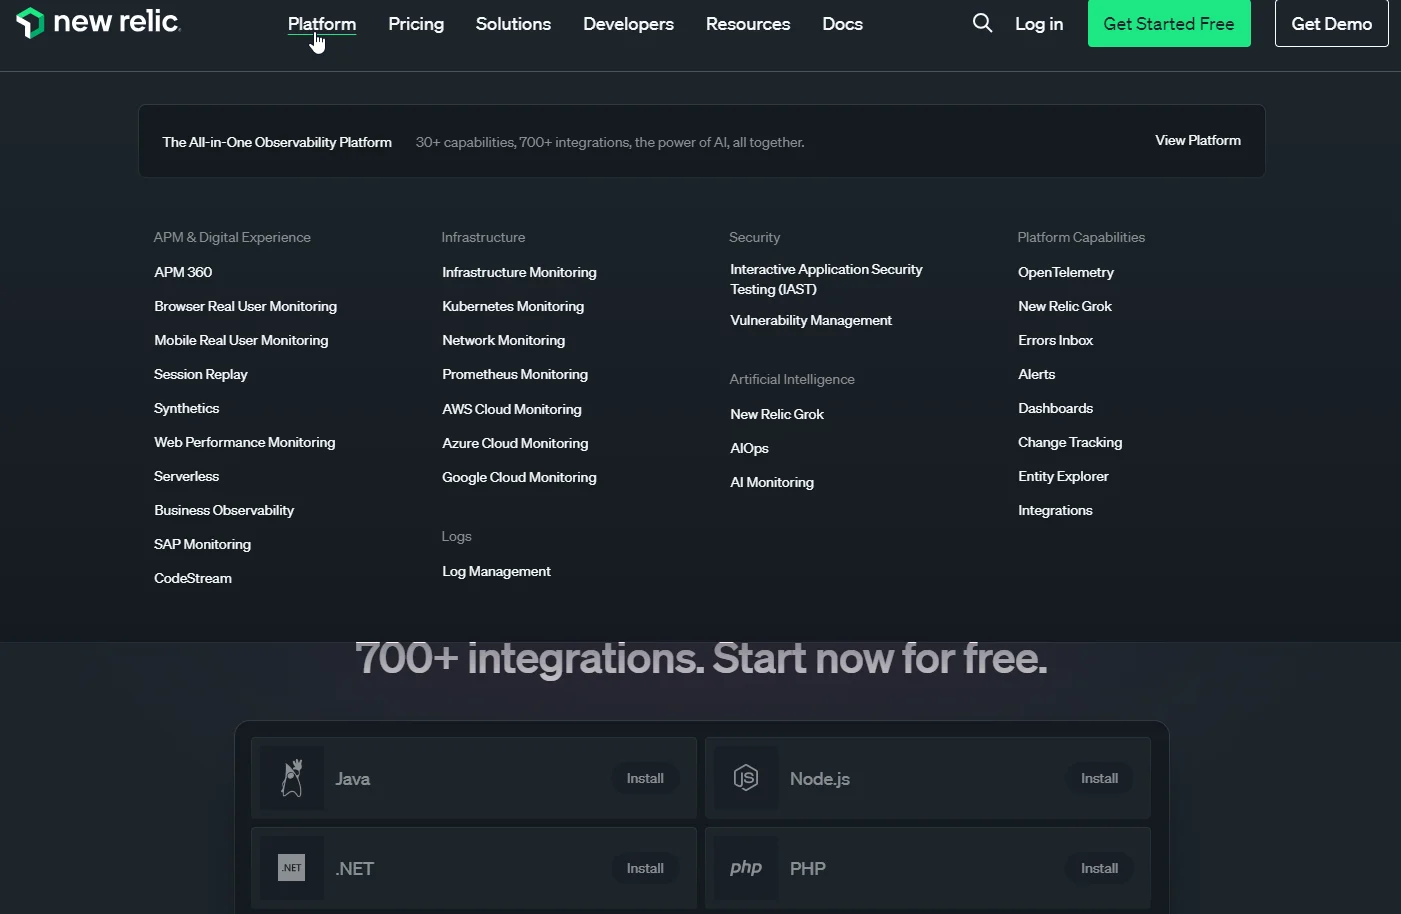
New Relic is a popular alternative to Datadog for several reasons. It offers robust error tracking, accurate anomaly alerting, and advanced container (Kubernetes) monitoring. New Relic also supports real-time code debugging without sampling.
Ultimately, New Relic is a full-stack observability platform, offering everything from infrastructure and APM monitoring to serverless and real user monitoring (RUM). In addition, it is built on OpenTelemetry, meaning it’ll play well with most tools/integrations in your stack now or in the future.
You’ll need to install the New Relic agent on your servers or each device you want to monitor. Also, New Relic doesn’t emphasize security and compliance monitoring as this next alternative.
7. Dynatrace
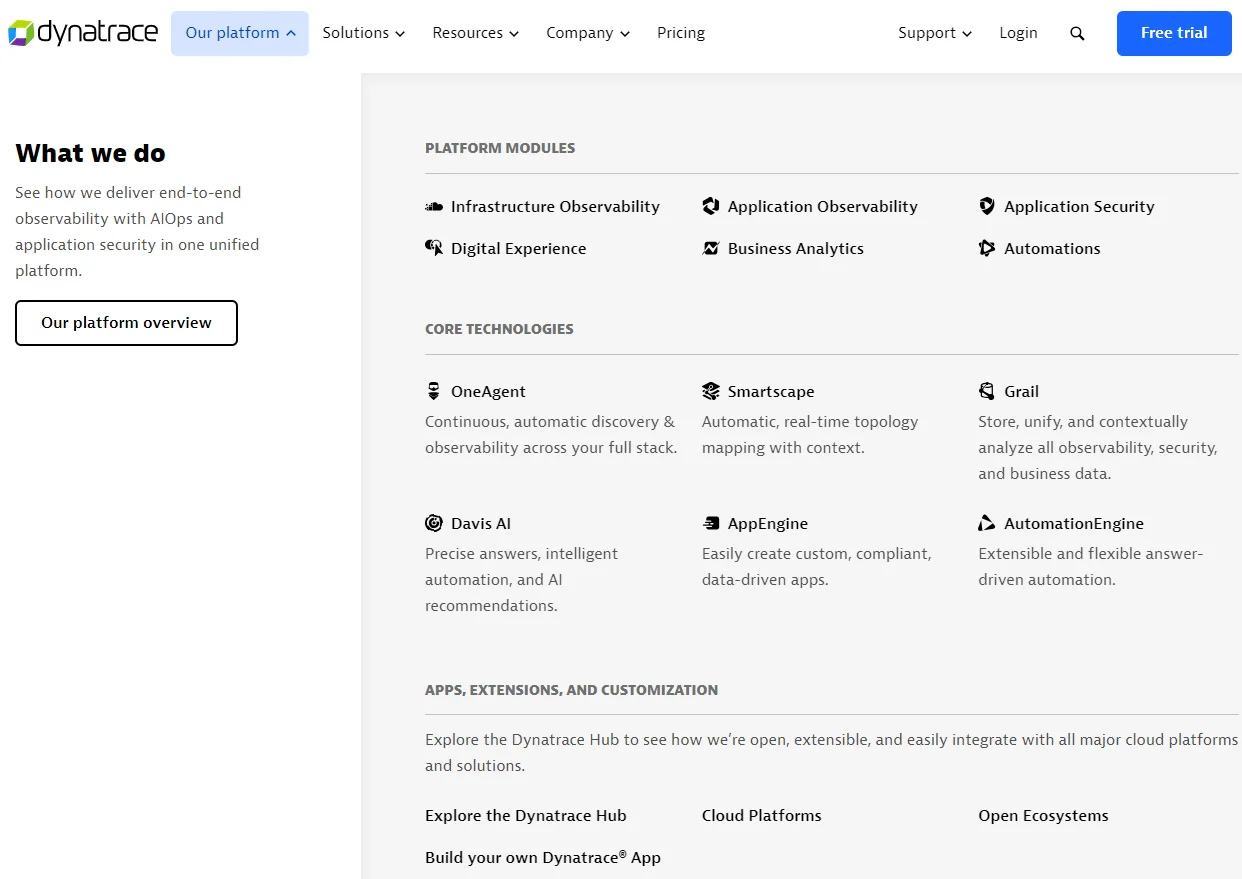
In addition to end-to-end observability for DevOps, Dynatrace emphasizes IT security with an arsenal of DevSecOps tools. Dynatrace uses intelligent automation to secure cloud-native apps at runtime. This means it integrates security into your CI/CD toolchains.
With Dynatrace’s Runtime Vulnerability Analytics and Application Protection, you can minimize exposure to zero-day threats. The DevOps team can continuously surface, analyze, and block app attacks, including command injection and SQL injection.
In addition, Dynatrace offers enterprise-level business KPIs monitoring, a platform for custom application development, and real-time topology mapping with context. Yet, Dynatrace may require some time to learn and optimize and its pricing can be complex.
8. LogicMonitor
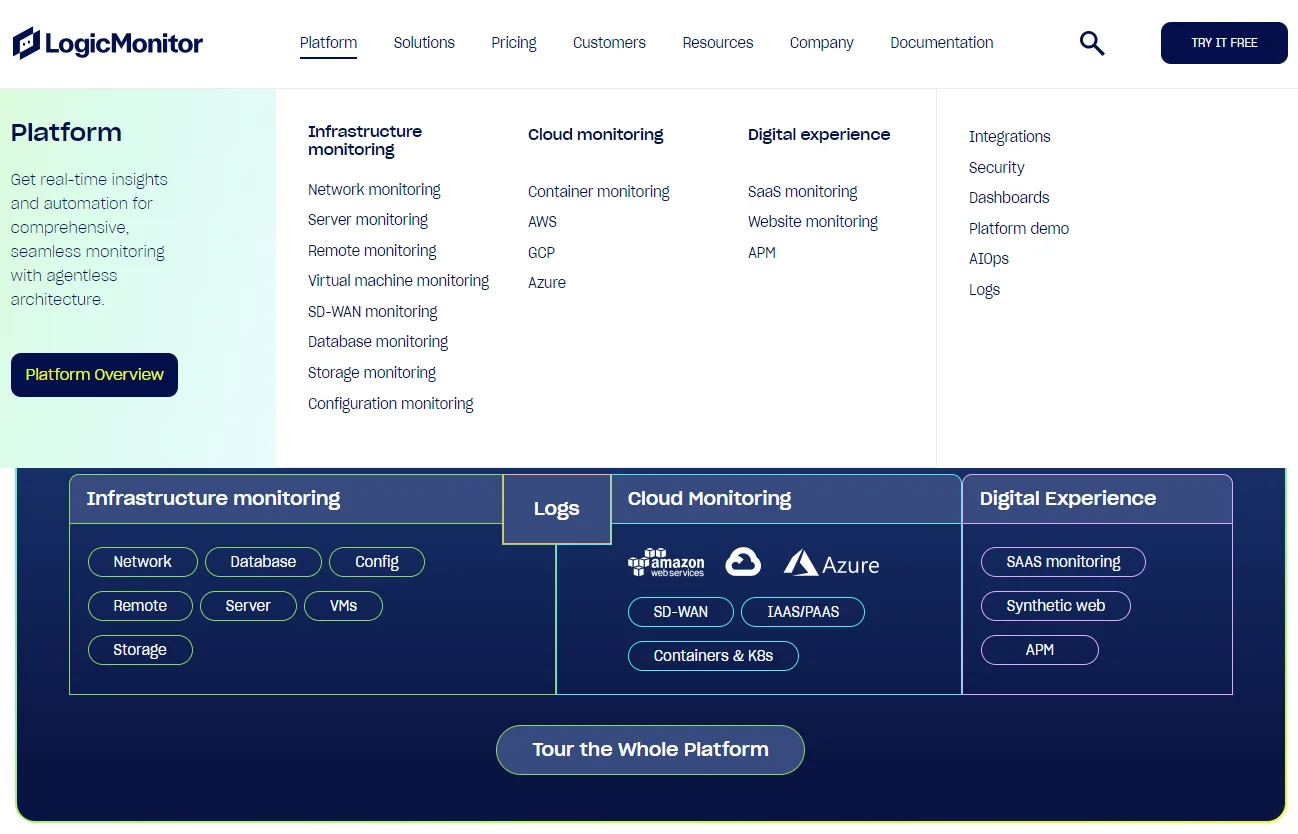
LogicMonitor is an agentless, full-stack observability platform for DevOps applications. Similar to other top monitoring tools here, LogicMonitor offers real-time monitoring in most areas, from Infrastructure to website monitoring.
The cloud-based platform also deploys in minutes, scales seamlessly, and supports hybrid observability (cloud-based and on-premises). It also provides deep monitoring for cloud-based, hyper-converged, and on-premises storage systems.
For companies that need assurance that their remote working strategy is safe, LogicMonitor’s remote and Software-Defined Network Monitoring (SD-WAN) can be a good choice. Plus, LogicMonitor secures your data both in transit and at rest, offers solid role-based access control (RBAC), and applies TLS encryption.
Application, network, and infrastructure monitoring tools
The following tools offer a nearly “all-in-one” solution for continuous monitoring.
9. Sensu by Sumo Logic
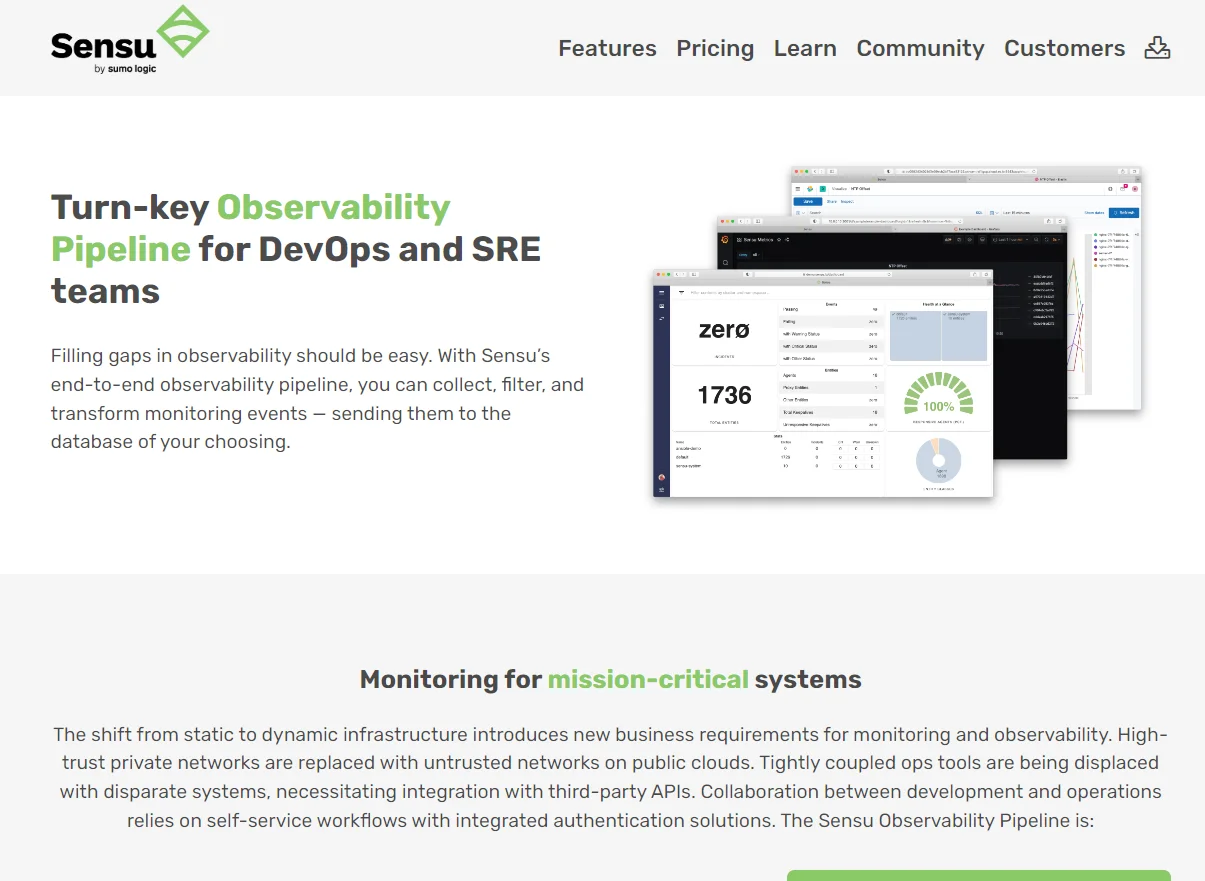
Sensu’s monitoring as code solution provides health checks, incident management, self-healing, alerting, and OSS observability across multiple environments. You can codify monitoring workflows in declarative configuration files and share them with your engineers.
You can also treat them like code, which means you can review, edit, and version them. Sensu Go is not only scalable, but it also integrates with other DevOps monitoring solutions like Splunk, PagerDuty, ServiceNow, and Elasticsearch.
10. Splunk
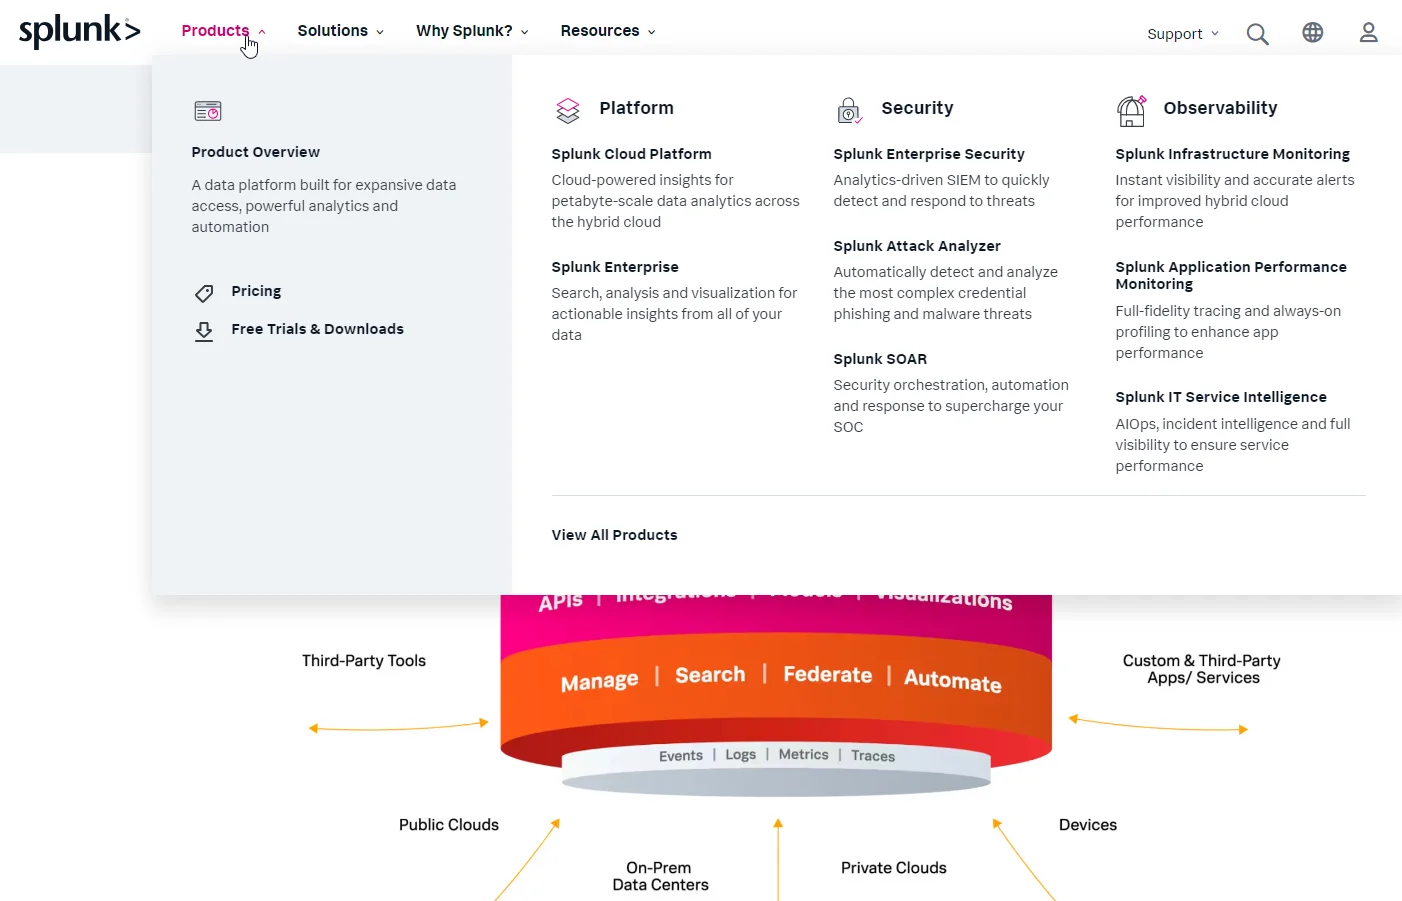
Splunk’s continuous monitoring features let enterprises monitor the entire application lifecycle. It provides real-time infrastructure monitoring, analytics, and troubleshooting capabilities for on-premises, multi-cloud, and hybrid environments. Also included are real-time alerts, full-stack visibility, Kubernetes monitoring, visualization, scaling, and monitoring automation in one place.
Splunk’s online community of over 13,000 active users and over 200 integrations can be a great source of support and customization as well.
11. ChaosSearch
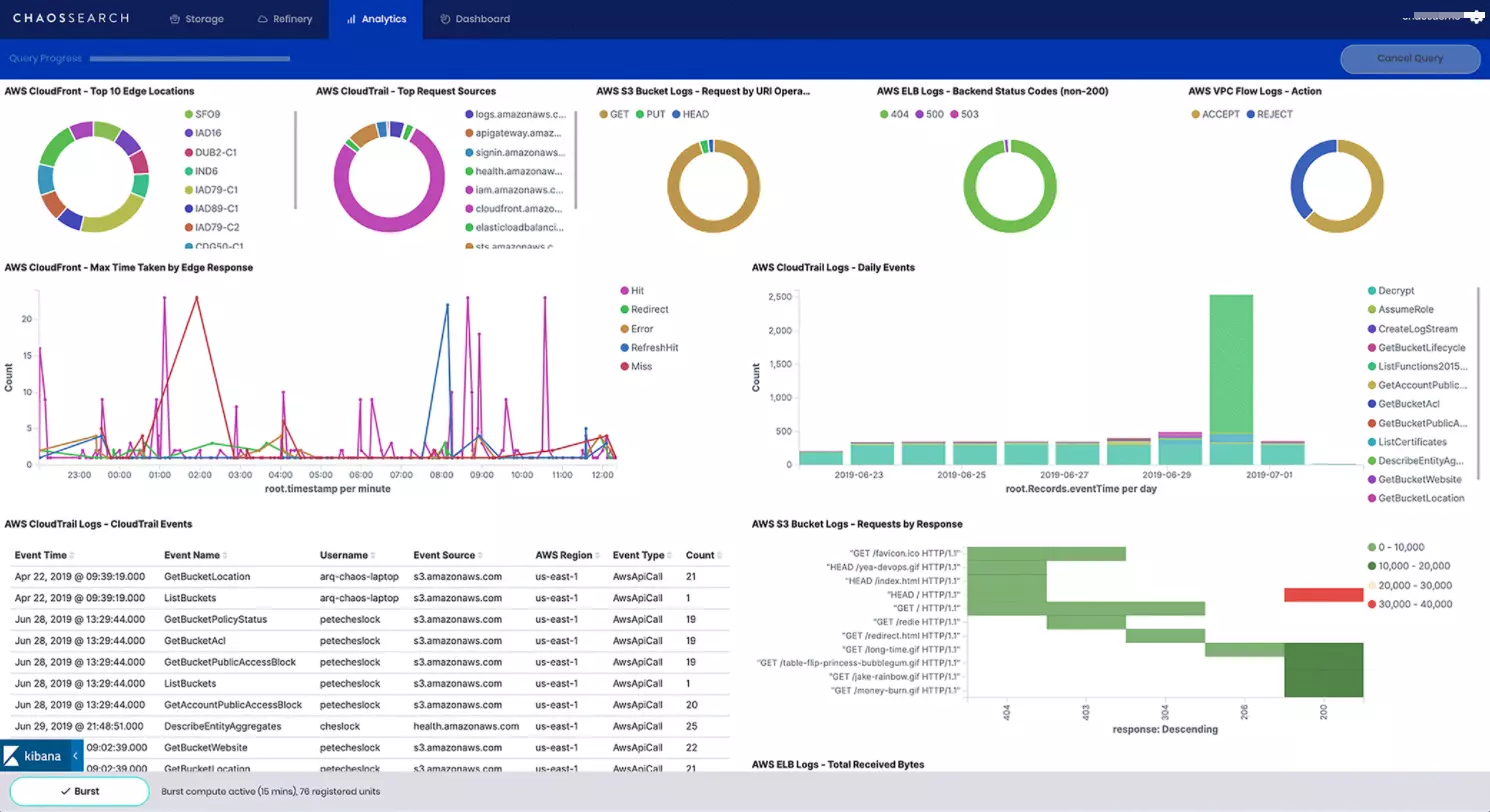
If you are comfortable using Amazon S3 or Google Cloud Storage buckets as your backend storage, ChaosSearch makes it easy to collect, aggregate, summarize, and analyze metrics and logs. You can also set up triggers and alerts to send engineers timely notifications about anomalies and monitor infrastructure components, including servers, load balancers, and services.
It also monitors Kubernetes or Docker containers. In addition to supporting storage-based isolation on Amazon S3, it also supports SSO and RBAC data protection.
12. Sematext
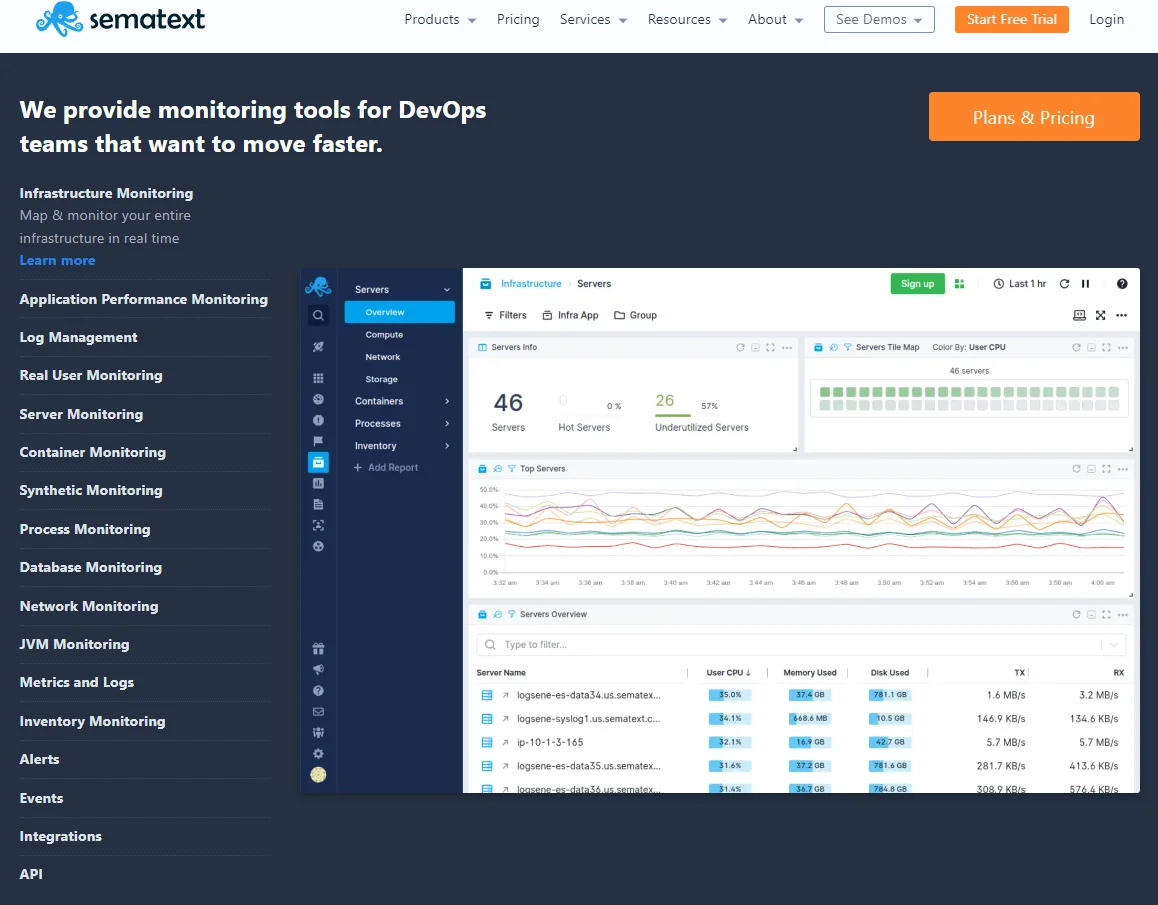
Sematext is an all-in-one monitoring solution designed for DevOps teams who need to monitor both back-end and front-end logs, performance, APIs, and the health of all computing environments.
You can also monitor real users, devices, networks, containers, microservices, and databases. Still, you can set up log management, synthetic management, and triggers and alerts. Sematext’s dashboards enable users to visualize all data and derive actionable insights from it.
13. Elastic Stack (ELK)
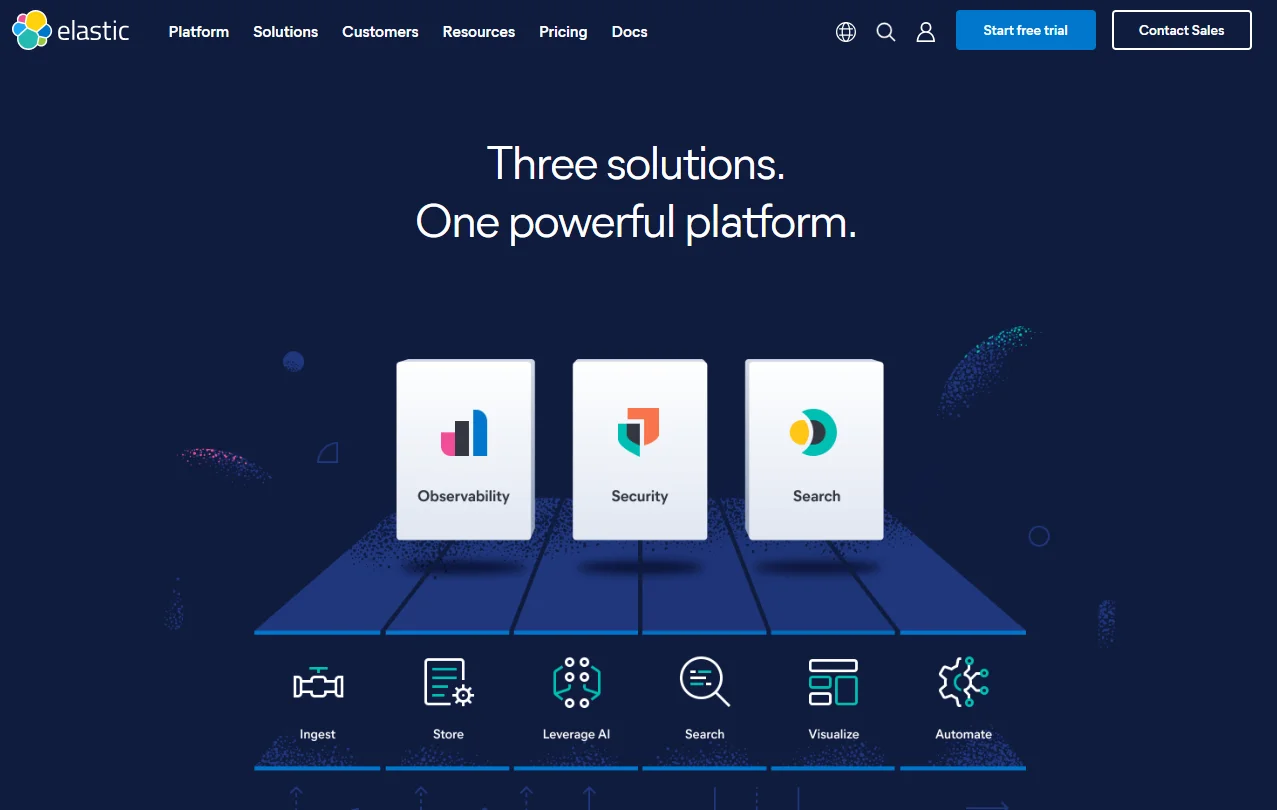
Engineers can store, search, and analyze data from multiple sources with Elastic Stack. The use cases for ELK include logs, SIEM, endpoints, metrics, uptime, and APM with security monitoring.
ELK is an acronym for ElasticSearch, Logstach, and Kibana, its three key components. Elasticsearch allows you to ingest data from any source, in any format, and simultaneously feed it to Logstash. Logstash processes the data on the server side while Kibana visualizes and shares the transformed and stored data.
Honorary Mentions: LogicMonitor, New Relic, Dynatrace, DataDog, Sumo Logic, and BMC Helix Operations Management.
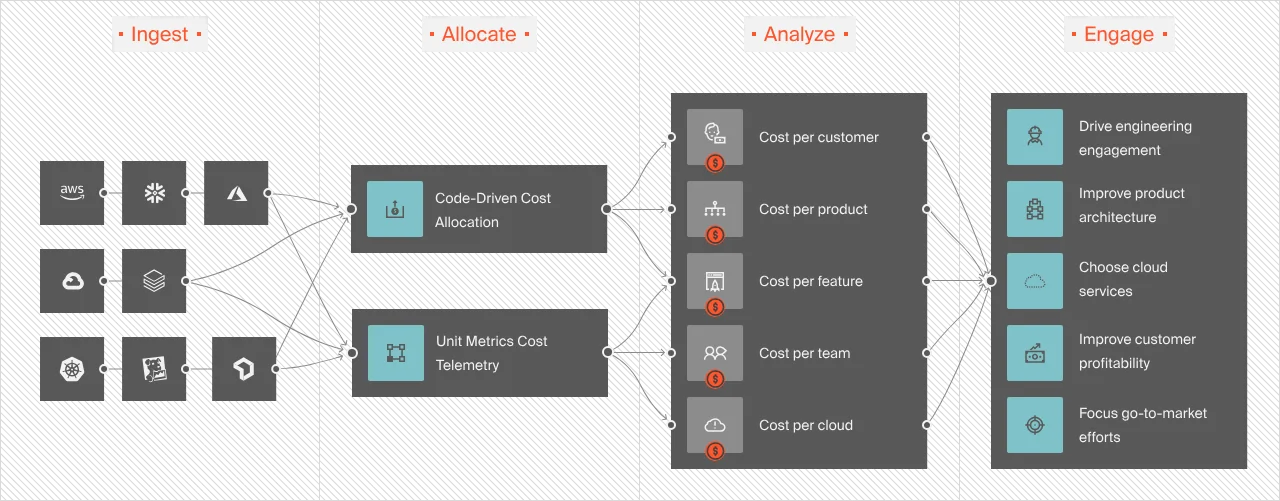
Data aggregation and cross-domain enrichment tool
This category includes a new generation of AIOps tools that leverage artificial intelligence and machine learning techniques to enrich telemetry data. AIOps tools help identify issues in your enterprise system by automatically collecting, analyzing, and reporting massive amounts of data from multiple sources.
14. Big Panda
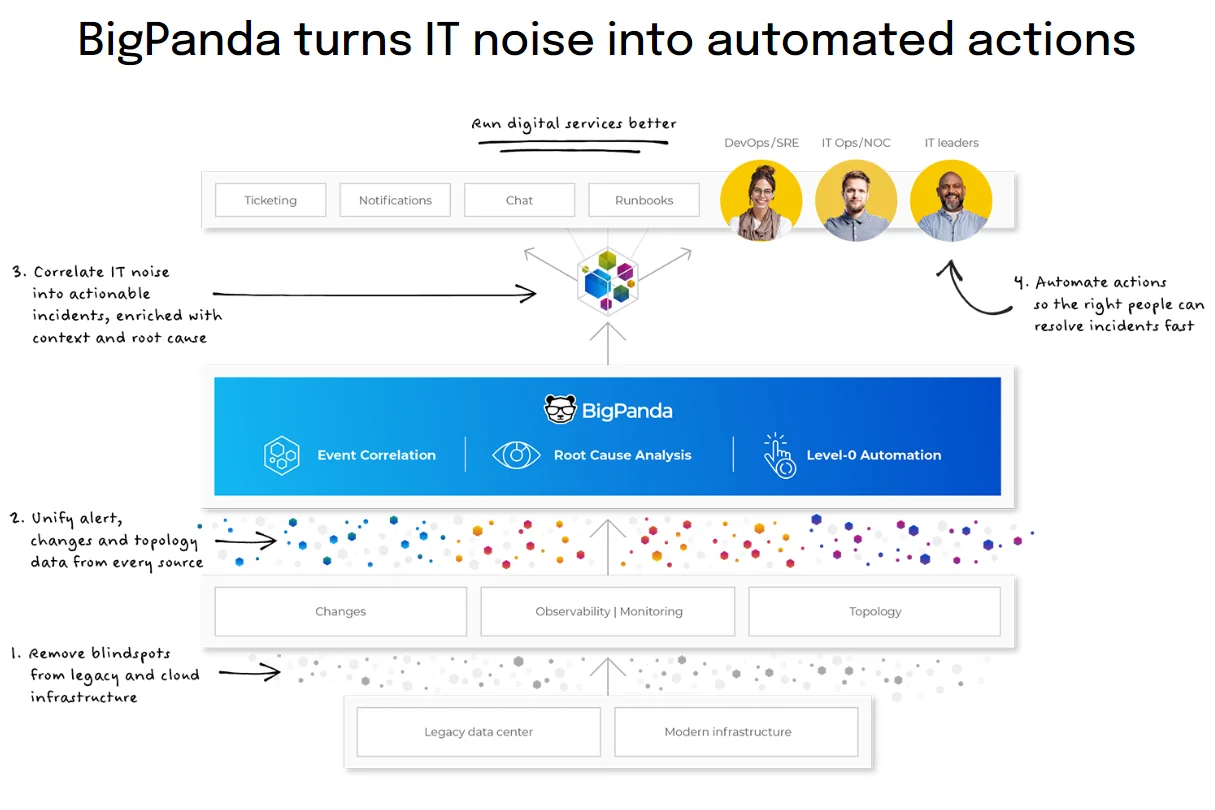
BigPanda’s event correlation algorithms automate the process of aggregating, enriching, and correlating alerts from various infrastructures, clouds, and applications. It reduces alert noise by combining different alerts into one, high-level incident. It also sends alerts via pre-defined channels, such as ticketing, collaboration, and reports.
15. Planview Hub (Formerly Tasktop Integration Hub)
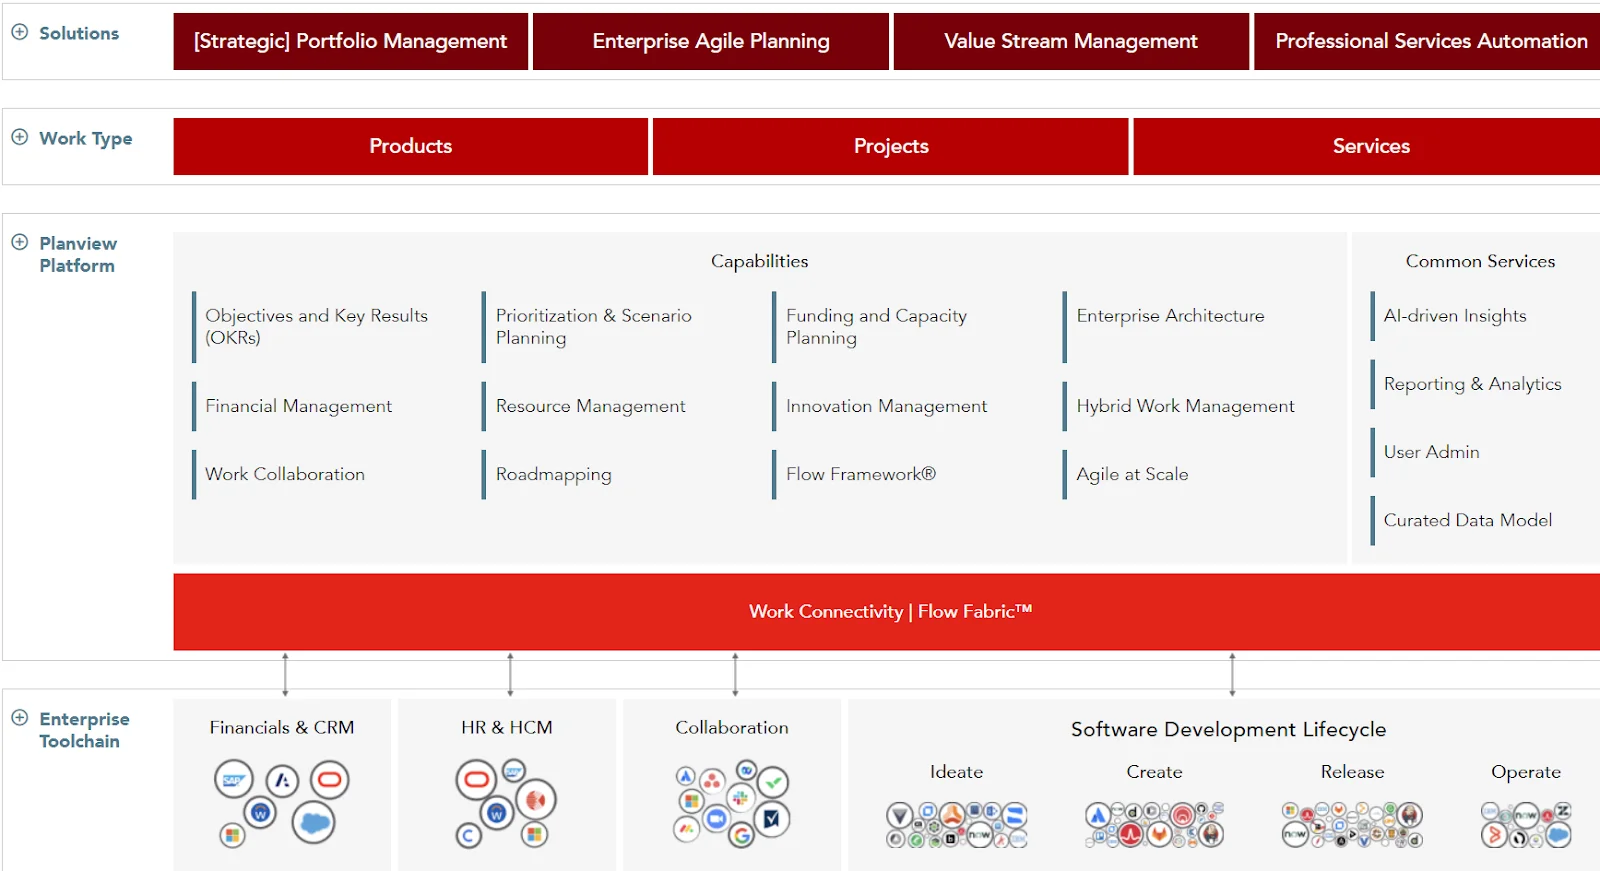
The Planview Hub enables DevOps teams to combine several vital software delivery tools instead of working with them separately. This is great if you want to keep everything, including Git and code quality assurance processes within a single platform.
Planview Hub comes with a ton of pre-built connectors to enable easier and faster no-code integrations. This supports a wide range of integrations to help automate your flows, from your favorite Git-based repository to tools like Jira and Azure DevOps to ServiceNow and Jama.
Compared to point-to-point integrations offered elsewhere, the Hub uses model-based integration, enabling faster integration setup, fewer mappings, and less time spent on maintaining integrations.
16. Librato (Now part of SolarWinds AppOptics)
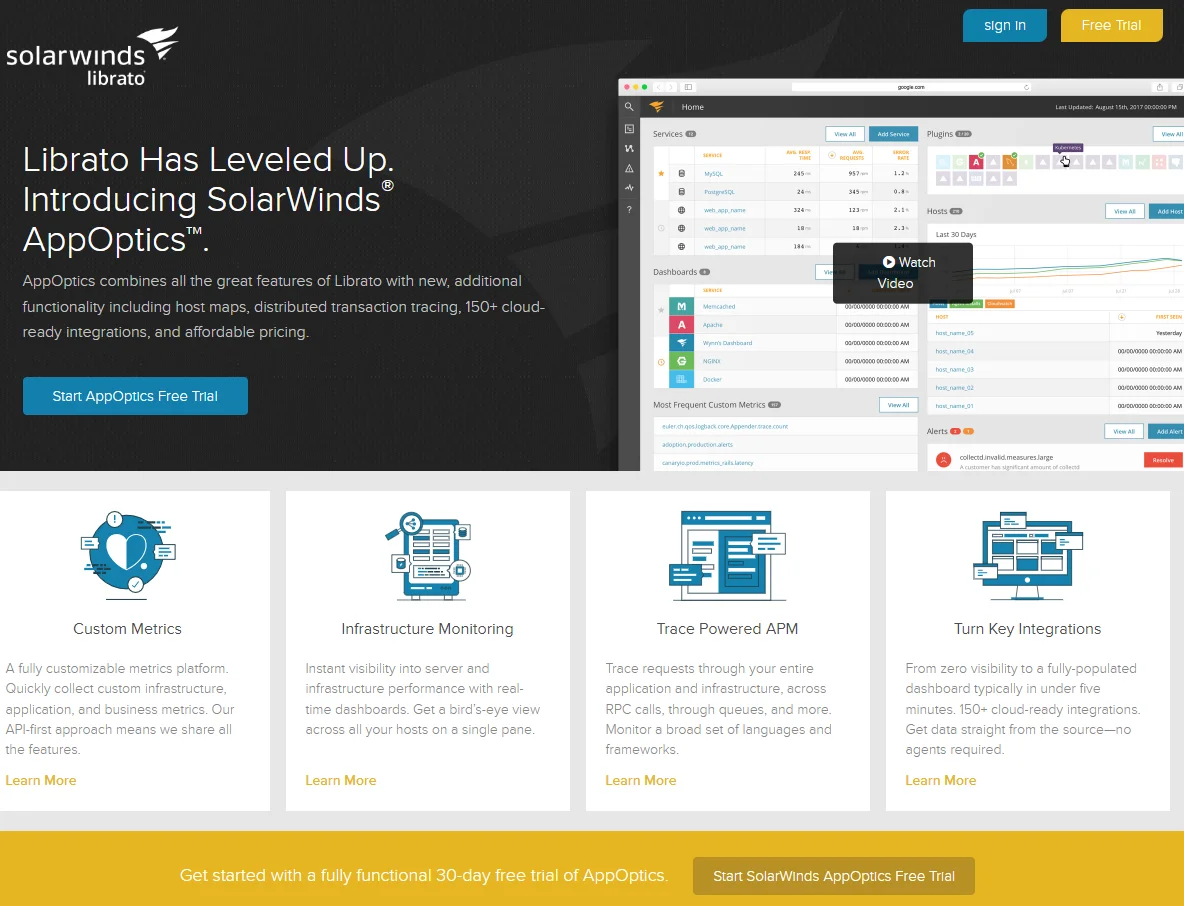
From its inception, Librato was designed to enable scalable and redundant monitoring of time-series data. The first step is to send data to Librato using one of the many turn-key integrations. Or, you can POST directly to your RESTful API.
By creating dashboards, you can display your metrics in charts and filter your data until you identify a specific issue. You also set up alerts for the most important metrics so you are always aware of the service’s health. This can be done via email, chat, or your favorite escalation service.
Librato supports Rails 3.x or Rack, as well as JVM-based applications and other languages. In addition to creating custom charts and workspaces, you can also add one-time events and set threshold-based alerts.
Users can collaborate with multi-user access, PNG chart snapshots, private Spaces links, and integrations with tools like Slack, HipChat, and PagerDuty.
Note: SolarWinds deprecated AppOptics in early 2026, with support ending January 31, 2026. Teams currently using Librato or AppOptics should consider migrating to SolarWinds Observability or an alternative monitoring platform listed in this guide.
Business service health monitoring tools
Traditionally, DevOps teams have focused on engineering instead of how their activities impact bottom lines. However, DevOps teams are increasingly focusing on monitoring sites, mobile devices, end users, and real users (RUM) thanks to Engineering-Led Optimization. Here are some tools you can use to optimize your efforts.
17. Akamai mPulse
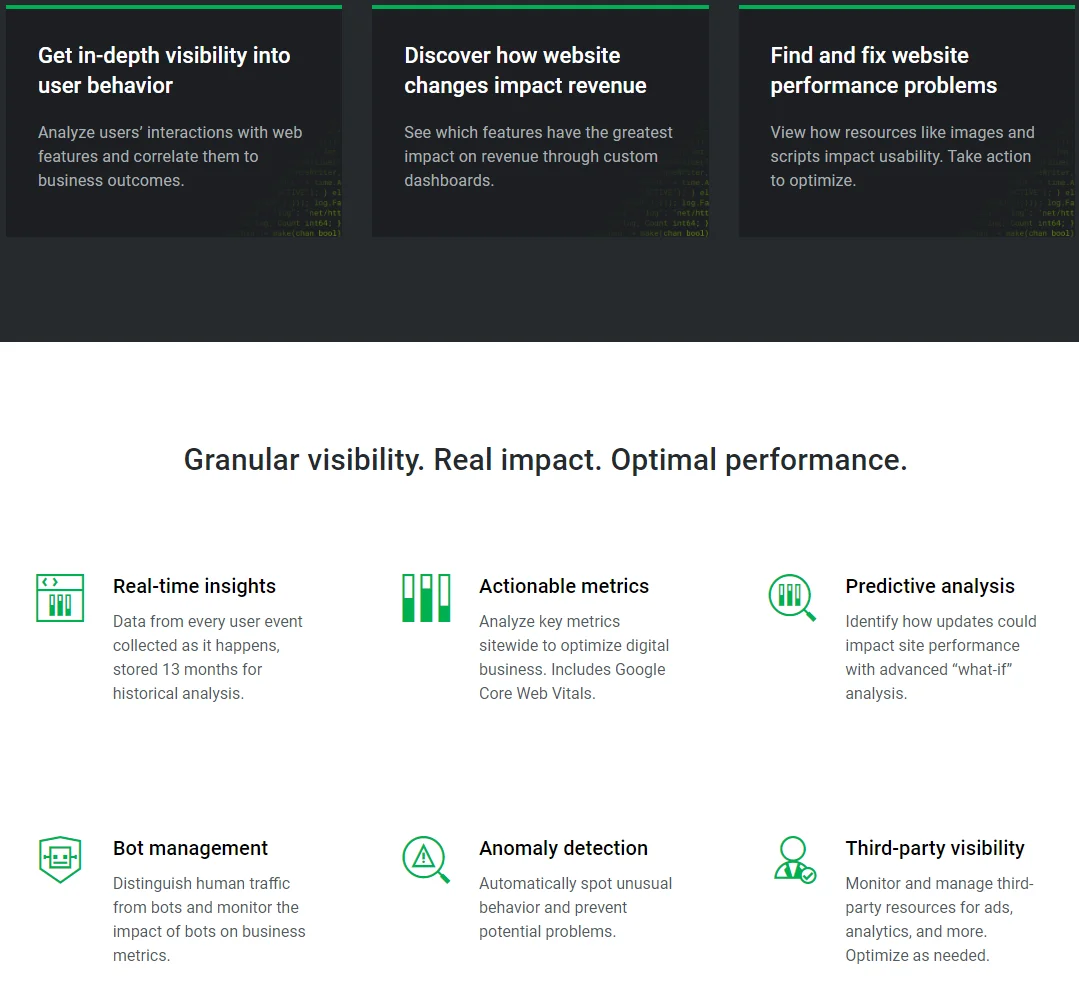
mPulse collects real-time insights on real user data to map their behavior to your business performance. It collects detailed data across 200 business and performance metrics directly from your users’ browsers. It then drills down to identify the root cause of latencies and revenue losses across all page views.
Expect to collect performance timers, including bandwidth and page load times. You can collect business metrics such as order totals, bounce rate, and conversion rate.
You receive real-time reports about real user activity as soon as the first mPulse beacon arrives. Widgets in your mPulse dashboard show breakdowns by segment, such as bandwidth distribution, page groups, geographical location, and browser type.
If your organization prefers, you can build custom dashboards to organize your data in the way that makes the most sense to it.
18. Sumo Logic
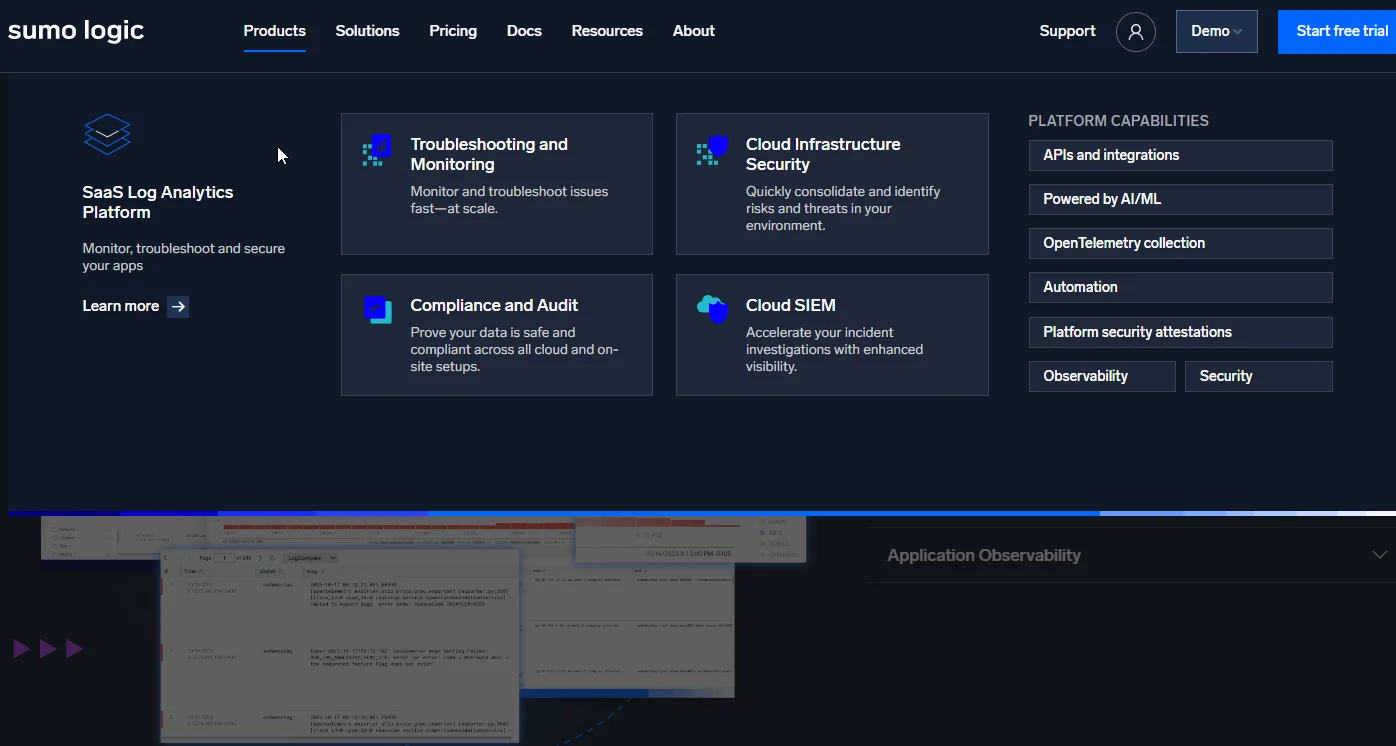
Sumo Logic is best known for its SaaS log analytics, business operations, and security monitoring, powered by AI and Machine Learning. It offers OOTB dashboards and AI-powered troubleshooting to help you visualize, analyze, and act on what’s happening in your business processes end-to-end.
Sumo Logic offers Cloud SIEM and Soar to help protect your data and workloads. Considering IBM estimates that a single data breach can cost as much as $4.5 million to resolve, Sumo Logtic’s emphasis on cloud security is great for most organizations — big or small.
Ultimately, Sumo Logic is a full-stack observability platform with capacity planning and forecasting. Additionally, it scales well compared to some alternatives. By consolidating all data from your infrastructure, applications, business, and end-users into one place, you’ll have a complete picture of your IT infrastructure.
It just isn’t designed for on-premises deployments, unlike alternatives such as Datadog and Sematext.
19. BMC Helix Operations Management
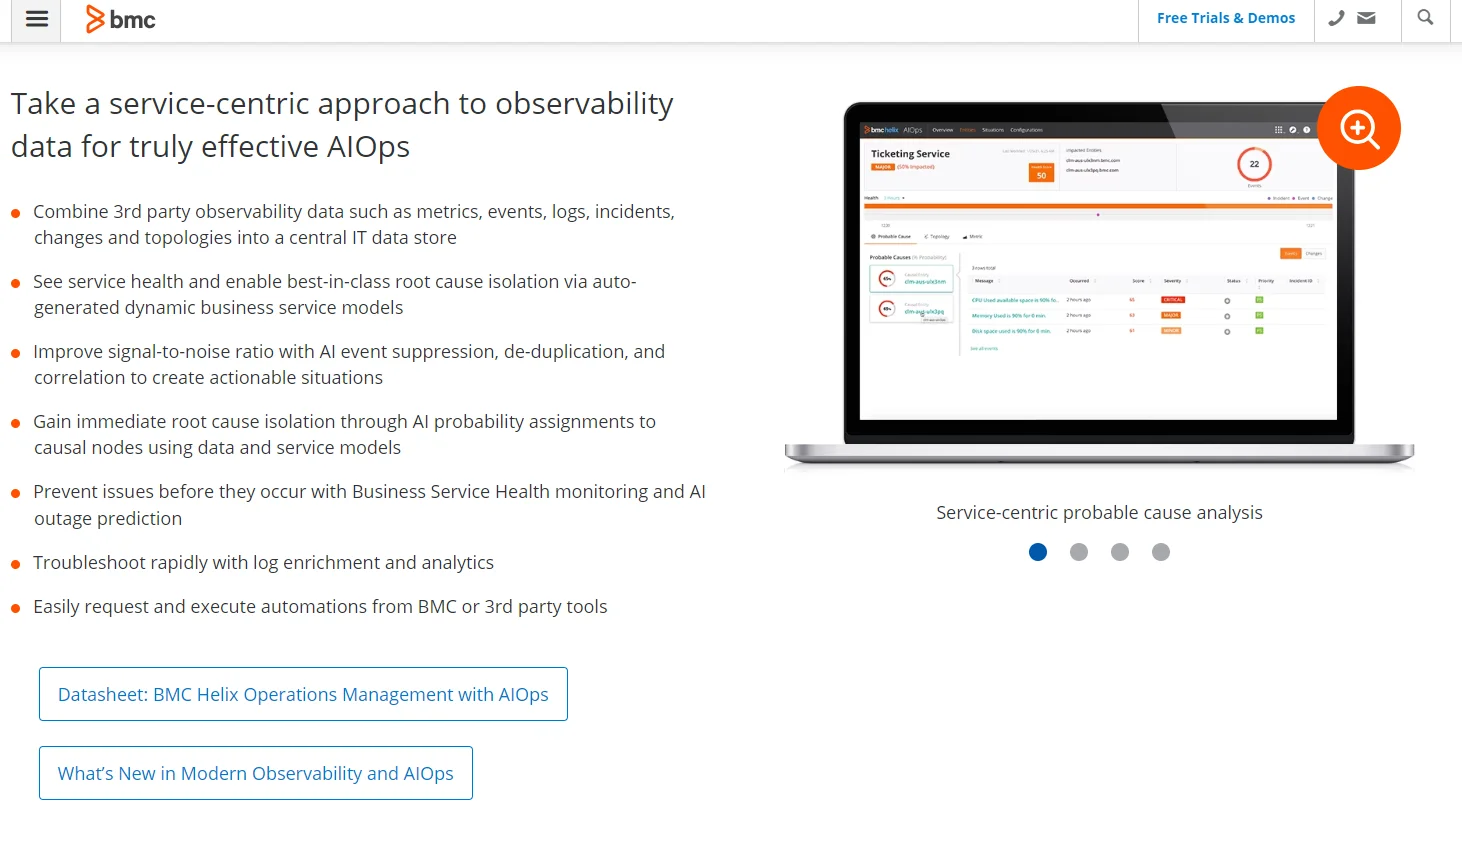
The Helix Operations Management tool was designed to improve observability within hybrid cloud environments. To achieve this, it combines automation, AIOps, interactive dashboards, log analytics, events management, and user-friendly workflows in one place.
BMC Helix Operations Management is also great for visualizing real-time activity within your containerized applications. Monitoring these activities can help you understand how technical issues are affecting customer satisfaction – and thus your bottom line.
More importantly, you can use root cause analysis, predictive analytics, and more of its tools to resolve these bottlenecks to protect your business interests.
DevOps Source code control tools
DevOps is characterized by multiple teams working on code simultaneously to foster rapid and frequent application updates. The continuous improvement results in many code changes. Teams must be able to ensure all engineers are using the same version of source code. Source code control tools help with that.
20. Git (GitHub, GitLab, and BitBucket)
Many DevOps teams use Git as their source code management platform. Its local branching model, multiple workflows, and staging areas make it a popular alternative to Mercurial, CVS, Helix Core, and Subversion.
It is installed locally, however. GitHub allows for remote teamwork and distributed source code control in the cloud. Bitbucket and GitLab are both suitable for enterprise use cases.
Monitoring CI/CD pipelines and configurations
Jenkins, RedHat Ansible, Bamboo, Chef, Puppet, and CircleCI are some of the best CI/CD tools out there. Monitoring the CI/CD pipelines of these tools can increase visibility into your pipeline in all environments, whether it is in development, testing, or production.
21. AppDynamics
There are several tools and methods for getting visibility at the code level. As an example, you can use Jenkins with Prometheus (ingest and store) and Grafana (visualization). Or you can use an end-to-end continuous monitoring solution for your CI/CD pipeline, such as AppDynamics or Splunk.
AppDynamics provides real-time customer and business telemetry, enabling you to monitor infrastructure, services, networks, and applications with multi-cloud support. It also offers visibility into Kubernetes, Docker, and Evolven. It also provides root-cause diagnostics, a pay-per-use pricing model, and hybrid monitoring.
Test server monitoring
A test monitor evaluates an ongoing test and provides feedback. In addition, test progress monitoring and control involve several techniques and components that ensure the test meets specific benchmarks at every stage. Selenium is an excellent example of a test progress monitoring tool.
22. Selenium
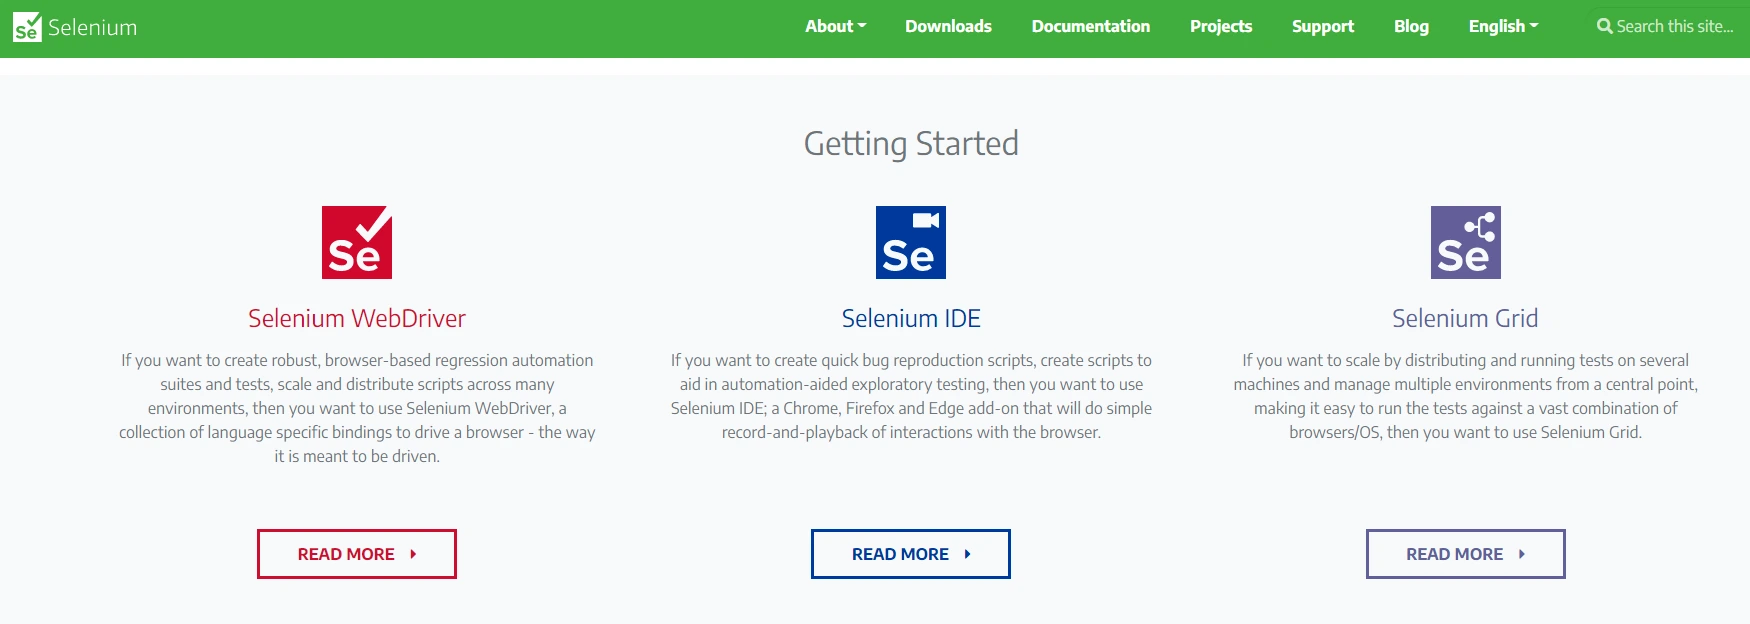
Selenium is an open-source tool for automating web apps for testing. But you can do more with it. Using Selenium WebDriver, for instance, you can automate regression tests and suites using browser-based regression tests that are scalable and distributed across multiple environments.
Selenium Grid provides a central point from which you can distribute and run tests at scale (several machines, various OS/browsers, and many environments). Selenium IDE is the Firefox, Chrome, and Edge add-on that will let you do simple recording and playback of interactions with the browsers.
Selenium alternatives include Ranorex and Test.ai.
Alarm aggregation and incident management
There are several enterprise-grade tools available that can aggregate and cross-analyze data. Even though BigPanda can aggregate data from multiple sources, PageDuty is a suitable solution for DevOps teams who need on-call management, incident response, event management, and operational analytics.
23. PagerDuty
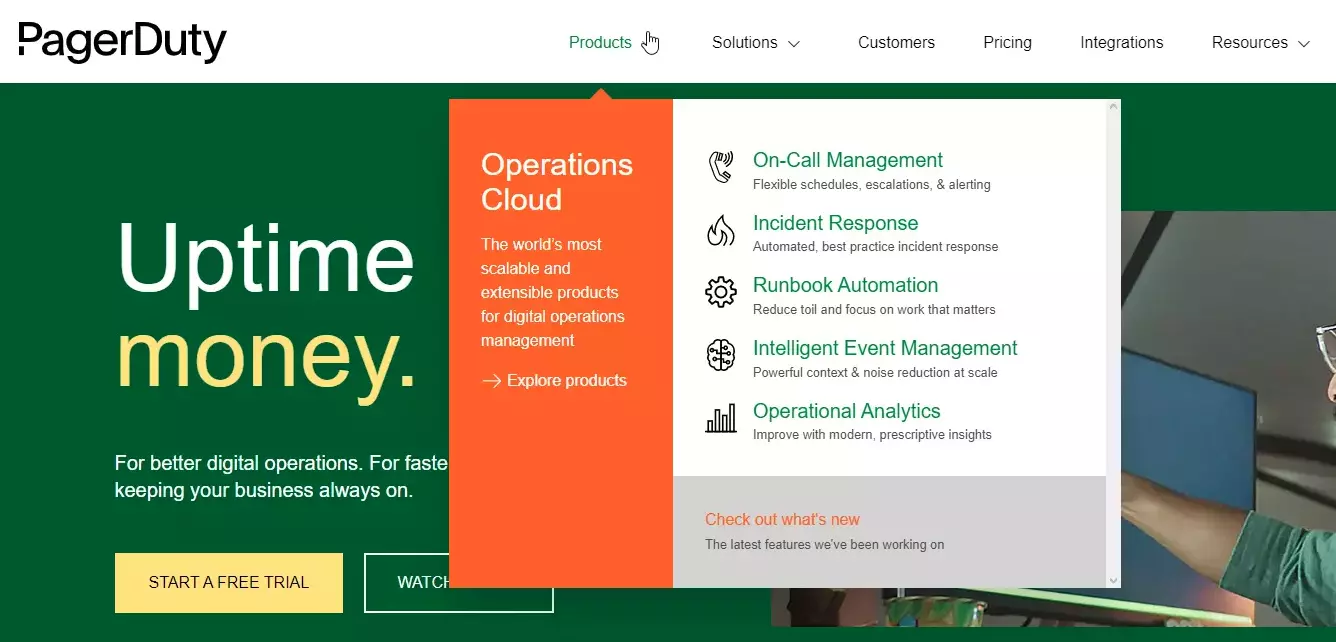
PageDuty is a dispatching service that also aggregates alarms without creating alert noise. By offering an easy-to-use GUI and well-organized data, it helps show correlations between events.
It integrates monitoring systems, customer support, API management, and performance management. Since it supports over 550 integrations, you can connect nearly any monitoring tool or log management tool as long as they can start REST calls or send emails.
The integrations include AppDynamics, Microsoft Teams, AWS, ServiceNow, and Slack, which you might be already using.
Alternatives to PageDuty include Slack, AlertOps, Splunk On-Call, and ServiceNow IT Service Management.
Continuous cloud cost optimization for DevOps
While some cost optimization tools offer traditional cost reporting, more advanced cloud cost intelligence platforms provide rich insights into the context of your business — like CloudZero.
24. CloudZero
CloudZero is different from most cloud cost optimization tools for several reasons. First, it acts more like an observability platform than a mere cost tool with its robust cost data normalization for IaaS, PaaS, and SaaS.
CloudZero also doesn’t rely on perfect tags like most tools do. Instead, it intelligently combines your tagged, untagged, and untaggable cost data and transforms it into immediately actionable cost intelligence (unit cost). This includes granular cost insights such as Cost per Customer, per Feature, per Team, per Project, per Environment, per Service, and more.
CloudZero is the only multi-cloud cost optimization platform that offers per-unit cost views across all areas — reported hourly (not once daily or every couple of hours like most cost tools).
In addition, CloudZero empowers you to:
- Use Engineering-Led Optimization; provide your engineers with insights such as Cost per Deployment, per Service, and per Environment, so they can see how their technical activities impact your bottom line, helping them build cost-effective solutions.
- Allocate 100% of your cloud spend no matter how complex your environment is.
- Take advantage of real-time cost allocation to gain cost intelligence as soon as possible to prevent budget overruns.
- Leverage real-time cost anomaly detection to get timely, noise-free, and context-rich alerts so you can fix issues before they lead to overspending.
- Use industry-leading Kubernetes cost analysis to understand, control, and optimize both your containerized and non-containerized costs in a single place.
- Set custom budgets, automatically track them (with threshold-based alerts), and gain accurate forecasting data to inform your cloud strategy.
- Get a complete picture of your cloud costs in a single source of truth; CloudZero works across AWS, Azure, GCP, and Oracle Cloud as well as Snowlfkae, Kubernetes, Databricks, MongoDB, New Relic, Datadog, and more.
CloudZero has helped ambitious companies such as Drift, and NinjaCat to save over $3 million, 36%, and 40% of their annual cloud costs in record time. Others like MalwareBytes, Remitly, and Obsidian now spend 6-10 fewer hours managing their cloud costs with CloudZero. You can, too.
 to experience CloudZero in action firsthand.
DevOps Monitoring Best Practices
DevOps monitoring best practices ensure efficient tracking and management of your infrastructure. These include:
Set clear objectives
Setting clear objectives helps determine which metrics to monitor and which tools to use. Objectives may involve improving system efficiency, minimizing downtime, and optimizing resource use.
Automation
DevOps is fundamentally based on automation. Automate as many monitoring tasks as you can. Automation decreases the likelihood of human error. It also ensures consistency and allows your team to focus on more strategic tasks.
Implement continuous monitoring
Continuous monitoring tools in DevOps track your systems and applications around the clock, collecting metrics, logs, and alerts in real time. This approach helps teams identify and resolve issues before they impact users, and it creates the feedback loops that drive agile development practices forward. The most effective continuous monitoring implementations combine automated data collection with intelligent alerting, so engineers respond to meaningful signals rather than noise.
Foster a collaborative environment
Foster teamwork among development, operations, and security departments. Sharing monitoring data with team members ensures quick resolution of issues and encourages a culture of accountability.
Employ centralized logging and monitoring
Centralize your logging and monitoring data for a unified source of truth. Centralized logging simplifies connecting data from various sources, conducting thorough analyses, and producing consolidated reports. Some of the DevOps tools used for this purpose include Elasticsearch, Logstash, and Kibana (ELK Stack).
Integrate monitoring with CI/CD pipelines
Integrate your monitoring tools into your CI/CD pipelines to enable continuous feedback. This integration assists in the early detection of problems in development and ensures that only top-notch code is released to production. Automated tests and monitoring checks can be part of the CI/CD workflow.
Prioritize security monitoring
Integrate security monitoring into your DevOps processes to detect and address vulnerabilities. Watch out for any unauthorized entry, abnormal actions, and adherence to security protocols.
Set up meaningful alerts
Set up alerts to inform your team of critical issues. Make sure that alerts provide clear direction on the necessary actions to be taken. Utilize threshold alerts for monitoring particular situations and predictive alerts for foreseeing potential problems.
Use dashboards and visualizations
Use dashboards and visual aids to display monitoring information in an easy-to-understand format. Dashboards give quick views of system health, performance patterns, and abnormalities. With customizable dashboards, teams can concentrate on the metrics that are most pertinent to their positions.
Focus on user experience
Focus primarily on user experience in your monitoring efforts. Monitor user-centric metrics like response times, error rates, and service availability. Utilize Real User Monitoring (RUM) and synthetic monitoring tools to obtain user engagement and satisfaction
Keep track of both infrastructure and applications
Extensive monitoring should encompass both your infrastructure and applications. Monitoring infrastructure involves tracking servers, networks, and storage. Monitoring applications centers on performance, availability, and user experience. This comprehensive method ensures that every aspect of your infrastructure is considered.
Conduct regular reviews and audits
Frequently assess and audit your monitoring processes and tools. Evaluate the efficiency of your monitoring plan, adjust monitoring settings as necessary, and ensure that industry standards and best practices are followed. Consistently evaluating and improving is crucial for sustaining an efficient monitoring system.
Software and pricing information was last verified in May 2026. Features, pricing, and availability may have changed since publication. Please verify current details directly with vendors before making purchasing decisions.


