The Kubernetes platform is the standard for orchestrating containerized applications. It’s ideal for large applications running on distributed instances. However, monitoring Kubernetes infrastructure can be notoriously challenging.
This guide will cover Kubernetes monitoring and Kubernetes observability in more detail, including what metrics to track to improve visibility and control over your K8s containers, apps, microservices, etc.
In addition to covering Kubernetes monitoring best practices, we’ll also share how Kubernetes cost monitoring works — and how to break down your costs into insights you can quickly understand and act on with confidence.
What Is Kubernetes Monitoring?
Kubernetes monitoring is the process of continuously tracking, measuring, and analyzing the performance, health, and cost characteristics of containerized apps running in a Kubernetes system.
The goal of monitoring in DevOps is often to proactively ensure optimal performance and health of the containers to prevent issues from affecting customer experiences.
DevOps engineers analyze specific metrics that your Kubernetes infrastructure outputs, determining what is working and what isn’t. But that’s not all.
Report
Finance needs to prove AI’s return: CloudZero report
260 senior finance leaders (more than half CFOs) told us why the speed of seeing AI spend, not the size of it, separates who pulls ahead on AI from who gets burned.
Why Monitor Kubernetes?
Kubernetes monitoring has several other benefits, such as:
- It enables you to track changes in highly distributed and dynamic K8s environments continuously.
- It helps you assess the impact of such changes with context, so you can prevent unwanted anomalies or downtime.
- It helps visualize how all containers and other components work together.
- It allows you to identify and act on threats to your Kubernetes security and compliance requirements before they become a problem.
- It empowers you to track resource usage in Kubernetes and the associated costs so you can more accurately allocate resources.
- It helps detect the root causes of performance, security, and cost anomalies in a K8s setup so you can reduce downtime.
- It enables you to track user experiences and optimize them for your target customers.
- It facilitates business continuity by detecting issues before they occur.
- It boosts visibility into your Kubernetes networking, empowering you to assess the configuration and performance of your switches, routers, servers, virtual machines, and other components.
And increasingly, it’s about cost as well. A global study published in Sept. 2025 found that 94% of IT leaders are still struggling to optimize cloud costs. Commissioned by Crayon, the report reinforces why Kubernetes observability must include spend and not just performance, especially as AI workloads and microservices drive complexity.
So, what Kubernetes monitoring metrics should you track?
Key Kubernetes Monitoring Metrics You Should Track
Monitoring metrics help engineers analyze how K8s applications and containers perform after deployment. There are several Kubernetes monitoring metrics to keep track of, including those that indicate:
- This section includes information about the health of the Kubernetes cluster, such as its state, running containers, network input/output, and resource consumption indicators.
- Latency of API requests.
- The running and deployment of Kubernetes pods.
- Resource metrics, such as CPU, memory, and disk utilization, at both the node and pod levels.
- Control plane metrics include etcd data stores, API servers, controller life cycles, and scheduler status.
- Metrics related to cost, such as Kubernetes cost per environment, product, team, or cluster.
- Container-native and application metrics.
That said, how do you collect and analyze Kubernetes metrics?
Engineering teams evaluate different abstraction levels, like containers, pods, nodes, and Kubernetes clusters. Engineers often collect as many metrics as possible before zeroing in on select Key Performance Indicators (KPIs) that suit their unique K8s monitoring needs.
In general, Kubernetes metrics are collected in one of two ways:
1. Using DaemonSets
DaemonSets are features in Kubernetes that run copies of required pods on all nodes. This runs a monitoring agent on all desired pods to collect health and performance metrics. Many tools use this approach since DaemonSets are easy to provision.
2. Using Metrics Server
Engineers install a Metrics Server as a regular pod inside Kubernetes to collect data and events from pods and containers within a cluster. Before the deprecation, Metrics Server was Heapster. Metrics Servers are an excellent choice for large workloads because they can monitor clusters with up to 5,000 nodes.
Now, the following tools simplify monitoring Kubernetes for engineers and team leaders alike.
What Are The Best Tools For Monitoring Kubernetes?
There are both proprietary and open-source monitoring tools for Kubernetes. Many open-source options are free, but may require quite a bit of configuration to meet your needs. Proprietary solutions are paid. In exchange, proprietary solutions come near-ready-to-use, with regular updates, professional technical support, and some vendor-managed elements.
Now, different teams use different tracking tools:
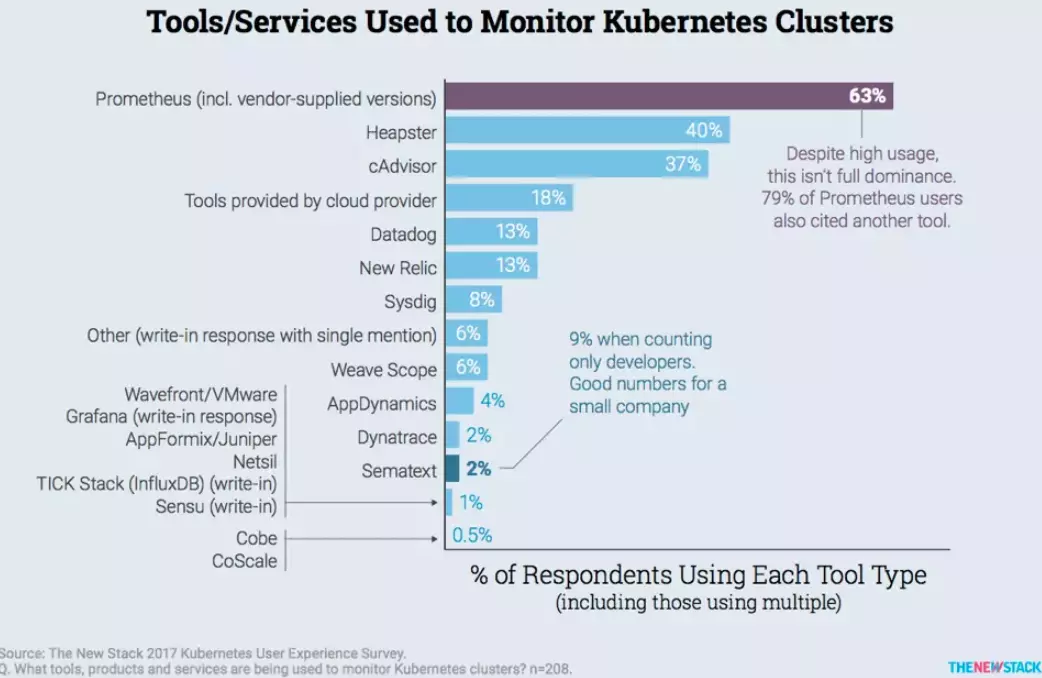
Credit: The New Stack
Others use multiple tools, suggesting they may not have found a single tool to do it all for them:
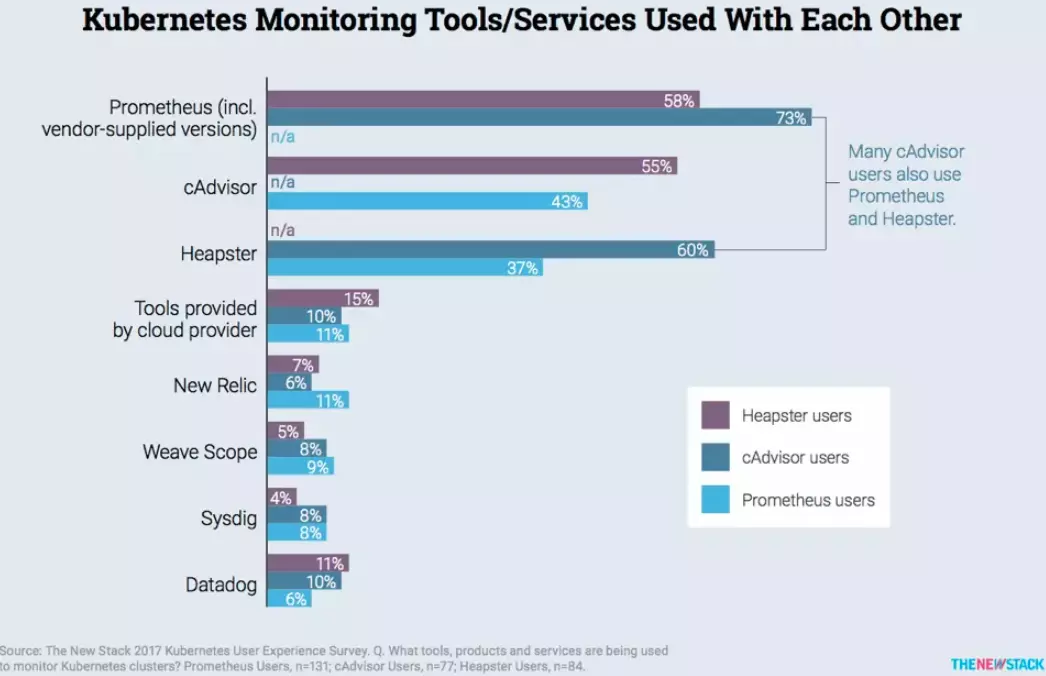
Credit: The New Stack
Either way, what are the best tools for monitoring Kubernetes clusters today?
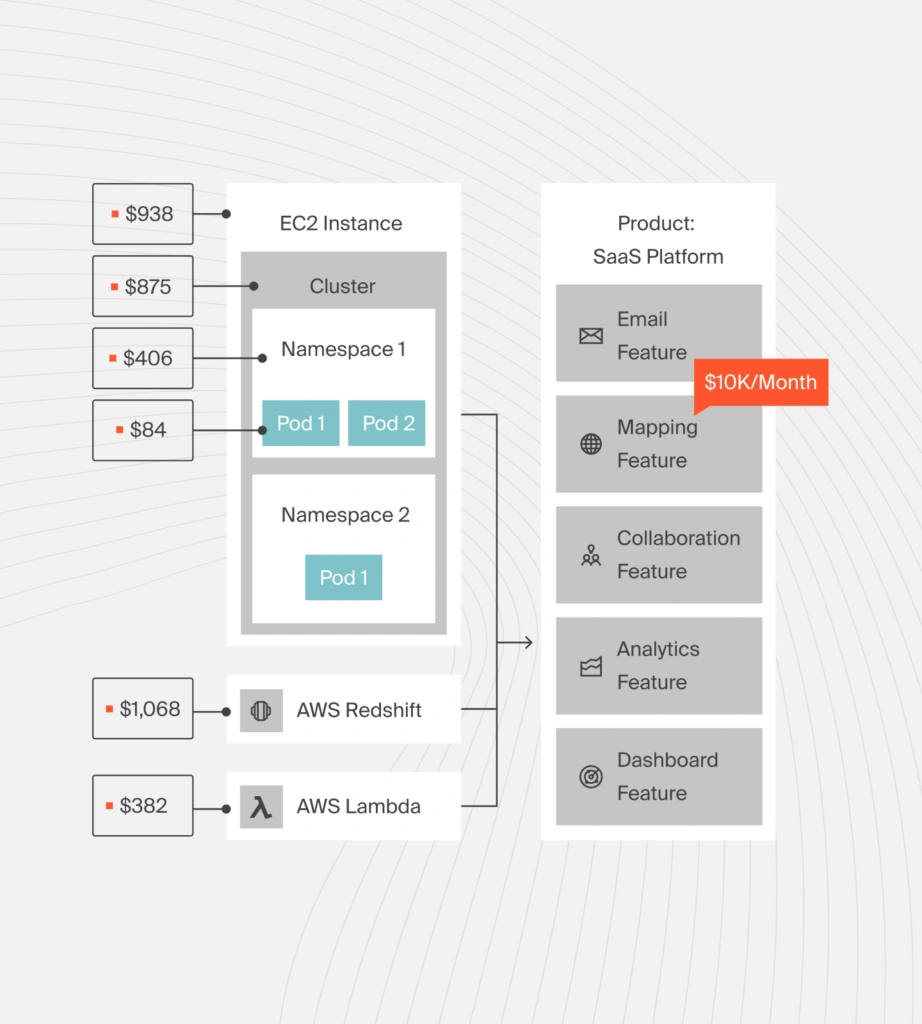
1. CloudZero – Granular Kubernetes cost intelligence
Most Kubernetes monitoring platforms struggle to present costs in a granular, easy-to-understand, actionable format. With CloudZero’s Kubernetes cost intelligence approach, you can view your costs down to the hour as cost per cluster, cost per pod, and cost per namespace.
Here’s another angle:
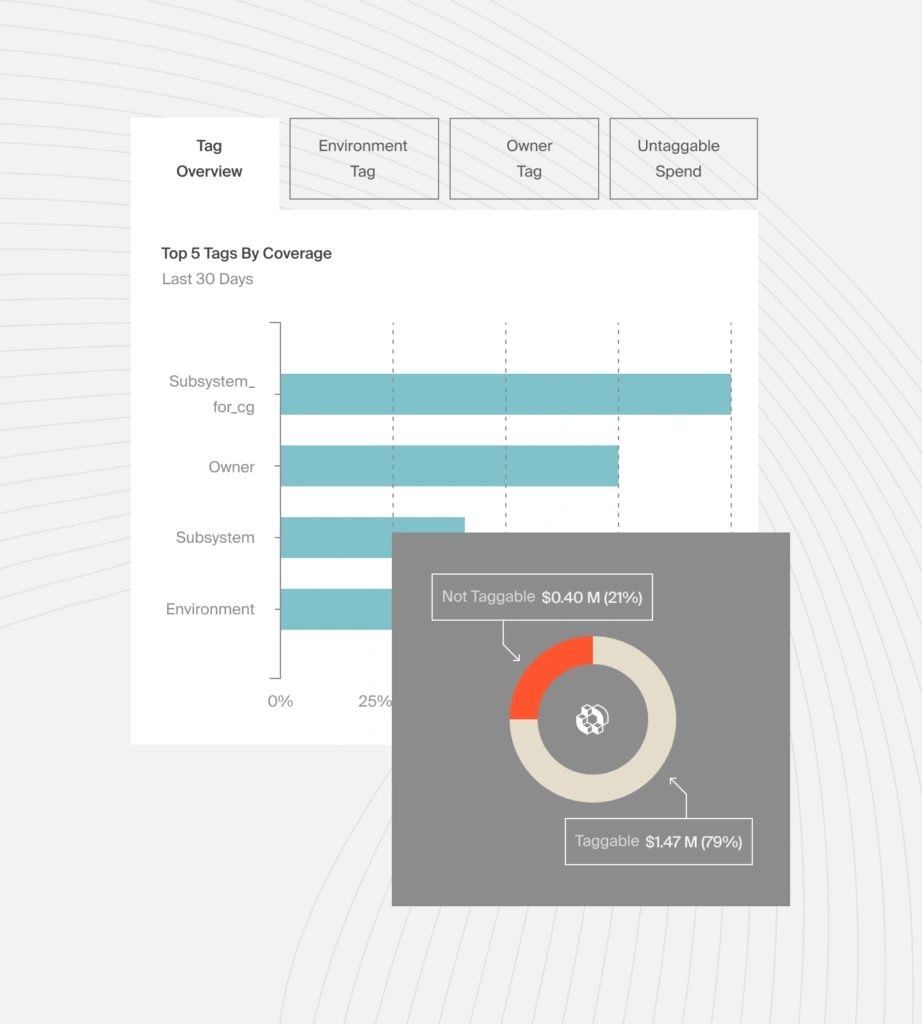
While most platforms only present total costs and averages, CloudZero goes further by providing cost context around unit costs. That includes viewing your:
- Cost per customer
- Cost per feature
- Cost per project
- Cost per team
- Cost per environment
- Cost per product
This approach makes it much easier to understand your cost of goods sold. You can not only tell precisely where your Kubernetes budget is going but also pinpoint where you could cut costs without negatively impacting performance.
CloudZero AnyCost also empowers you to combine the costs of your containerized and non-containerized costs to ease calculation. You can also track idle costs to optimize them and correlate costs together from AWS, Azure, GCP, Snowflake, New Relic, MongoDB, and Databricks.
 to see how it works.
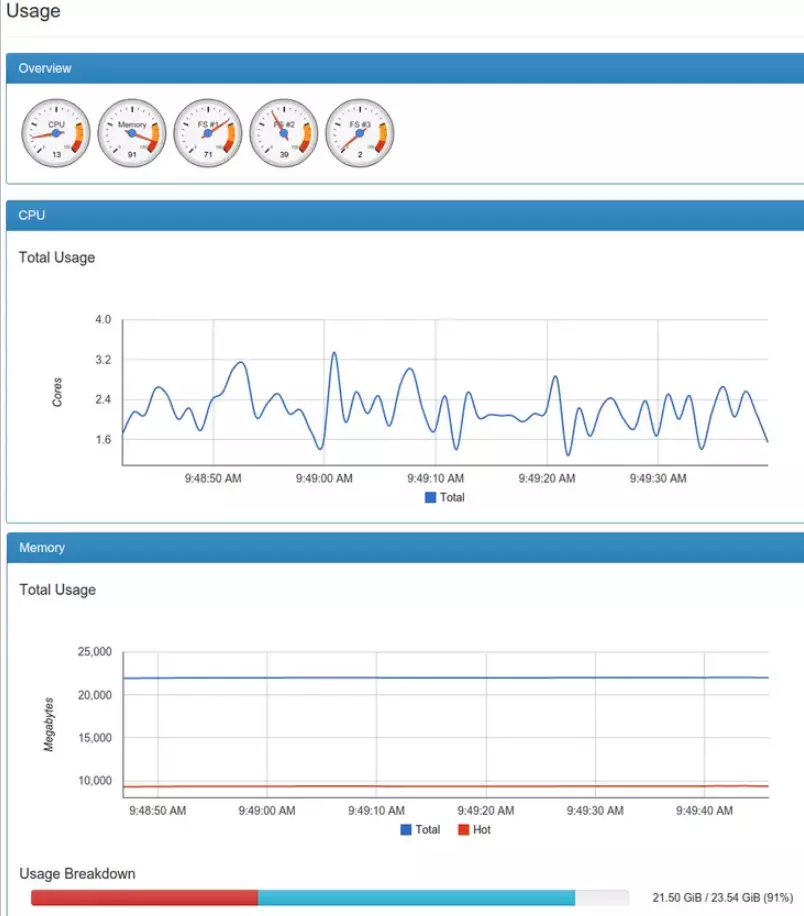
2. Kubernetes Dashboard – Native Kubernetes monitoring tool
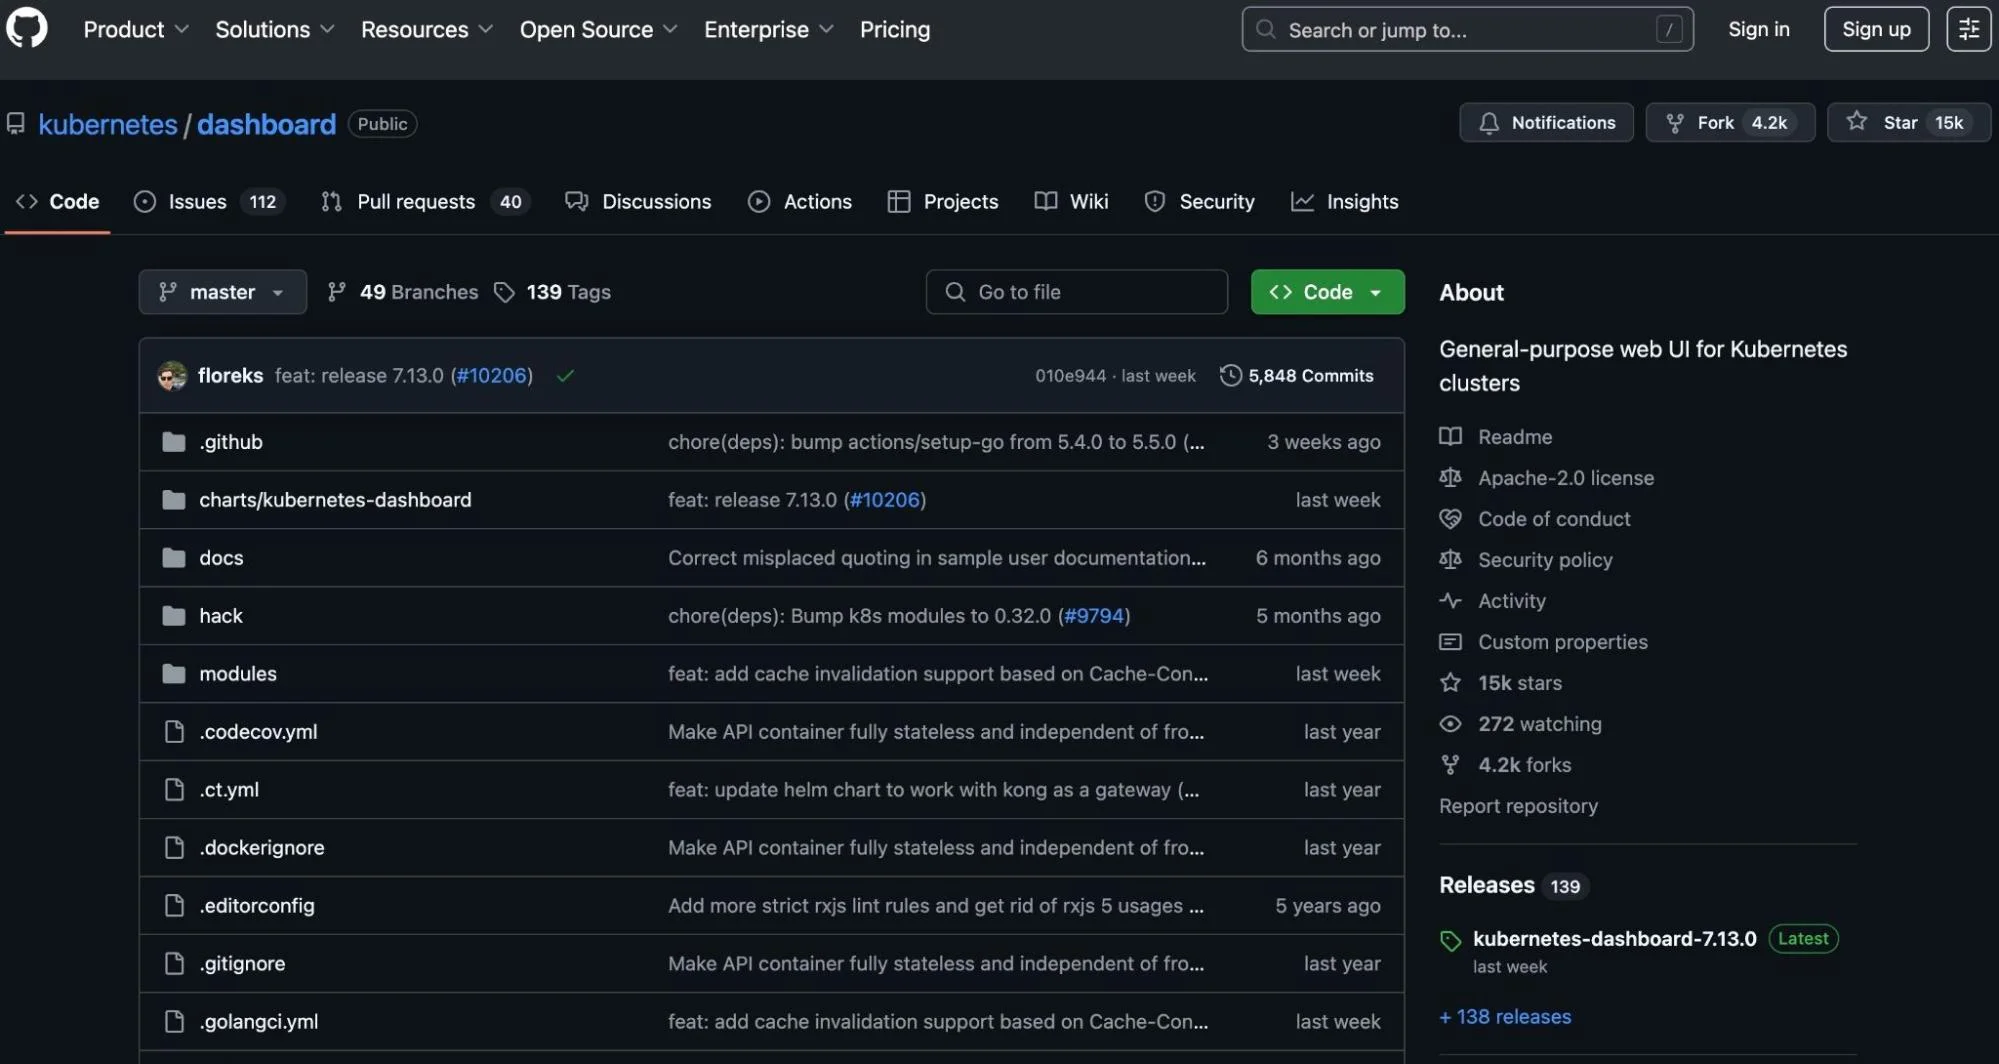
With Kubernetes Dashboard, you can monitor, manage, and troubleshoot a Kubernetes environment using a UI add-on in your web browser. It presents essential metrics like CPU and memory utilization across all nodes and workload health statistics.
Some people do not consider it a tool since it is part of the Kubernetes ecosystem (like Kube-state-metrics and Fluentd/Fluent Bit for logging). But it does the job, so we’ll include it here, especially since it’s an excellent place to start before deploying more advanced Kubernetes monitoring services, tools, or platforms.
3. Prometheus – Open-source K8s monitoring tool
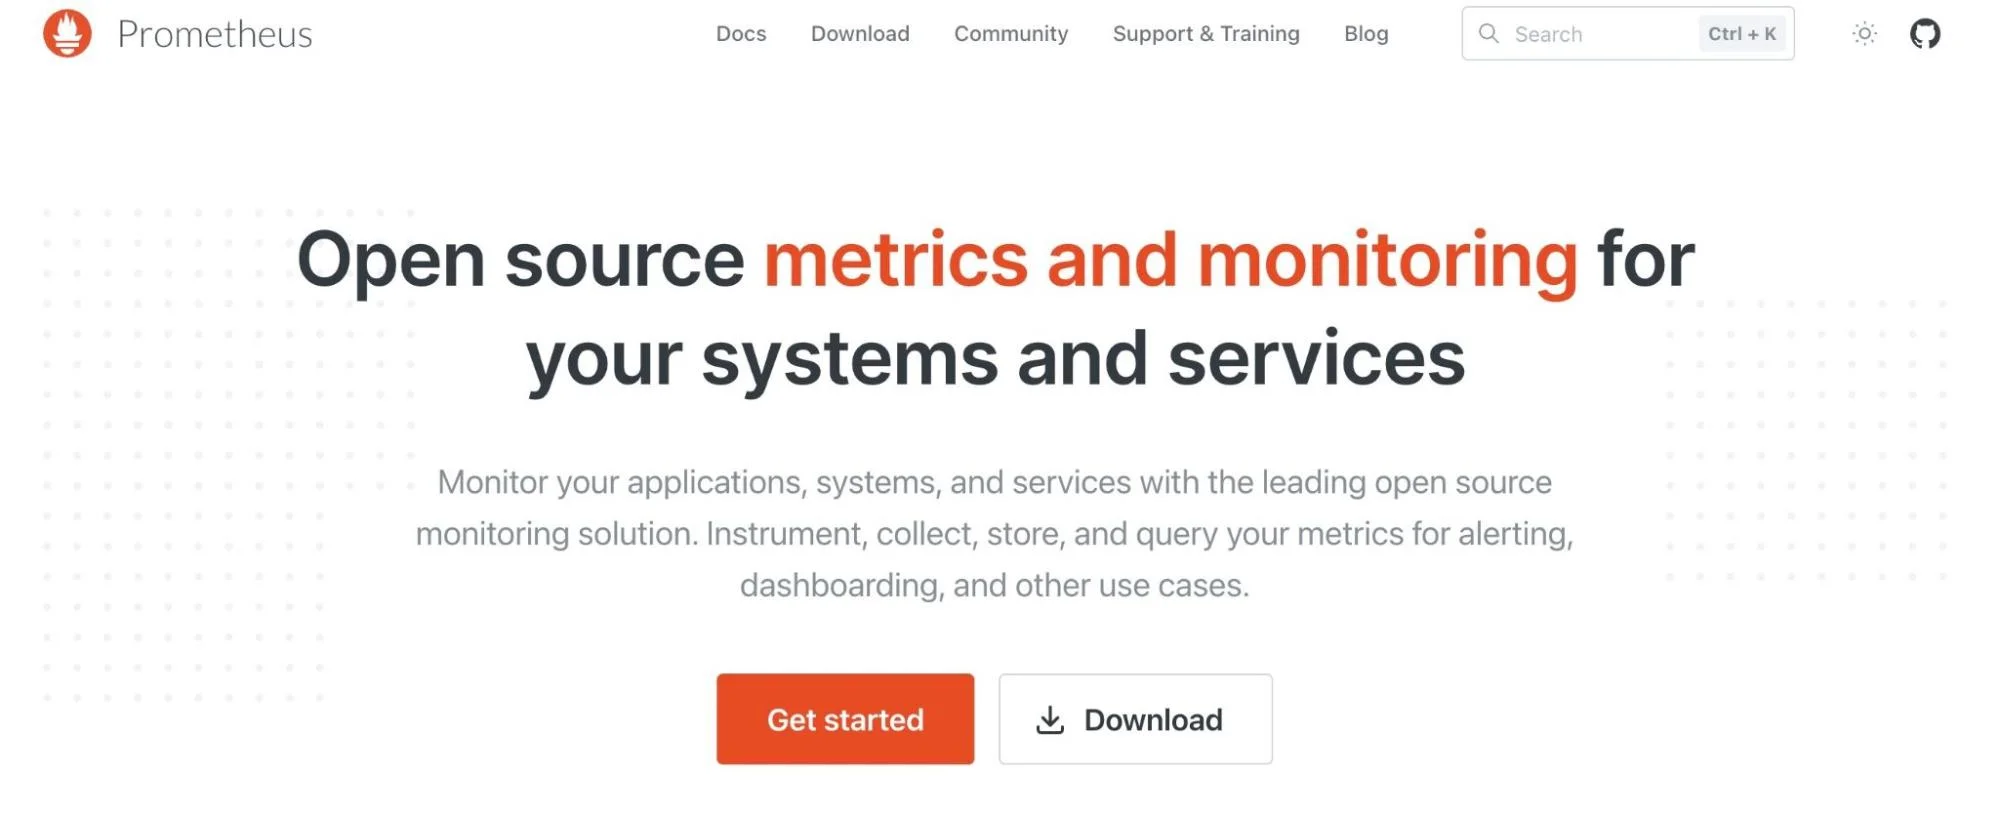
Prometheus is one of Kubernetes’s most popular open-source monitoring solutions for several reasons. Chief among those is that it combines a powerful querying language (PromQL) with a multi-dimensional data model, unlike alternative time-series databases like InfluxDB, Cassandra, and Graphite.
In addition, it uses a pull method rather than a push one, has a large developer community that helps improve the platform, and provides real-time alerting tools. You can also run the platform on top of your Kubernetes with the Prometheus Operator.
However, it does not come with a built-in visualization tool. You will need to use another tool, such as Grafana, for that.
4. New Relic – Instant, no-code K8s monitoring
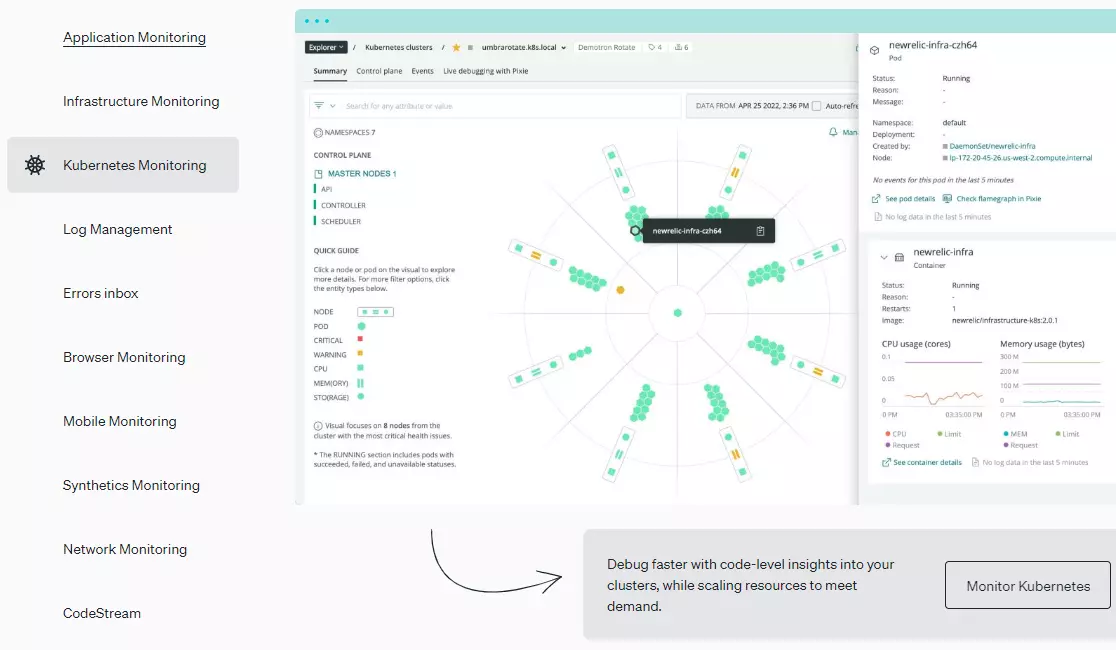
New Relic is a full-stack observability platform, so it’ll help you track myriad metrics, logs, and traces to gauge your Kubernetes infrastructure’s health, performance, and security. Its Kubernetes integration enables you to analyze services without altering source code and observe the relationship between apps, containers, nodes, and pods.
It is eBPF-based. With its 16 tools and more than 470 integrations in one platform, New Relic can be your one-stop monitoring tool for K8s — except for Kubernetes cost monitoring.
5. cAdvisor – Container resource usage and performance analysis
Container Advisor is also a native Kubernetes monitoring tool for gathering, analyzing, and reporting resource utilization, historical data, and performance statistics at the container and cluster levels.
cAdvisor automatically discovers active containers so you can monitor their metrics, such as CPU, network, and memory usage (at the node level, not per pod). For a broader look at container monitoring tools, including Docker and OpenShift options, see our dedicated guide. However, as with the Kubernetes Dashboard, it primarily focuses on collecting metrics, not event logs, traces, and events, and does not store long-term data.
6. Grafana – Open, Kubernetes visualization platform
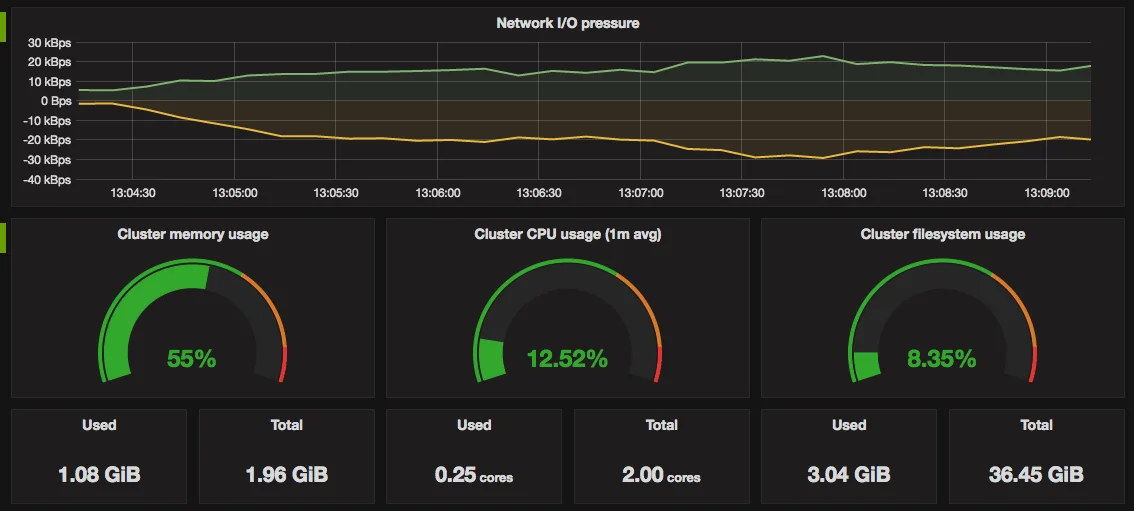
Grafana is a robust and open-source solution for querying, visualizing, monitoring, alerting, and analyzing metrics, traces, and logs. Engineers typically use it in combination with Prometheus, Grafite, or InfluxDB. That’s because Grafana offers excellent visualization and monitoring dashboards for the databases.
Many engineers use it because it offers robust alerting, can query multiple entities at once, supports Elasticsearch, and is compatible with many data sources. Grafana also allows for some log browsing.
7. Amazon EKS – Native Kubernetes provisioning, scaling, and monitoring on AWS
While Amazon EKS doesn’t monitor Kubernetes by itself, it relies on AWS-native tools and integrations to handle observability.
EKS integrates with Amazon CloudWatch to collect and visualize CPU, memory, and network usage metrics across pods, nodes, and containers.
EKS works with Amazon CloudWatch Logs, AWS OpenSearch, or third-party tools like CloudZero and Datadog for logging. You can also deploy Prometheus and Grafana inside EKS for custom dashboards and alerting.
- Learn more about how EKS works for Kubernetes management and observability.
- Not sure how AWS EKS pricing works or how to control it? This guide breaks it down.
8. Google Kubernetes Engine (GKE) – Native Kubernetes with built-in Google Cloud observability
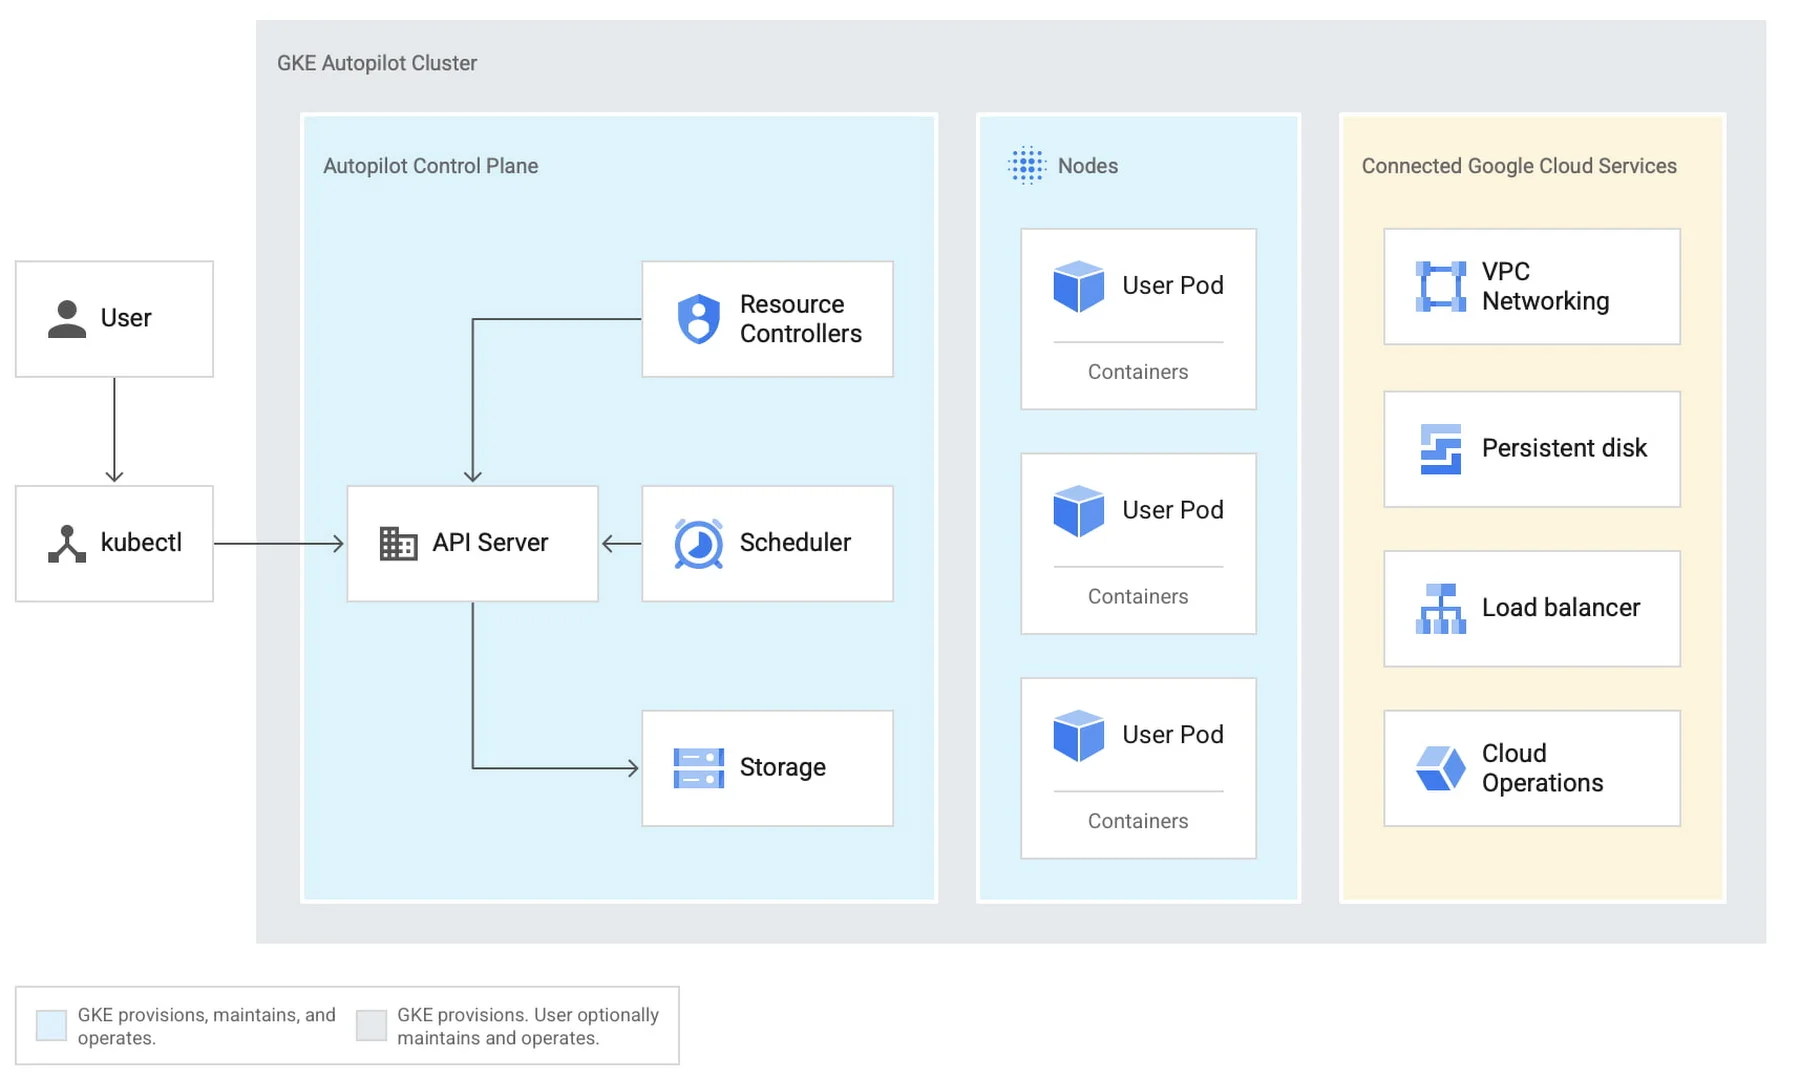
GKE monitors Kubernetes using built-in integrations with Google Cloud’s operations suite. This includes tools for metrics, logs, and tracing.
GKE automatically collects performance data, such as CPU, memory, disk, and network usage, across clusters, nodes, and pods. It displays this in Cloud Monitoring, where you can configure custom dashboards and alerts.
For logging, GKE sends logs from containers and system components to Cloud Logging, allowing you to search, analyze, and export them. It also supports Cloud Trace and Cloud Profiler for deeper application performance insights.
For customized observability, you can extend GKE monitoring with Prometheus or Grafana.
But there’s one hurdle when it comes to GKE — the cost.
Some argue it’s flexible and fair, while others say it’s hard to predict. This CloudZero GKE pricing guide breaks it down and helps you manage it cost-wise.
9. Jaeger – Distributed tracing and monitoring tool
Jaeger is a distributed tracing and monitoring tool for complex distributed systems, such as a Kubernetes environment. It also acts as a troubleshooting tool, allowing your team to perform distributed transaction monitoring and context propagation, root cause and service dependency analyses, and latency and performance optimizations.
It supports several data sources, including Cassandra, memory, Kafka, and Elasticsearch, and has been open-source since 2016.
Like Grafana and cAdvisor, you can use a DaemonSet configuration to deploy it. Or you can use the Jaeger Operator.
10. Fairwinds Insights – Kubernetes security platform
Fairwinds Insights continuously scans clusters for security risks, misconfigurations, and policy violations. It checks workloads against best practices and then provides clear, actionable fixes. The platform integrates with tools such as Slack, Jira, and Datadog so teams can receive alerts and remediation steps.
Fairwinds Insights also tracks resource usage to help rightsize workloads and cut cloud waste.
11. The ELK Stack – Open-source Kubernetes logging and observability platform
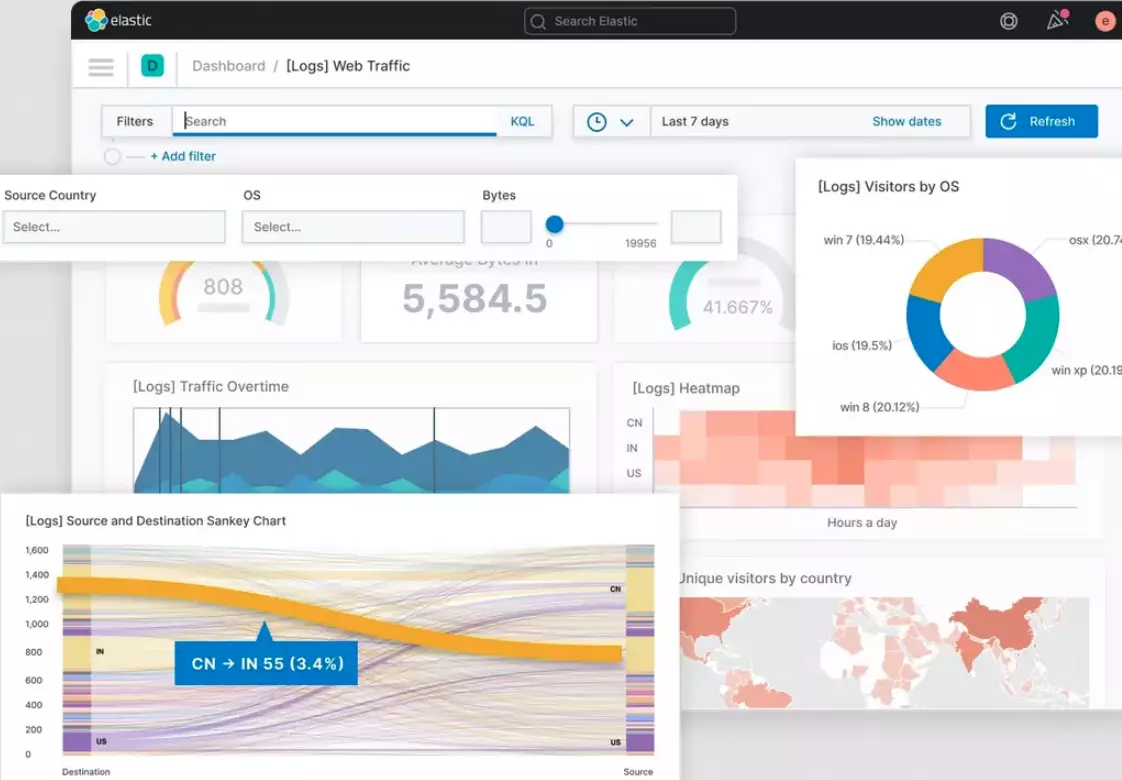
The ELK Stack is an open-source monitoring tool for logging Kubernetes. The acronym stands for Elasticsearch, Logstash, and Kibana, which form the basis of a small logging pipeline. However, the stack usually includes Beats for data collection and Kafka for buffering when dealing with massive amounts of data.
The stack combines Elasticsearch’s scalability, Logstash’s log aggregation and analysis capabilities, and Kibana’s rich analysis capabilities.
Despite being challenging to maintain at scale, the ELK Stack deploys easily and has a robust developer community to support it.
12. Rancher – Multi-cluster Kubernetes management
Rancher offers a centralized UI for managing and observing multiple clusters. It integrates with on-premise, cloud, and edge Kubernetes clusters and displays real-time data such as pod health, node status, resource usage, and events.
Rancher also integrates with Prometheus and Grafana by default. It automatically deploys them in your clusters to collect metrics and visualize dashboards. You can monitor workloads, configure alerts, and drill into issues — all from Rancher’s dashboard without switching tools. It also supports logging integrations for deeper troubleshooting.
13. Sematext – Full-Stack Kubernetes monitoring
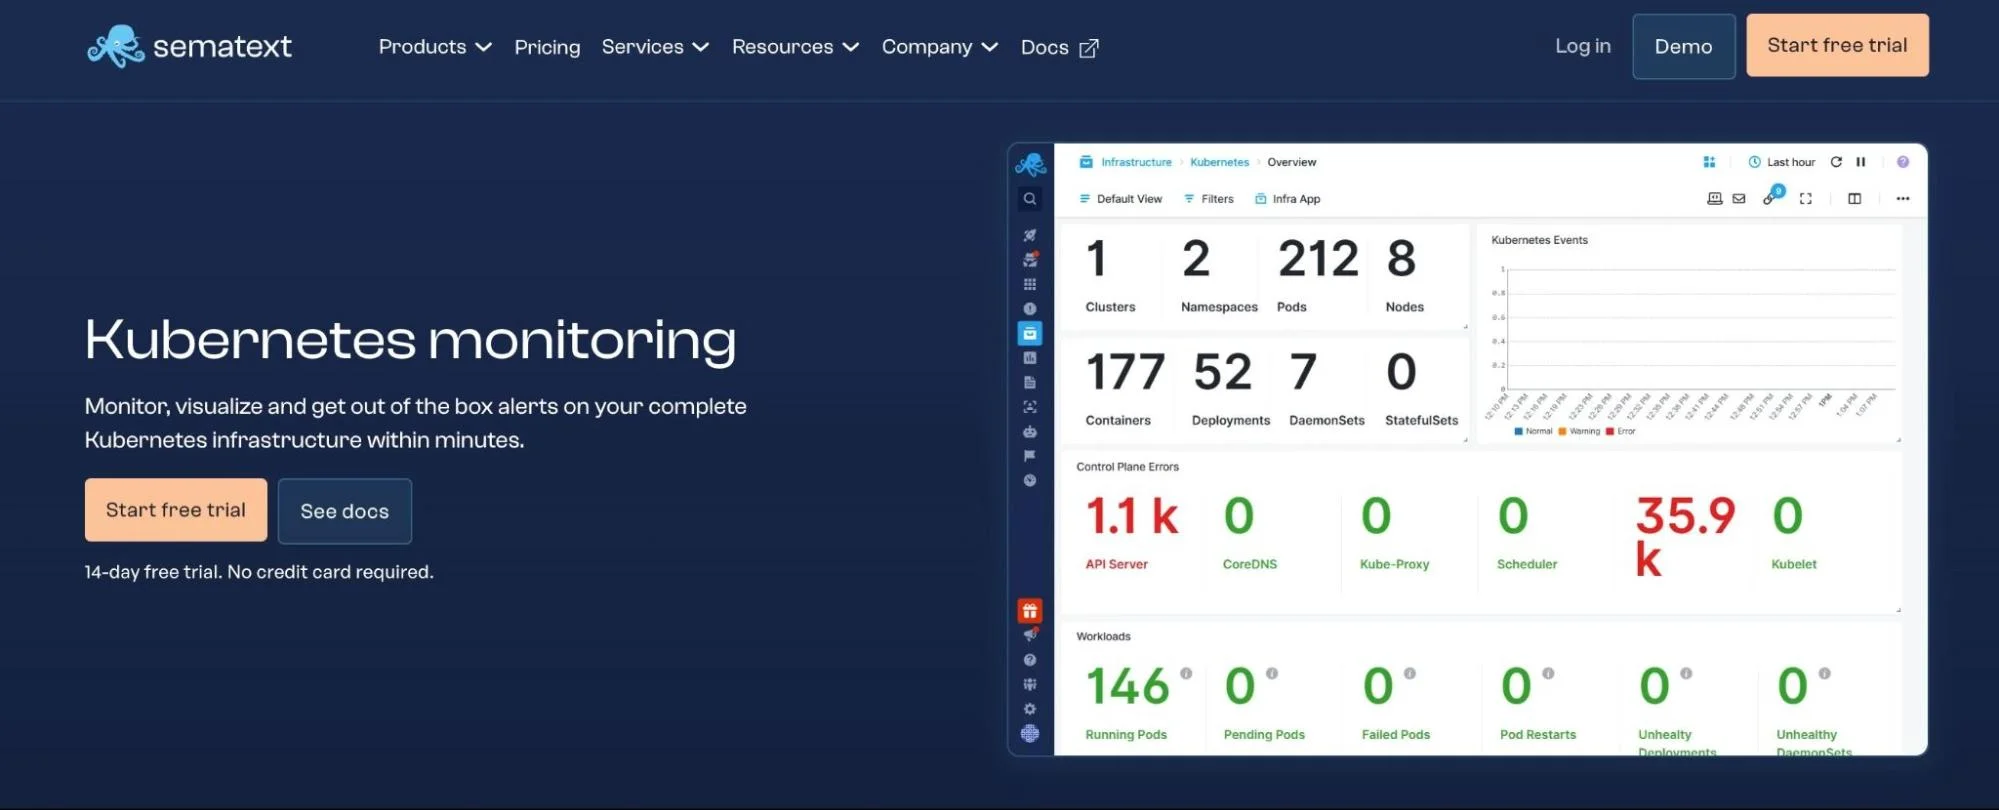
Monitoring Kubernetes with Sematext provides full-stack visibility for container orchestrators and containers, if you want a comprehensive logging and monitoring solution. Yet, it is also compatible with traditional systems.
You can collect all events, logs, and metrics running in a Kubernetes cluster, structure them, and visualize them in custom monitoring dashboards — all in real time.
With Sematext, you can also detect real-time anomalies and receive alerts regarding pod-level issues. Besides monitoring resource usage, it also captures network throughput. In addition, it is also easy to install as a Sematext Operator, DaemonSet, Helm chart, or Kubernetes Operator.
14. Komodor – Kubernetes change intelligence and incident response
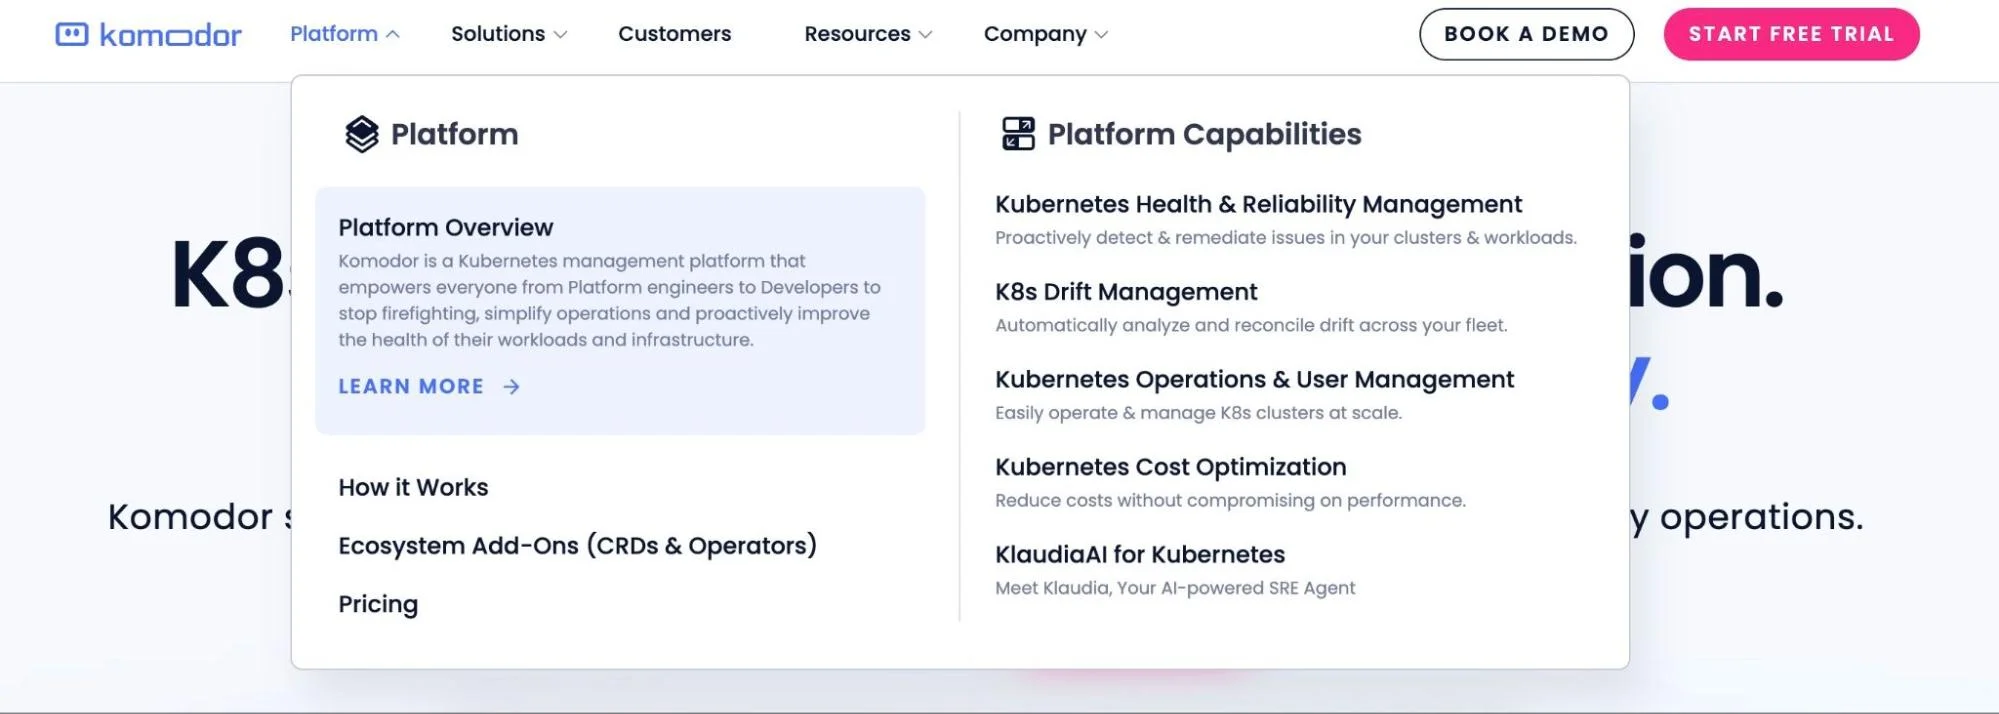
Komodor monitors Kubernetes by tracking every change across your cluster — deployments, config updates, and service modifications — and organizing them in a clear timeline. It helps you understand what changed, when, and how it might have triggered an issue. You get a real-time view of your services, with health status and historical context for every event.
It also integrates with tools like Prometheus, Datadog, and Git to correlate alerts with recent changes. Komodor offers automated root cause detection and built-in playbooks for common Kubernetes issues like CrashLoopBackOff. This enables teams to troubleshoot faster, without switching between tools.
15. Datadog – Full-stack Kubernetes observability

If you do not want to monitor infrastructure or run any storage yourself, Datadog can help. Datadog allows your team to aggregate service states, metrics, and events within your Kubernetes environment in real time. With it, you can monitor entire clusters down to a single host.
Datadog lets you see inside apps or stacks, anywhere, at any scale. It offers comprehensive DevOps services, including network, security, and real-time monitoring. It also provides log management, including filters, search functions, and a logs analysis tool for troubleshooting needs.
To increase visibility, the tool offers full API access across all apps and infrastructure. In addition, it can be run on every cluster node using a DaemonSet.
16. LoftLabs – Multi-tenant Kubernetes platform management
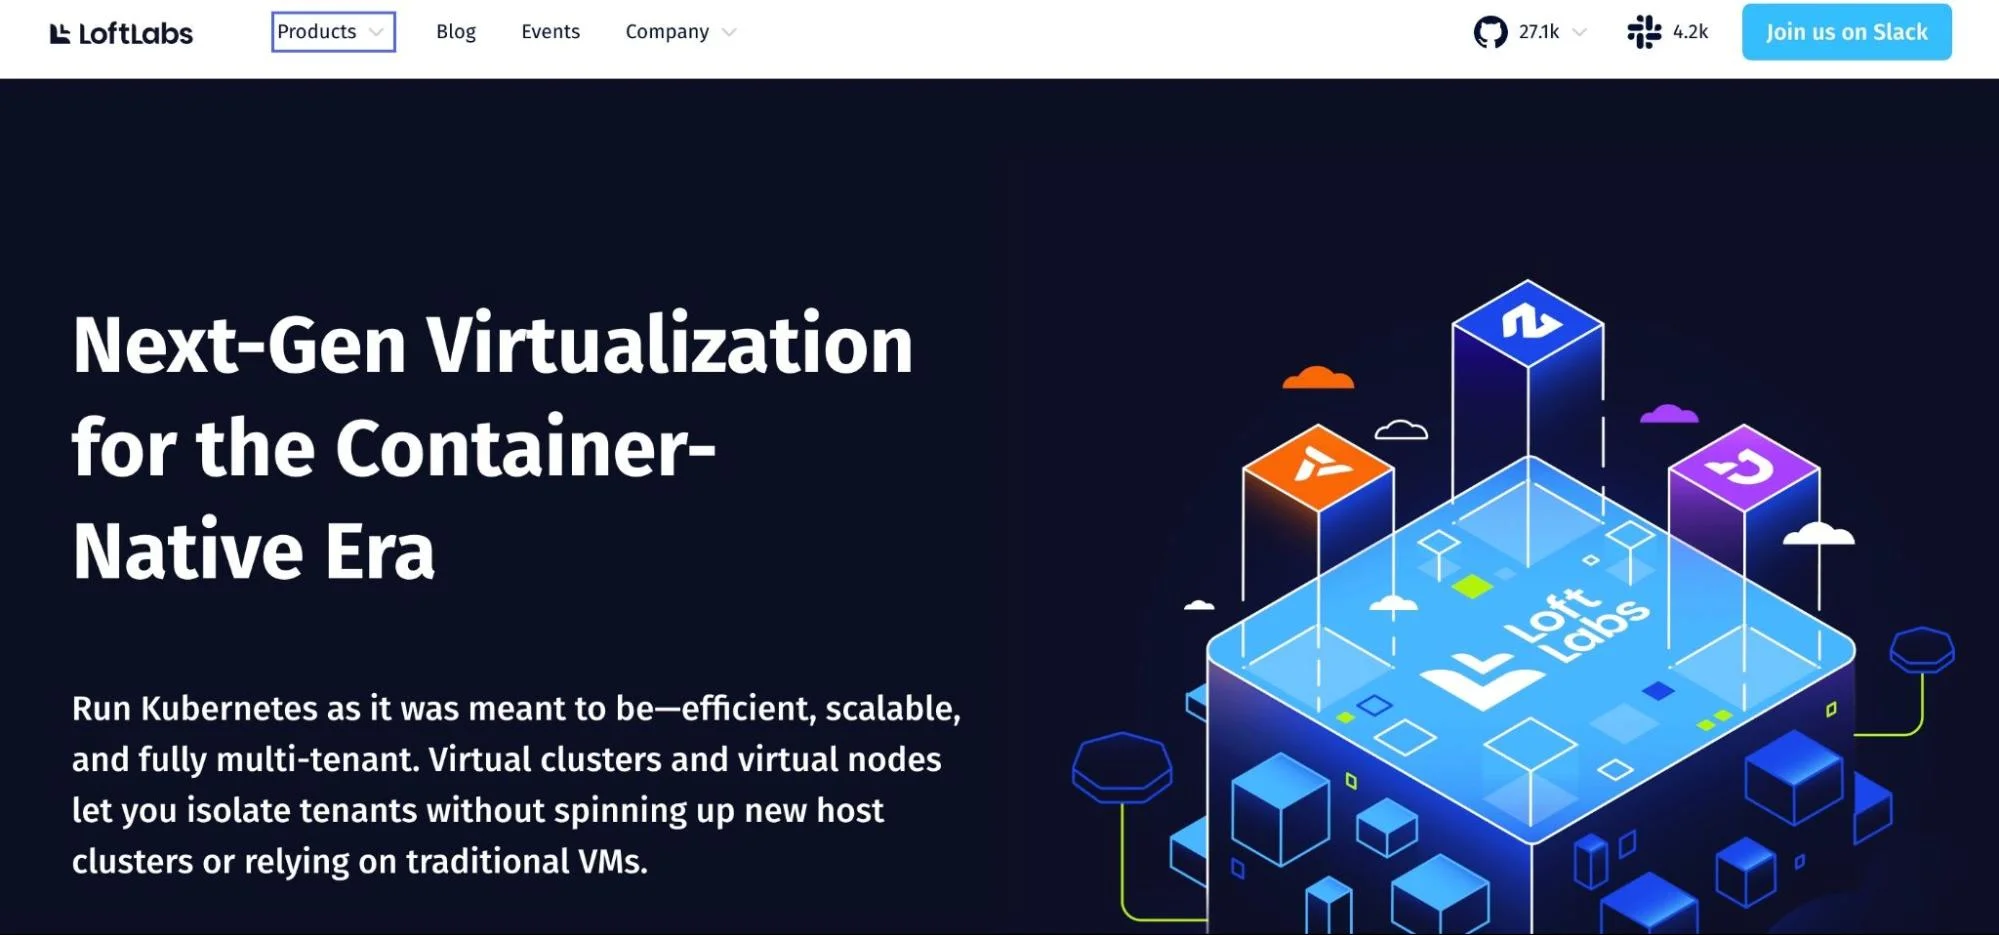
LoftLabs monitors Kubernetes by using vClusters — virtual Kubernetes clusters that run inside a single host cluster. Each vCluster is isolated, giving teams secure environments to run apps without spinning up new infrastructure. Because they act like real clusters, teams can use standard Kubernetes monitoring tools (such as kubectl, Prometheus, or Grafana) inside each vCluster to track metrics, logs, and events just as they would in a regular cluster.
Loft integrates with Prometheus and Grafana to help visualize usage and performance data. It supports custom dashboards, resource limits, and usage tracking per user or team.
17. Dynatrace – K8s observability, AIOps, and security monitoring
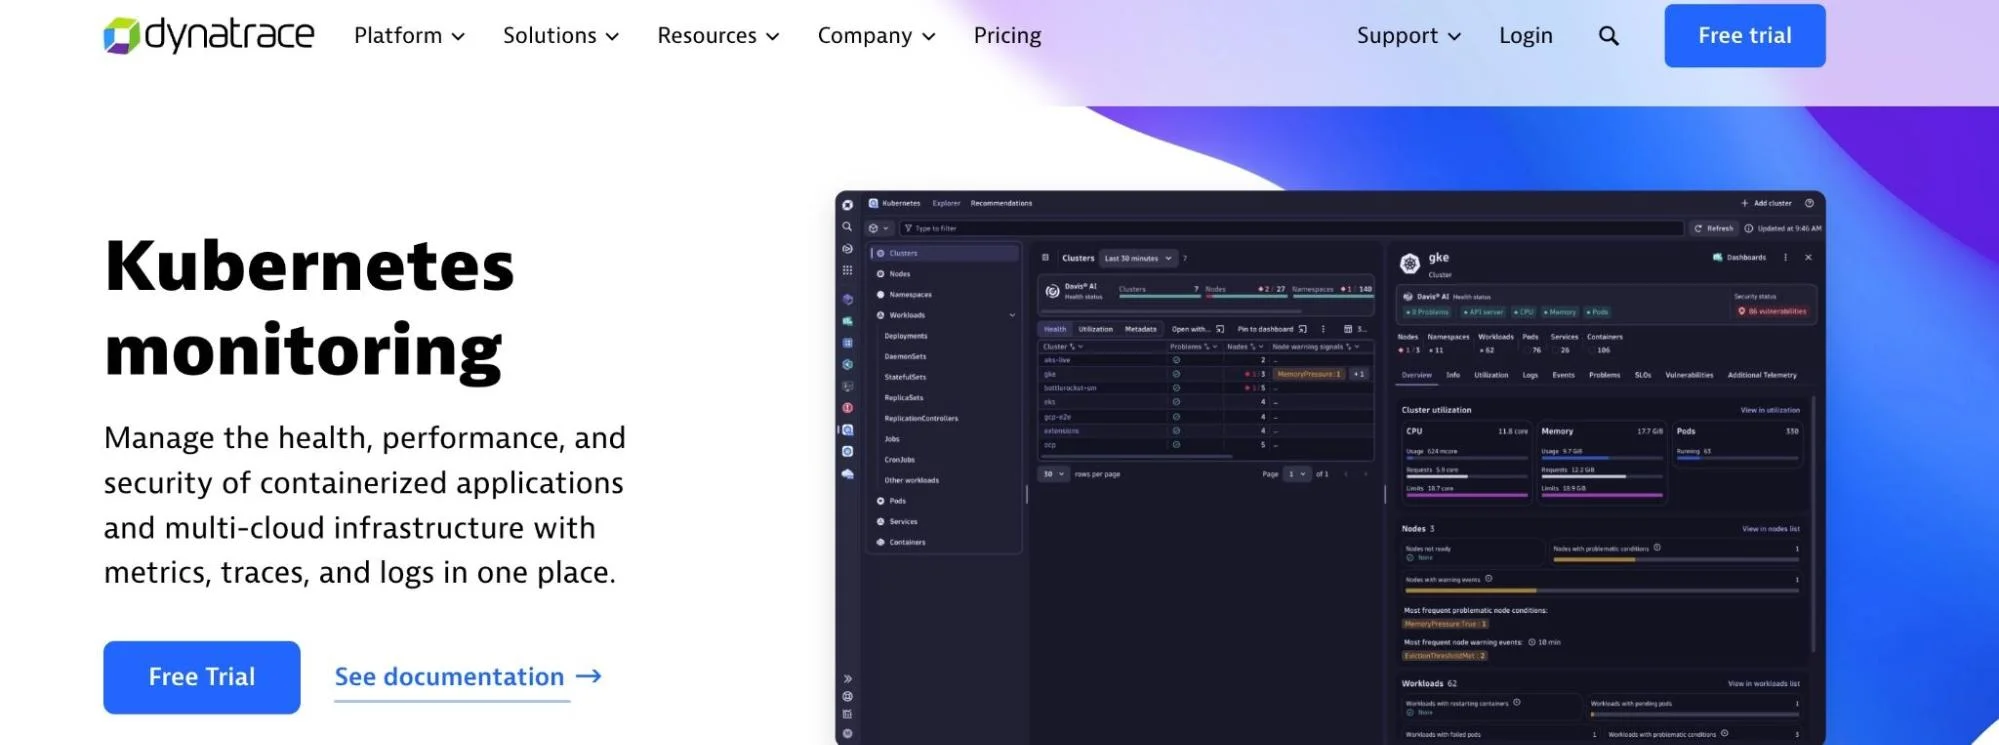
Dynatrace is also a full-stack monitoring solution for Kubernetes infrastructure. It can monitor the availability and health of applications and processes, dependencies, and connections among hosts, containers, and cloud instances.
Dynatrace enables you to unify and harness insights from over 500 different tools you probably already use, including AWS, Azure, OpenShift, Google Cloud, and Kubernetes. Even better, it uses events, traces, metrics, and behavioral information to reveal the inner workings of Kubernetes applications.
Dynatrace, like DataDog, provides superior APM integration and is best suited for complex, distributed systems. However, it also requires substantial investment.
18. Terraform – Kubernetes infrastructure provisioning and IaC management
While Terraform doesn’t monitor Kubernetes directly, it plays a key role in configuring the tools that do. Terraform uses infrastructure-as-code to provision Kubernetes resources such as clusters, pods, and services. But it doesn’t collect metrics, logs, or events itself.
Instead, you can use Terraform to deploy K8s monitoring solutions such as Prometheus, Grafana, or Datadog. This automates your observability configurations, making it easy to replicate across environments.
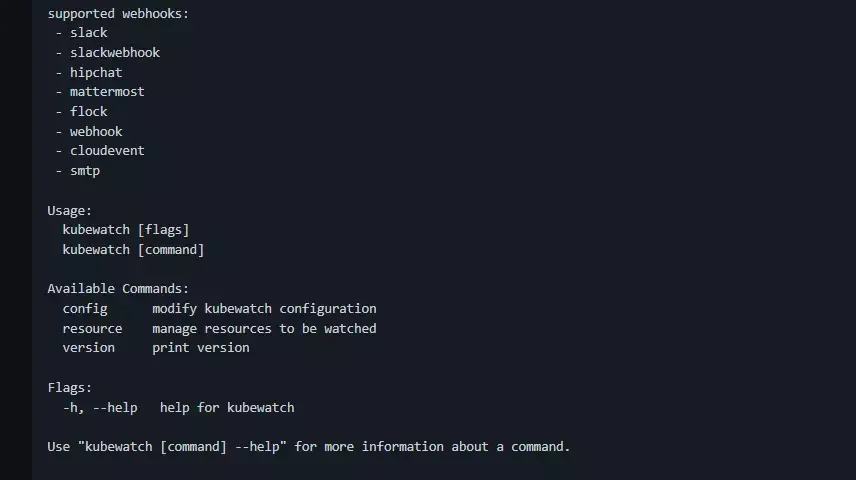
19. Kubewatch – Open-source events and trigger handlers watcher
Kubewatch is a K8s watcher that tracks specific Kubernetes events. As soon as those events/changes occur, it pushes notifications to multiple endpoints, like Slack and PagerDuty.
Some Kubernetes resources you set up to watch include pods, daemon sets, services, deployments, secrets, replica sets, replication controllers, and configuration maps. You can also simply configure and deploy Kubewatch via a Helm or a custom deployment.
Note that VMware’s Bitnami no longer maintains the project on GitHub. However, the project is actively being maintained as a Robusta fork.
Other basic K8s watchers include kube-state-metrics, kubetail, and kube-ops-view.
20. Lens – Visual Kubernetes cluster management
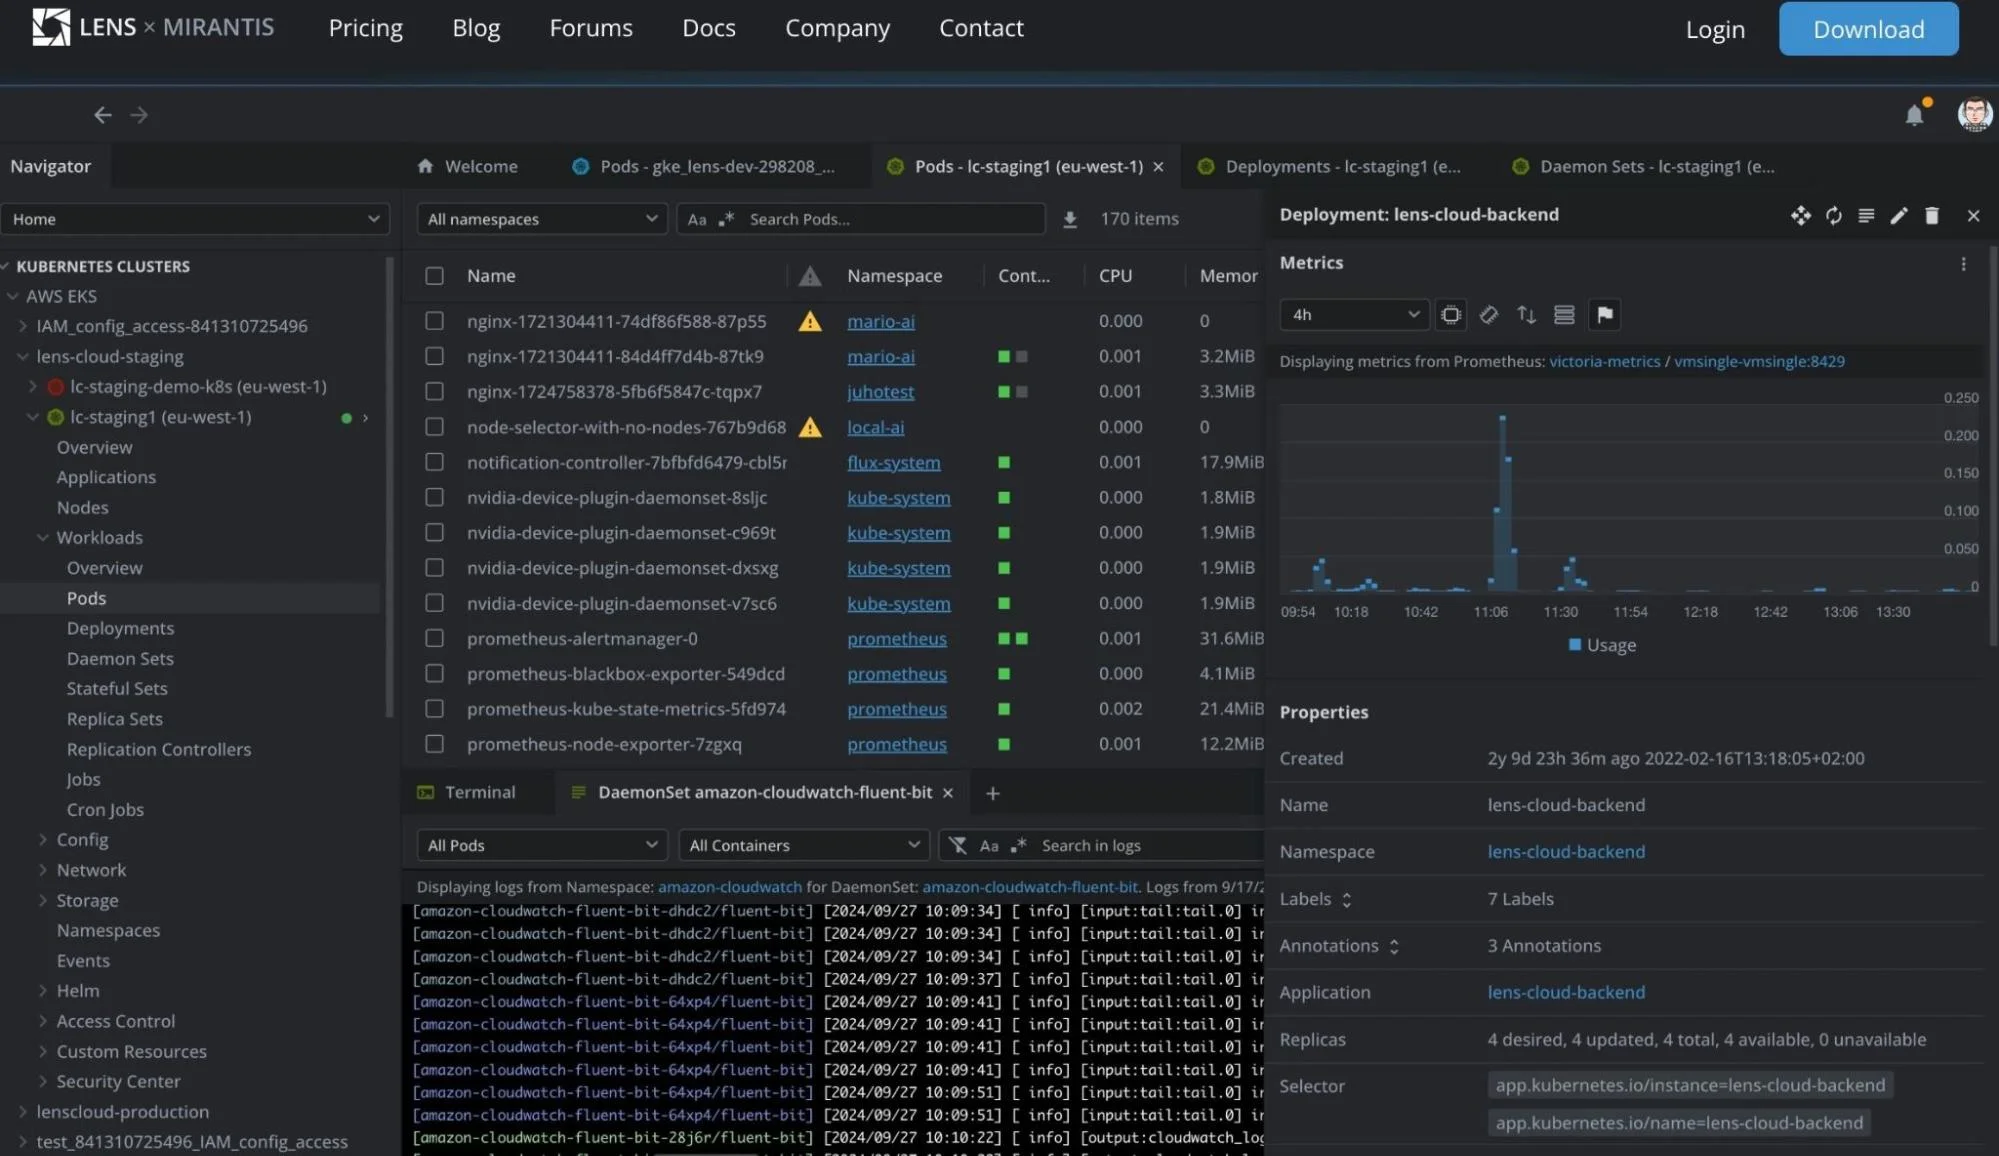
With Lens, you get a visual interface to explore your clusters in real time. It integrates with multiple clusters and instantly shows workloads, nodes, pods, services, and health metrics. With built-in Prometheus support, it tracks CPU, memory, and network usage. Streaming logs, viewing events, and running kubectl commands directly inside the app.
Lens also supports Helm charts, RBAC, and YAML editing so you can manage deployments smoothly.
21. Kubecost – Real-time Kubernetes cost monitoring and optimization
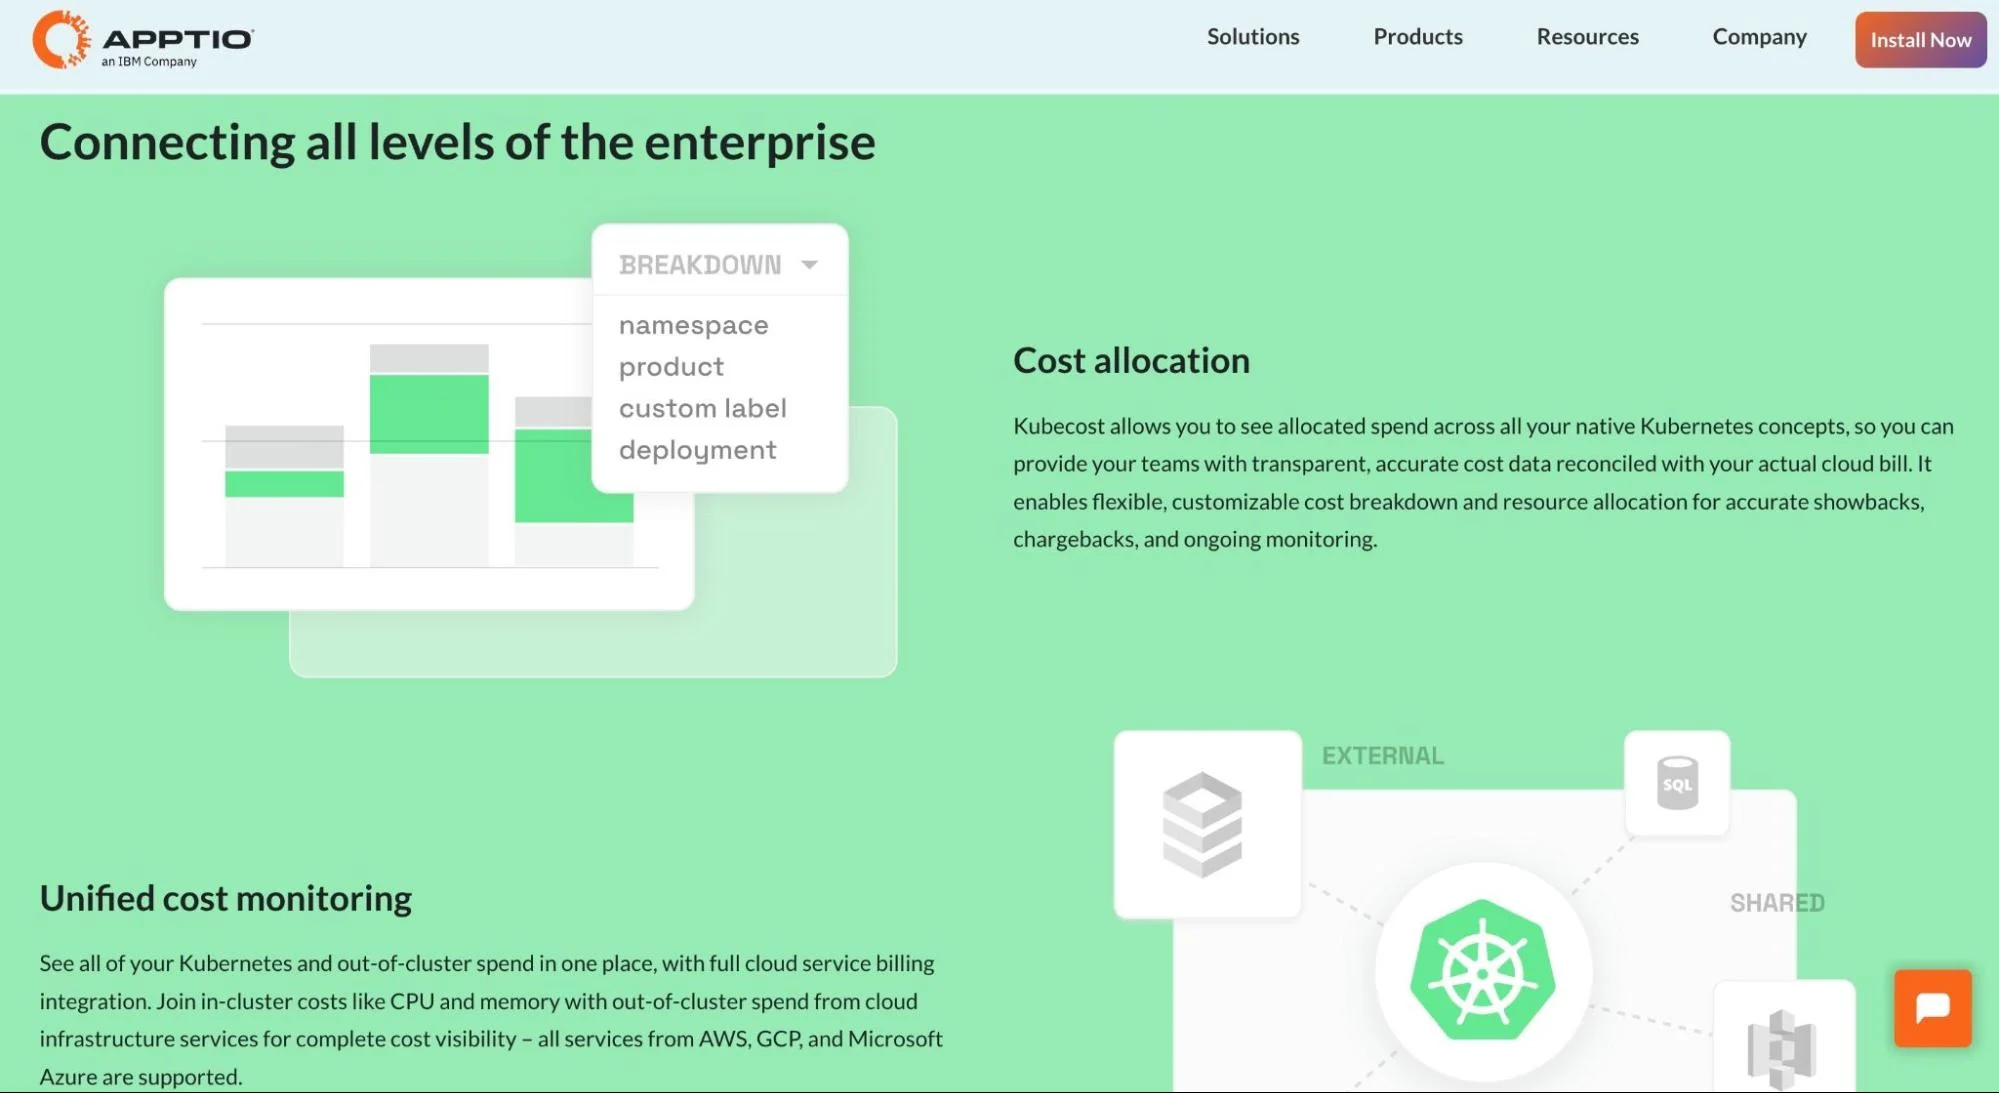
Now part of IBM, Kubecost connects to your clusters and cloud billing APIs to show exactly how much you’re spending per pod, namespace, workload, or team. This makes cost allocation clear and helps avoid overspending.
It also provides alerts, forecasts, and savings suggestions. Since joining IBM’s FinOps suite with Turbonomic and Apptio, Kubecost fits into a larger strategy for hybrid and multi-cloud cost control. It still supports the OpenCost project, staying true to its open-source roots.
22. Sumo Logic’s Sensu Go – Flexible, multi-cloud Kubernetes monitoring and automation
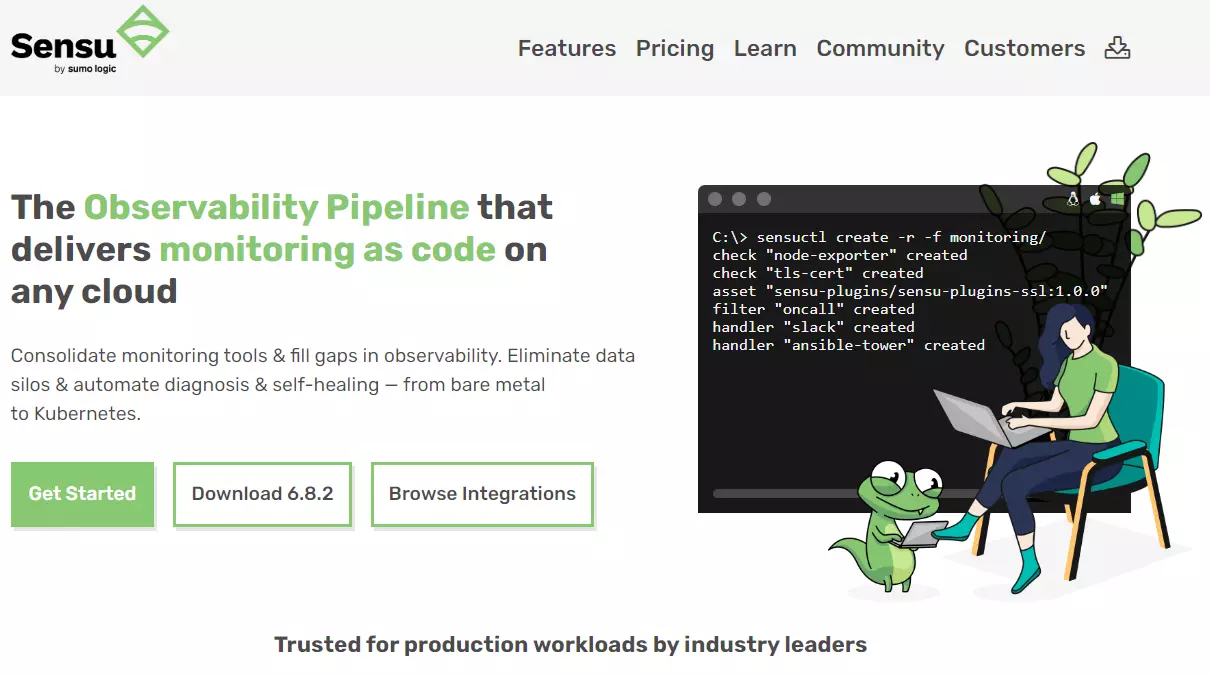
You can monitor Kubernetes with Sensu Go either on its own or as a Sensu + Prometheus combo. To collect current state data on your containers, you can use Sensu’s sidecar pattern method, run a daemonset for the Sensu agent (which runs the Sensu agent on K8s), or run a Sensu agent with the Kube host (or VM). The tool is also multi-cloud and supports real-time monitoring and autoscaling.
23. Spacelift – IaC workflow automation and Kubernetes deployment governance
Spacelift monitors Kubernetes by integrating IaC workflows directly into your cluster. Using the Spacelift Kubernetes Operator, you can apply custom resources that trigger IaC runs (such as Terraform) inside your cluster, automating infrastructure changes from within Kubernetes.
For observability, Spacelift offers a Prometheus exporter to track metrics like run status, worker usage, and billing. You can visualize this data in Grafana or send it to tools like Datadog.
24. Argo – Kubernetes GitOps and workflow visibility
Argo doesn’t monitor Kubernetes like directly. Instead, it tracks app deployments and workflows in real time.
With Argo CD, you can check if your cluster matches what’s in Git. It alerts you to errors, sync issues, or unhealthy resources.
Argo Workflows helps you follow job progress, view logs, and catch failures in batch or CI tasks.
25. Loki – Log visibility in Kubernetes environments
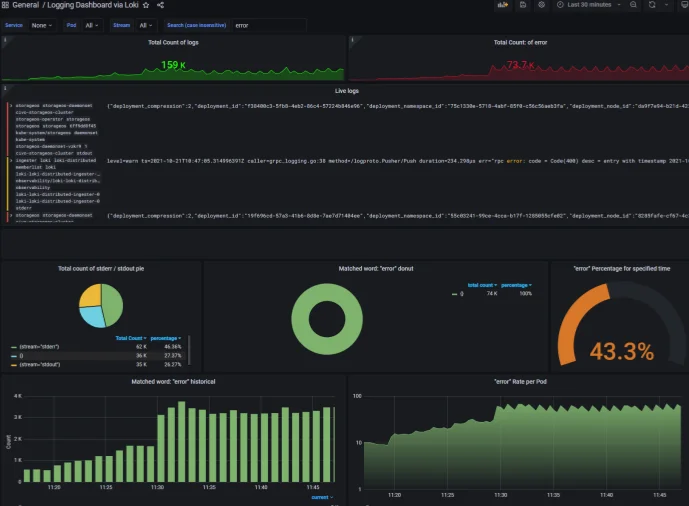
Loki is an open-source log aggregation tool built by Grafana Labs. It collects and indexes logs from Kubernetes containers simply and efficiently.
Loki uses lightweight agents like Promtail, Fluent Bit, or Grafana Agent to scrape logs from each node. Instead of parsing the log content, Loki adds labels (like pod name or namespace), keeping it fast and cheap.
While it’s not a full observability stack, Loki is perfect for log visibility in Kubernetes environments.
Kubernetes Monitoring Best Practices To Implement Right Away
These best practices will help you derive useful insights across your Kubernetes environment:
- While it is important to pick the Kubernetes monitoring telemetry you want to observe, modify your choices as your needs change.
- Ensure that all cluster components are visible by collecting kernel-level data about running processes and their relationships.
- Use a SaaS-based K8s monitoring solution instead of an on-premises solution to ease management, infrastructure development, and costs, and get regular updates.
- Use libraries and sidecar agents to instrument your system, ensuring you collect all data.
- Enhance root cause analysis by tracking and analyzing historical performance data and event logs.
- Monitor Kubernetes control plane elements, such as the API server, kube-dns, kubelet, kube-proxy, etc., and the controller manager regularly to ensure cluster services are running smoothly.
- Automate correlations between data using a robust K8s observability platform, linking metrics to events, traces to logs, and events to logs.
- Leverage anomaly detection and Kubernetes alerting to catch issues before they become problems. Configure your Kubernetes alerts to trigger only on meaningful events or changes — this minimizes alert fatigue and keeps your team focused on what matters.
- To avoid further complexity when using an open-source tool, use a managed service, such as an AWS or GCP Prometheus offering.
- Use tools that permit user permissions and role-based access controls, such as at the namespace and/or cluster levels.
- Understand who, why, and what’s driving your Kubernetes costs. How? Well, rather than collecting totals and averages, analyze your unit Kubernetes costs, such as by business unit, project, and environment.
What Next: Understand Who, Why, And What’s Driving Your Kubernetes Costs
Monitoring Kubernetes provides insight into your system’s performance, health, security, and cost. Continuously monitoring your Kubernetes containers also helps you detect inconsistencies before they become costly problems.
The solutions we’ve shared here all provide robust observability features you can use immediately. But CloudZero goes beyond basic K8s cost monitoring.
CloudZero’s Kubernetes cost intelligence empowers you to:
- View Kubernetes unit costs — see how much you spend on a specific feature, product, customer, team, business unit, and more.
- Narrow down to the hourly cost of a cluster, pod, or namespace.
- Get real-time Kubernetes cost detection and alerting.
- Keep track of your Kubernetes spending by receiving only the most relevant cost alerts via Slack, email, PagerDuty, or another incident response tool.
- Analyze the cost of containerized and non-containerized workloads in a single platform.
- Compare Kubernetes costs with those of services like AWS, GCP, Azure, Snowflake, Databricks, and New Relic.
to see how it works!