Google Cloud Platform (GCP) offers a great alternative to Amazon Web Services (AWS) and Microsoft Azure. If you use Google Products extensively at work, such as Google Workspace, moving to GCP may be a natural choice.
Perhaps you already use GCP with AWS, Azure, or another cloud provider as part of your hybrid cloud strategy. But maybe you struggle to manage GCP costs, monitor security and compliance, and observe performance.
This guide will cover how to monitor your Google Cloud — and the best GCP monitoring tools available today.
Why Use Google Cloud? (Vs. Its Competitors)
The Google Cloud Platform offers several advantages over its competitors, such as Amazon Web Services (AWS) and Microsoft’s Azure Cloud. The following are some of those advantages:
- In general, the platform is less complicated than some of its competitors
- A fast, secure, flexible, highly available, and highly scalable platform
- Superior Artificial Intelligence (AI) and Machine Learning (ML) models
- Integrates natively with the Google Workspace suite of tools
- Supports cloud-native and on-premises deployments as well as hybrid cloud and multi-cloud deployments
- Refined Kubernetes support with Google Kubernetes Engine (GKE)
- GCP’s spot instances (Preemptible Virtual Machines) last up to 24 hours, which is much longer than, say, AWS Spot Instances
- Suitable for both large enterprises and smaller companies
- Currently available in 40+ regions, over 103 zones, and more than 200 countries in all inhabited continents but Africa
Now, let’s look at how Google Cloud monitoring works and why you should monitor your GCP environment.

What Is Monitoring In The Google Cloud Platform?
GCP monitoring comprises collecting, analyzing, and acting on observability data generated by Google Cloud services, user experiences, apps, and infrastructure. It involves monitoring the health and performance of your environment, including its costs and security.
Monitoring in GCP relies on collecting metrics, events, and metadata. Using BindPlane, you can gather this data from 150 commonly used application components, on-premises environments, and hybrid cloud deployments.
GCP monitoring aims to produce user-friendly insights through dashboards, charts, reports, and alerts. Using an Agent Policy, you can automatically install and maintain the suite of GCP monitoring agents across your Compute Engine instances to collect metrics data.
Why Monitor Your Google Cloud?
The Google Cloud Monitoring service provides timely information about your GCP cloud’s health, such as availability, performance, and data security. This is possible by continuously tracking various resources in Google Cloud.
There are plenty of Google Cloud services to monitor, too:
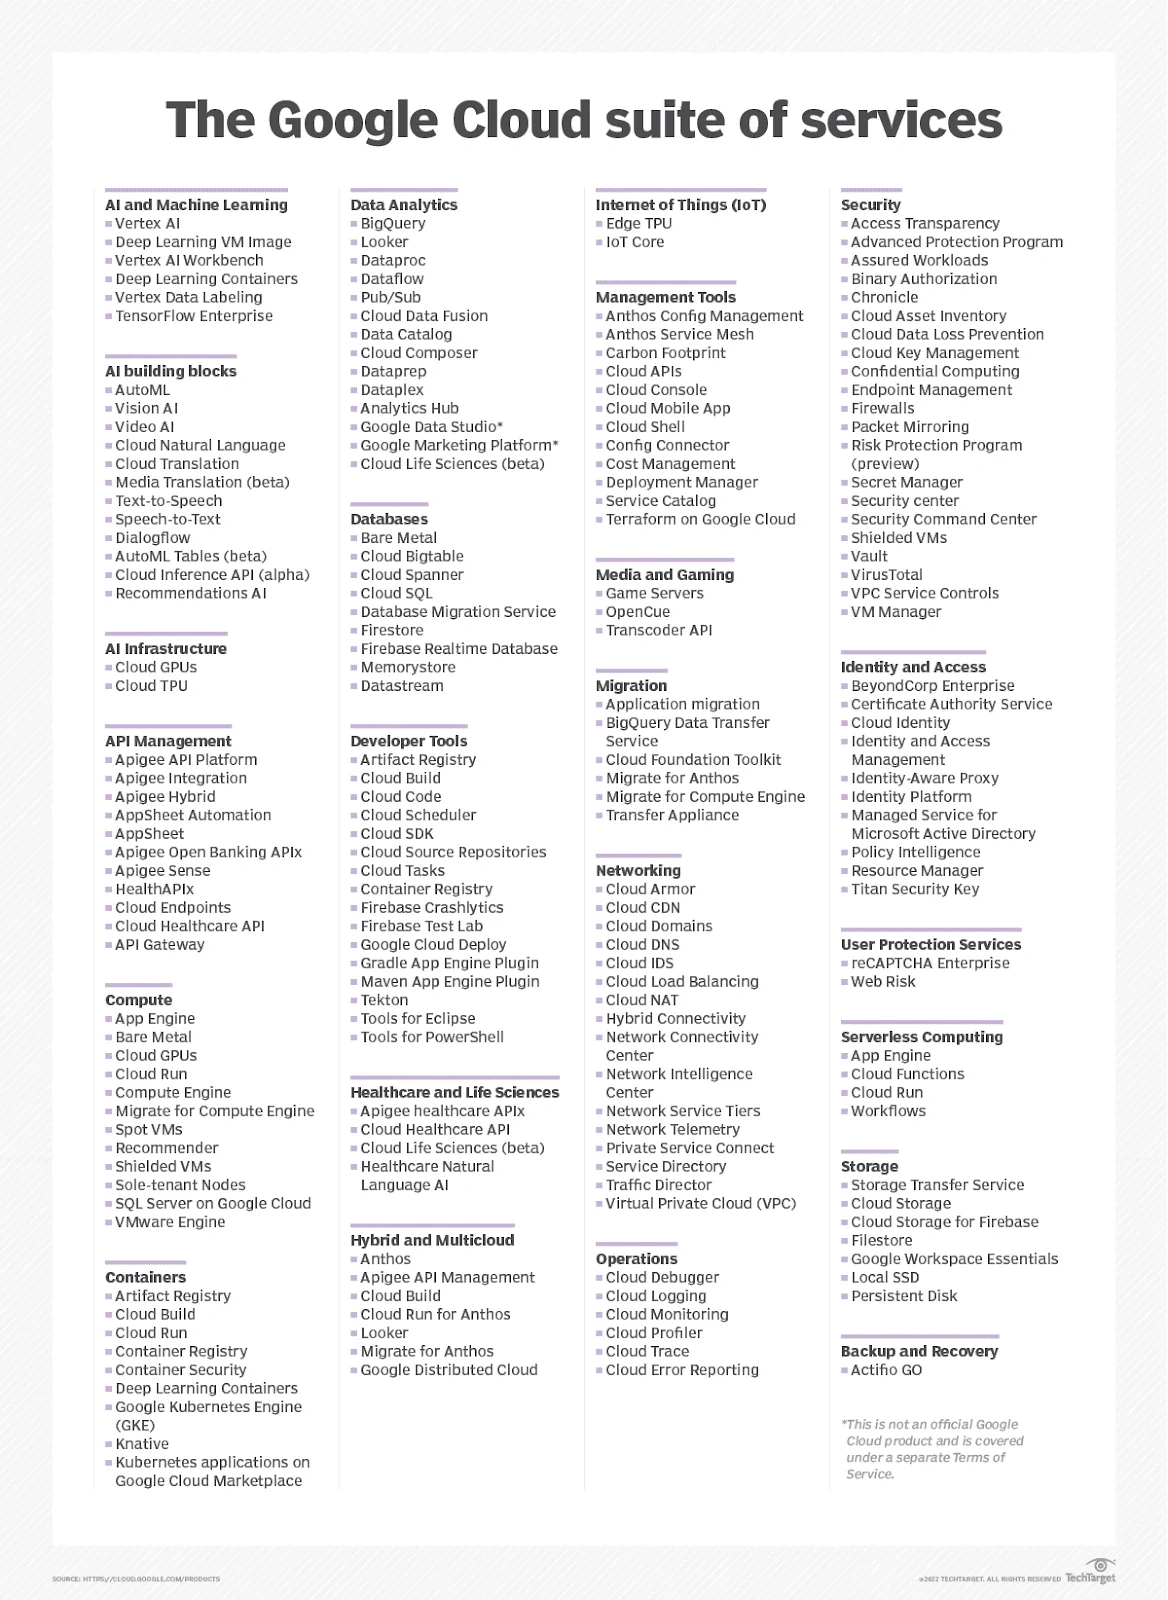
Credit: TechTarget
Your developers and cloud administrators can use this cloud visibility to identify when something isn’t working as it should in your Google Cloud environment. The monitoring process makes it easier to pinpoint the root cause of a problem, thus reducing mean time to repair (MTTR) and recovery times. This way, your team can resolve the issue before it negatively impacts your users’ experience, exposes your data, or increases cloud costs.
Take cloud costs, for example. Unless you are Snap with $2 billion, Spotify, with $450 million, or CenturyLink with $61.9 million to spend on Google Cloud services, you’ll want to track your Google Cloud spending to optimize it.
GCP recently increased prices for some core services, making it crucial to optimize your costs. Tracking your Google Cloud spend is a sure way to do that, as it allows you to tell precisely what to cut, what to keep, and what resources to increase to maximize your returns.
You can do that by applying several principles at all times. These principles make up the Google Cloud monitoring best practices listed below.
8 GCP Monitoring Best Practices To Optimize Your Google Cloud
Cloud environments can be a complex network of infrastructure, applications, and services. Here are some best practices for getting the most out of Google’s cloud services:
- Monitor GCP with a plan. To collect meaningful data, you’ll want first to define your GCP monitoring goals, the metrics you will measure, and why you plan to measure them.
- Track as much as you can as continually as possible. You do not want blindspots in your Google Cloud environment that could lead to surprise breakdowns or costs.
- Observe cloud-native, on-premise, hybrid, and multi-cloud telemetry in one platform. This eases analysis and deriving meaningful insights from the data you collect.
- Go deeper with a robust GCP monitoring tool. Native monitoring tools will get you started, but advanced tools like unit cost analysis will provide more granular information.
- Catch issues before they become user problems. Set up your Google Cloud monitoring suite to alert you about issues instantly via Slack, email, SMS, PagerDuty, ServiceNow, or another incident response tool so you can fix them before they become a bigger problem.
- Treat cost as a first-class metric. As one example, increasing costs may indicate an inefficient setup, such as idle or unused resources running continuously.
- Monitor unit costs in GCP. Find out who, why, and what is driving your Google Cloud spend by digging deeper than just total costs and averages. This way, you can pinpoint where to cut costs without negatively affecting customer experiences or limiting engineering innovation.
- Automate Google Cloud monitoring. Continuously monitor your infrastructure, apps, and service components with GCP monitoring tools. You can also automatically resolve issues with predefined rules.
Google outlines even more specialized principles, like cloud audit logs best practices.
What To Track In Your Google Cloud Monitoring Tool
Here are the metrics and elements you should track to ensure your Google Cloud services run optimally.
- Performance metrics. Monitor CPU usage to avoid overloading or underuse, and track memory consumption to keep applications within limits. The disk I/O should also be checked to identify performance bottlenecks.
- Application performance monitoring (APM). Request latency, error rates, throughput, and service dependencies are vital metrics to track for APM. These metrics help you monitor response times, identify and resolve errors, and measure transaction volume. They also detect failures or delays in microservices that could affect overall performance.
- Cost monitoring. Cost management is a critical factor in cloud computing. Track the cost of each GCP resource, such as compute, storage, and networking, to understand where your spending goes. Monitor costs per application to optimize costs and trends to spot unusual spikes and find opportunities for savings.
- Uptime and availability. Ensure critical services and endpoints are up and running, using uptime checks and synthetic monitoring to simulate user activity. Track uptime against your defined SLOs and Service Level Agreements (SLAs) to meet operational targets.
- Alerting and anomaly detection. Set up alerts for specific thresholds to receive notifications about potential issues. Use machine learning or pattern recognition to detect unusual behavior, such as unexpected spikes in usage or costs.
- Resource utilization. How you manage resource performance in Google Cloud is crucial. Monitor Google Compute Engine usage to track resource allocation and usage patterns. For Kubernetes, keep an eye on the health of pods, nodes, and clusters.
- Log management. Track error logs from your applications, services, and infrastructure to identify issues. Consider also using custom logs to gain insights tailored to your specific workloads.
- Security and Compliance. Cloud environments come with their own set of security risks. Track audit logs to monitor changes in your infrastructure, including user access and configuration updates. Threat detection tools like Google Cloud Security Command Center can be used to identify vulnerabilities or breaches.
So, what are some of the best monitoring tools for Google Cloud right now?
What Are The Best GCP Monitoring Tools Today?
The following Google Cloud monitoring tools cover various areas: GCP cost monitoring, security and compliance governance, application performance monitoring (APM), and resource utilization optimization.
The native tools include:
1. Google Cloud Operations – Native monitoring tool for GCP
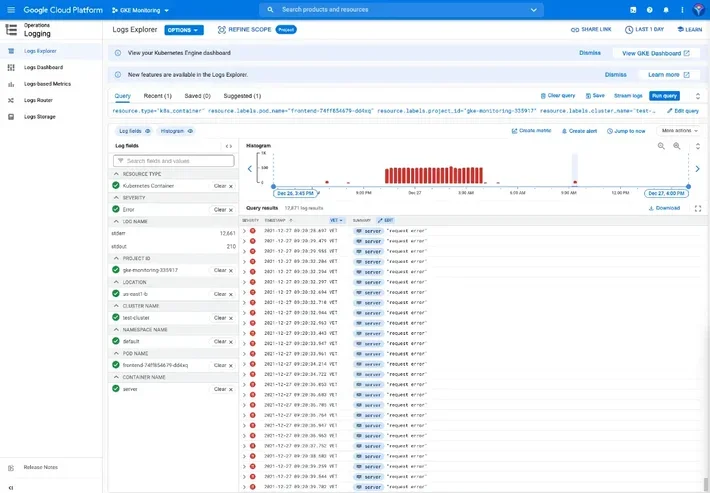
Formerly Stackdriver, Google Cloud Operations is a suite of tools that gathers metrics, traces, events, and metadata from the GCP environment, Amazon Web Services (AWS), application instrumentation, and hosted uptime probes.
While it originally collected application performance and virtual machine data, it now includes debugging, a profiler, and real-time log management for troubleshooting. The GCO platform can also pull monitoring data from services such as Prometheus, Cassandra, Elasticsearch, and Nginx, in addition to AWS’ Elastic Compute Cloud (EC2).
BindPlane collects this data from 150 app components, on-premises environments, and hybrid cloud configurations. GCO generates dashboards, charts, and alerts that provide readable insights based on this data.
The tools include:
- Google Cloud Monitoring. Enables you to track and visualize performance metrics from other Google Cloud services such as Compute Engine and GKE.
- Google Cloud Logging. Collects and stores logs from Google Cloud services and applications, providing real-time insights. It also enables detailed log data for troubleshooting.
- Google Cloud Trace. Offers distributed tracing to track latency issues, helping analyze request performance and pinpoint bottlenecks in your applications.
- Google Cloud Debugger. Enables developers to inspect and debug applications in real-time without halting performance. It is especially useful for identifying code-level issues in live environments.
- Google Cloud Profiler. Continuously analyzes application performance, helping identify high CPU or memory usage areas crucial for optimizing resource efficiency.
Non-native tools include:
2. CloudZero AnyCost – GCP cost management and optimization platform
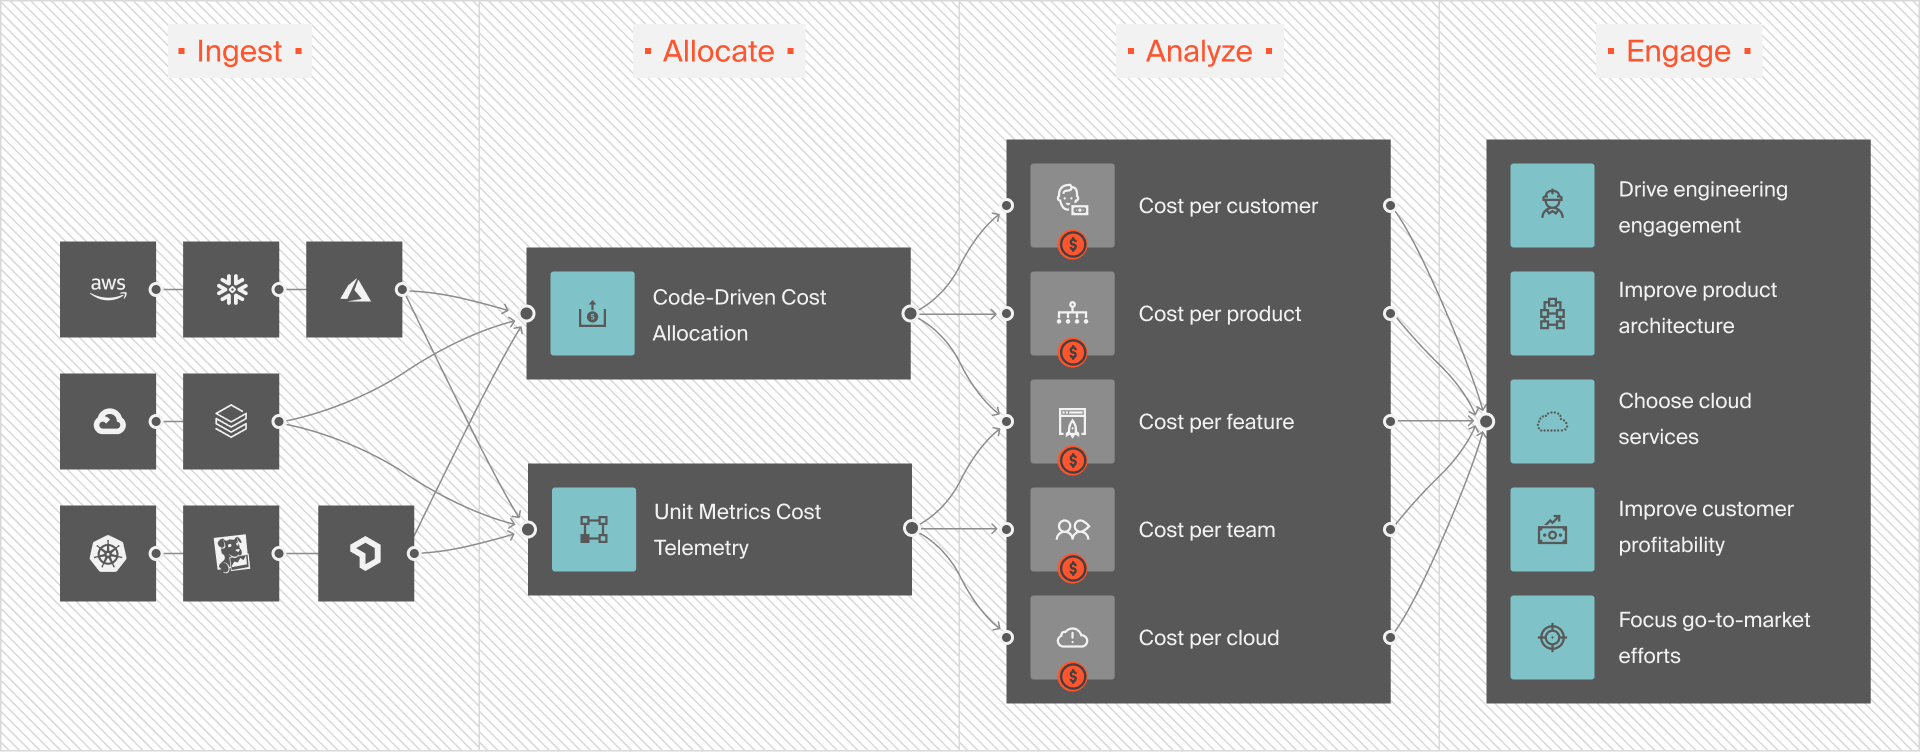
With CloudZero’s AnyCost, you can collect, analyze, and understand your unit economics for Google Cloud Platform (GCP) alongside Microsoft Azure, AWS, and software — from Snowflake and New Relic to Databricks and MongoDB.
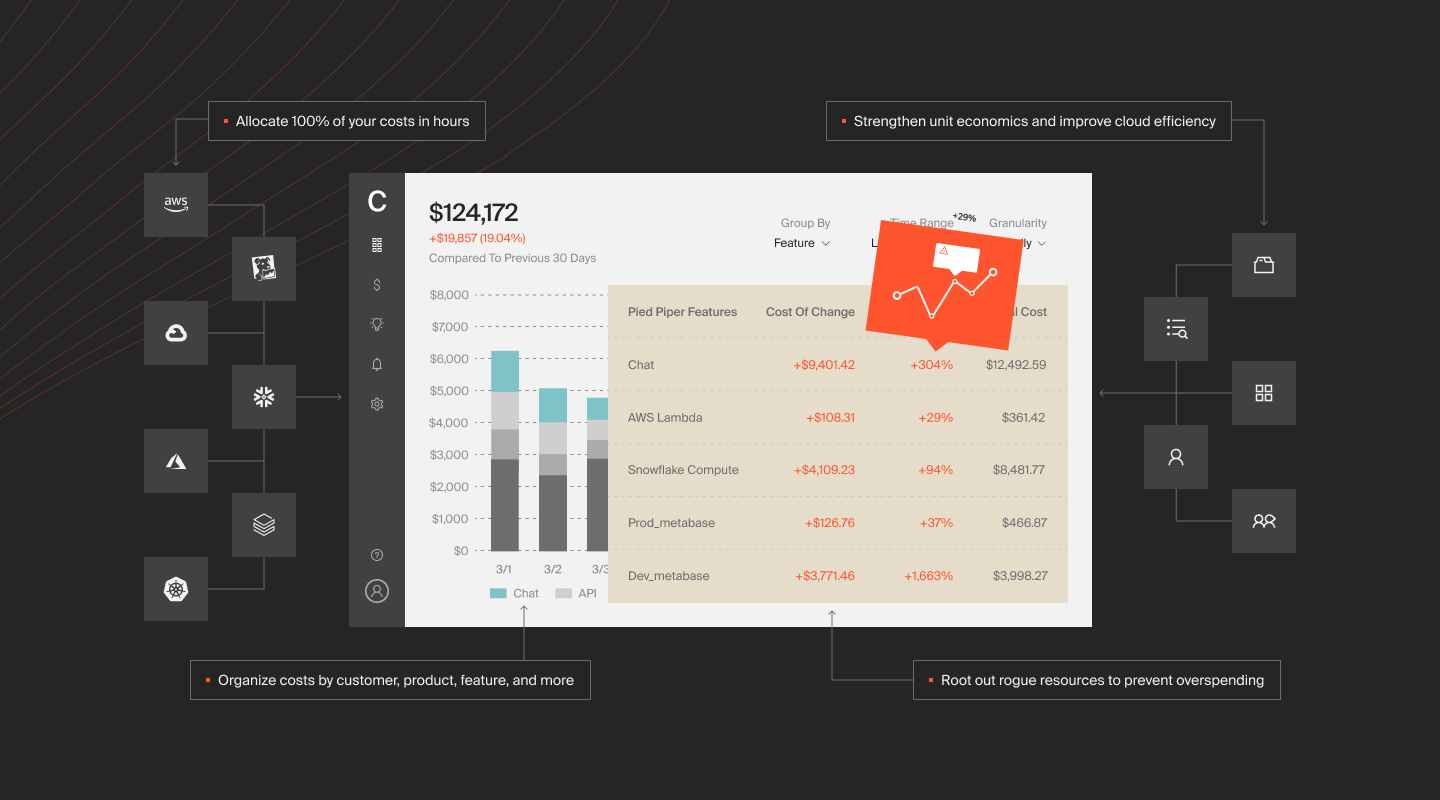
CloudZero is more of an observability tool than a cost management tool. It unifies data from multiple sources, enriches it, and delivers digestible information by role: engineering, finance, and FinOps. No tagging required.
- For engineering – Get detailed cost information, such as cost per software feature, cost per deployment, cost per project, cost per dev team, and more.
- For finance – View and understand your unit economics, including cost per customer, cost per project, and more. You can determine which customers are most and least profitable, how to price services profitably, and how to maximize returns from cloud investments.
- For FinOps – Analyze what, who, and why your Google Cloud costs are changing so that you can maximize ROI by reducing costs or increasing investments.
There’s more.
 to see how CloudZero customers optimize their GCP costs without endless tagging.
3. Zenoss – SaaS-based GCP monitoring platform
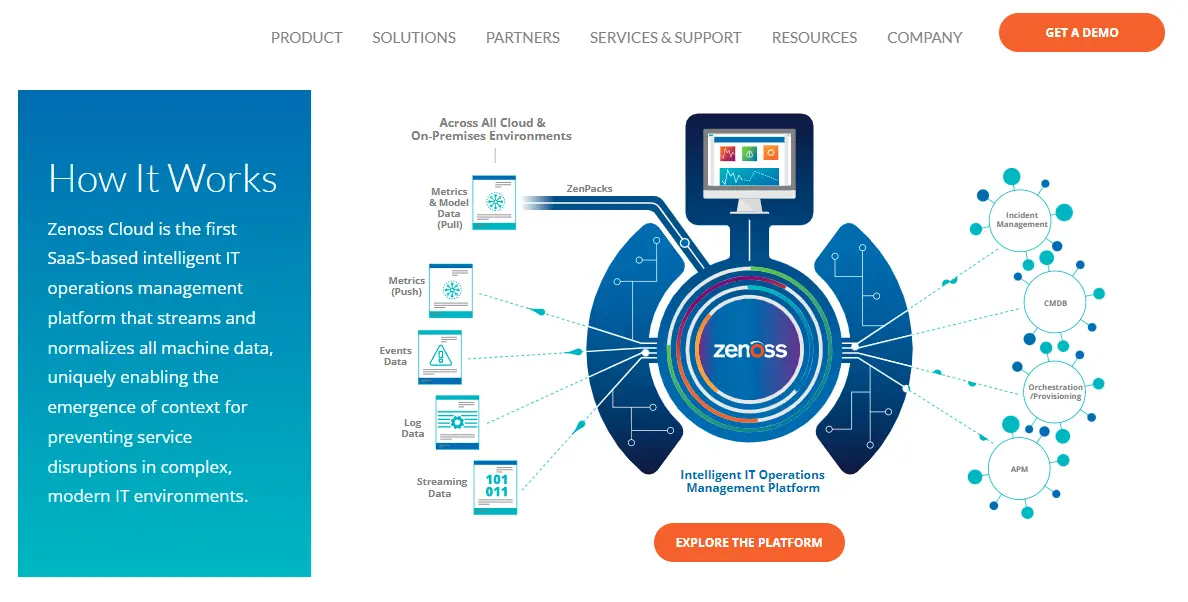
Zenoss integrates with the Google Cloud Platform to help enterprises monitor their compute instances and Kubernetes clusters. By mapping critical relationships between GCP components, you can identify when and where issues occur and gain insight into related dependencies.
With Zenoss, you can monitor servers and networks end-to-end. The ZenPacks extension enables application performance monitoring, monitoring containers and microservices, incident root cause analysis, and issue prioritization.
4. Sematext – Full-stack GCP monitoring with multi-cloud observability
With Sematext Cloud, you can discover, map, and monitor your entire Google Cloud infrastructure in real time. It tracks metrics, logs, traces, events, and end-user activity.
You can do about a dozen types of monitoring with Sematext for Google Cloud. These include application performance monitoring (APM), database monitoring, inventory management, synthetic user monitoring, and network monitoring.
Additionally, it monitors applications running in K8s, Docker Swarm, and Docker, enabling detailed container and microservice monitoring.
Besides real-time monitoring, Sematext offers anomaly detection, scheduling, and automated alerts. Its log management solution includes full-text search, filtering, alerting, and scheduled reporting and integrations with Syslog, Amazon S3, IBM Cloud, Elasticsearch, and Minio archiving.
5. Instana – Enterprise APM platform
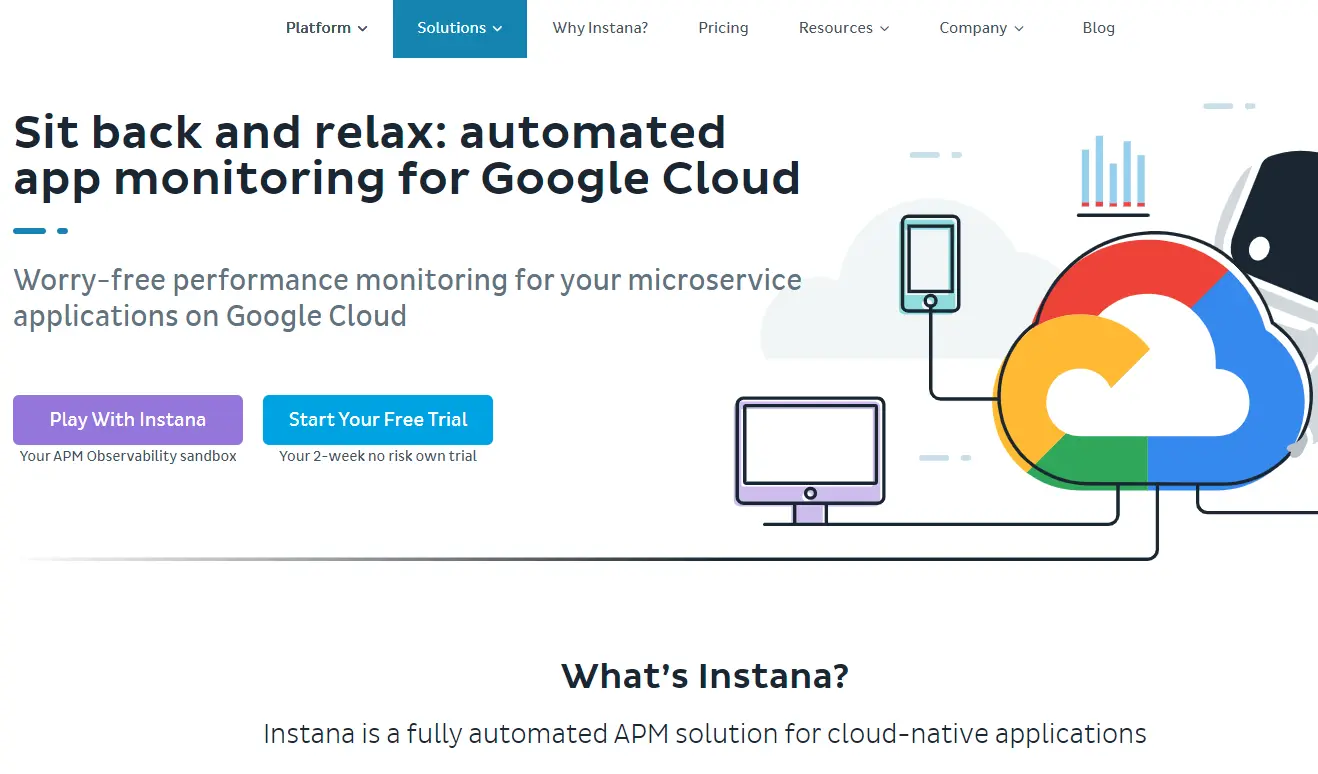
Instana is a native monitoring tool for the IBM Cloud. As a GCP monitoring tool, Instana uses a single agent to identify application building blocks and trace each request. This detailed tracing enables you to perform comprehensive root-cause analyses to discover and fix issues quickly.
The platform also creates a dynamic graph of all your dependencies so you can see what happens and how it affects other components in your GCP environment. With Instana, you can collect observability data every 1 second on GKE containers and microservices, analyze it, and act on it confidently.
Besides GCP, Instana also offers AWS, Azure, and IBM monitoring.
6. Site24x7 – End-to-end tracking with serverless architecture monitoring
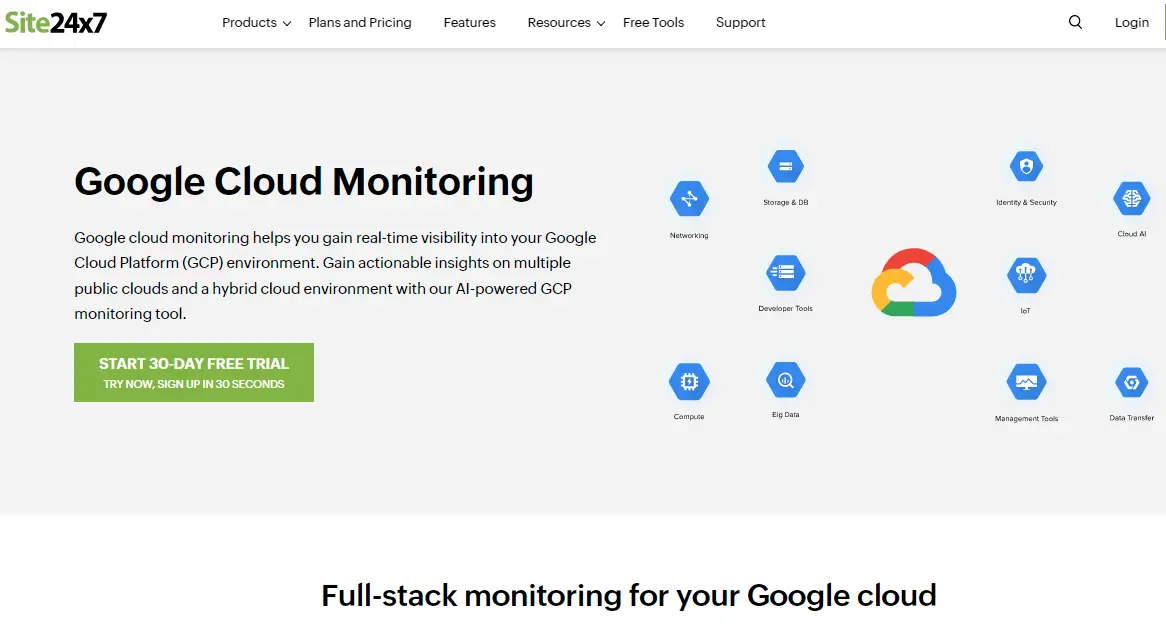
Site24x7 Google Cloud Monitoring provides real-time, full-stack, and enterprise-grade monitoring for most GCP services. That includes Google App Engine, Google Cloud Functions, Google Compute Engine, Google Kubernetes Engine, and Cloud Audit Logging. It auto-discovers your GCP resources and lets you add custom dashboards to view its status data.
It also lets you perform entire server, network, application performance, and hybrid cloud monitoring in one platform.
You’ll also have about a hundred ready-to-use plugin integrations, including MySQL, Redis, WebLogic, Hadoop, and NGINX. You can also build your own plugin to monitor specific apps, databases, and more.
7. Sysdig – Security monitoring for Google Cloud
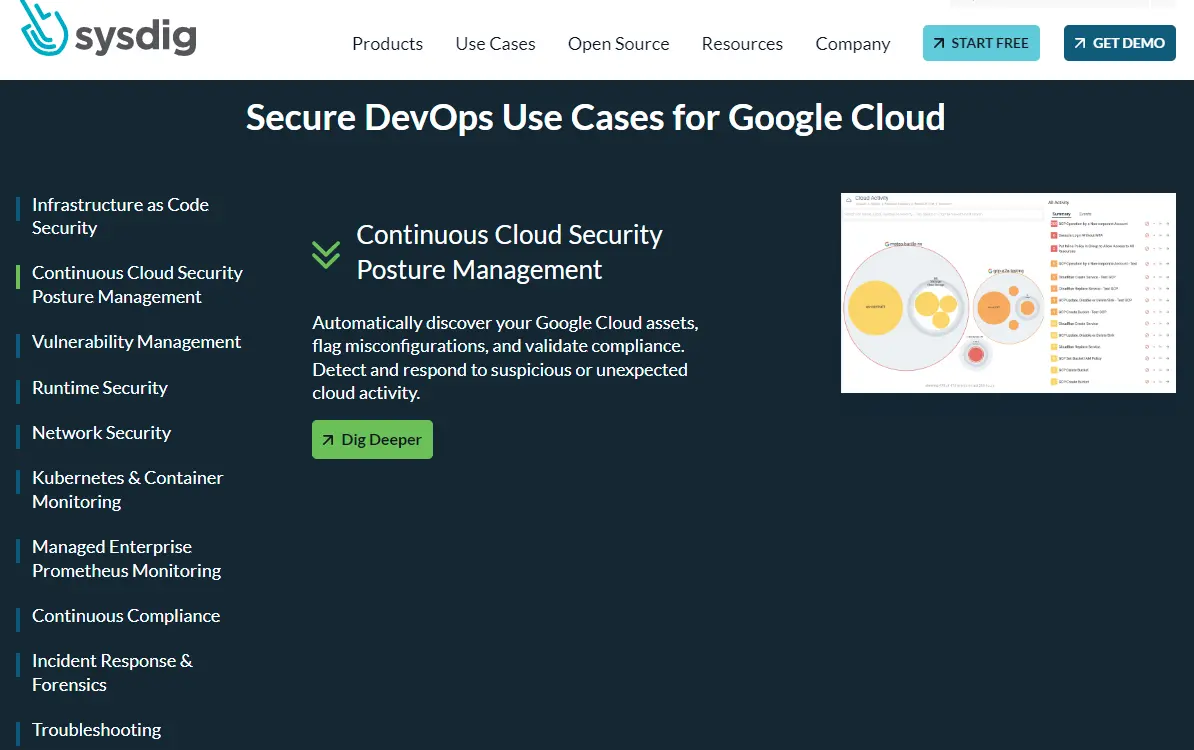
Sysdig helps your DevSecOps team detect, monitor, and secure workloads on Google Cloud. That includes workloads with an open-standards approach, including Google Kubernetes Engine and Anthos. Sysdig built its platform on Falco, Sysdig OSS, and Open Policy Agent (OPA), an open standard for runtime threat detection and policy management.
The platform also supports hybrid deployments, allowing you to analyze security concerns from your cloud environments in one place. In addition to GCP, Sysdig monitors your security posture for Azure, AWS, IBM, Oracle, and RedHat.
8. ManageEngine – GCP filestore monitoring
This Application Manager service auto-discovers, analyzes, and reports on the health and performance of four GCP services: Google Cloud Engine, Google Kubernetes Engine, Cloud Filestore, and Cloud storage.
Other capabilities include real-time monitoring, root cause analysis, anomaly detection, and alerting. Once you’ve set them up, you’ll receive alerts to your email, ServiceNow, or Slack. You can also automate corrective actions when you encounter performance issues. Use webhooks to initiate external actions or link them with your ITSM tools, like ServiceDesk Plus or ManageEngine ServiceNow.
9. DataDog – Enterprise-grade GCP monitoring with multi-cloud support
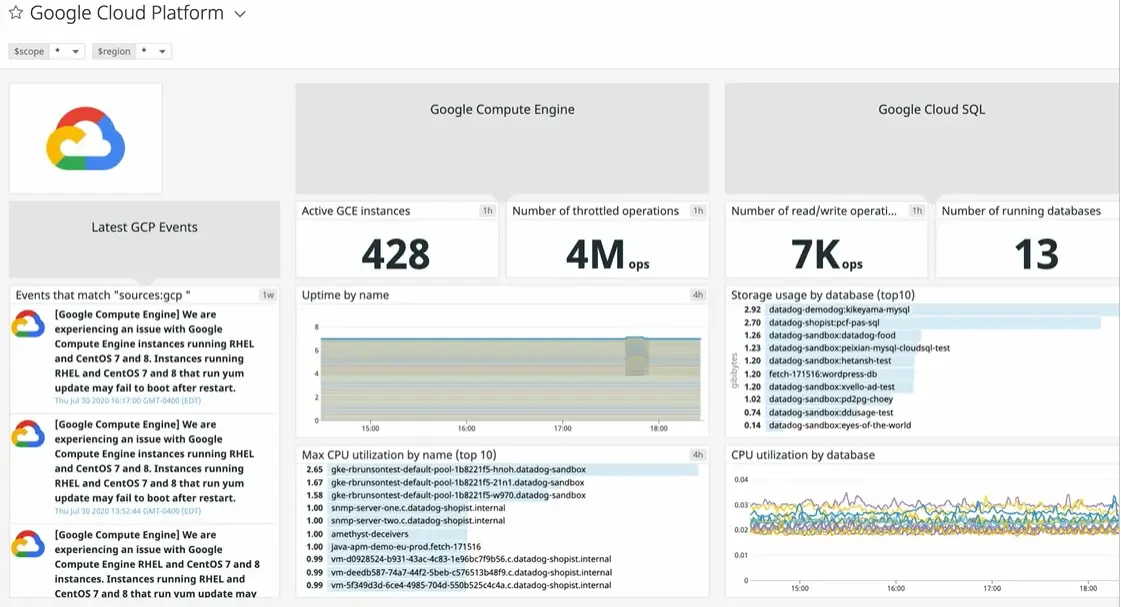
Datadog aggregates GCP observability data across any host and service, enabling complete visibility. Datadog’s Service Map lets you see the relationships between databases, APIs, containers, and more. You can follow the data streaming from an on-premise system to GCP or multi-cloud deployments.
Datadog connects to services like Google Cloud Run, collects real-time data, and automatically scales in response to new resources you create in the GCP environment.
In addition, Datadog is compatible with native integrations like Google Cloud Deployment Manager and Ansible. This instantly empowers you to deploy and configure it on new clusters, hosts, and other application resources.
10. Dynatrace – Container and app-level GCP monitoring
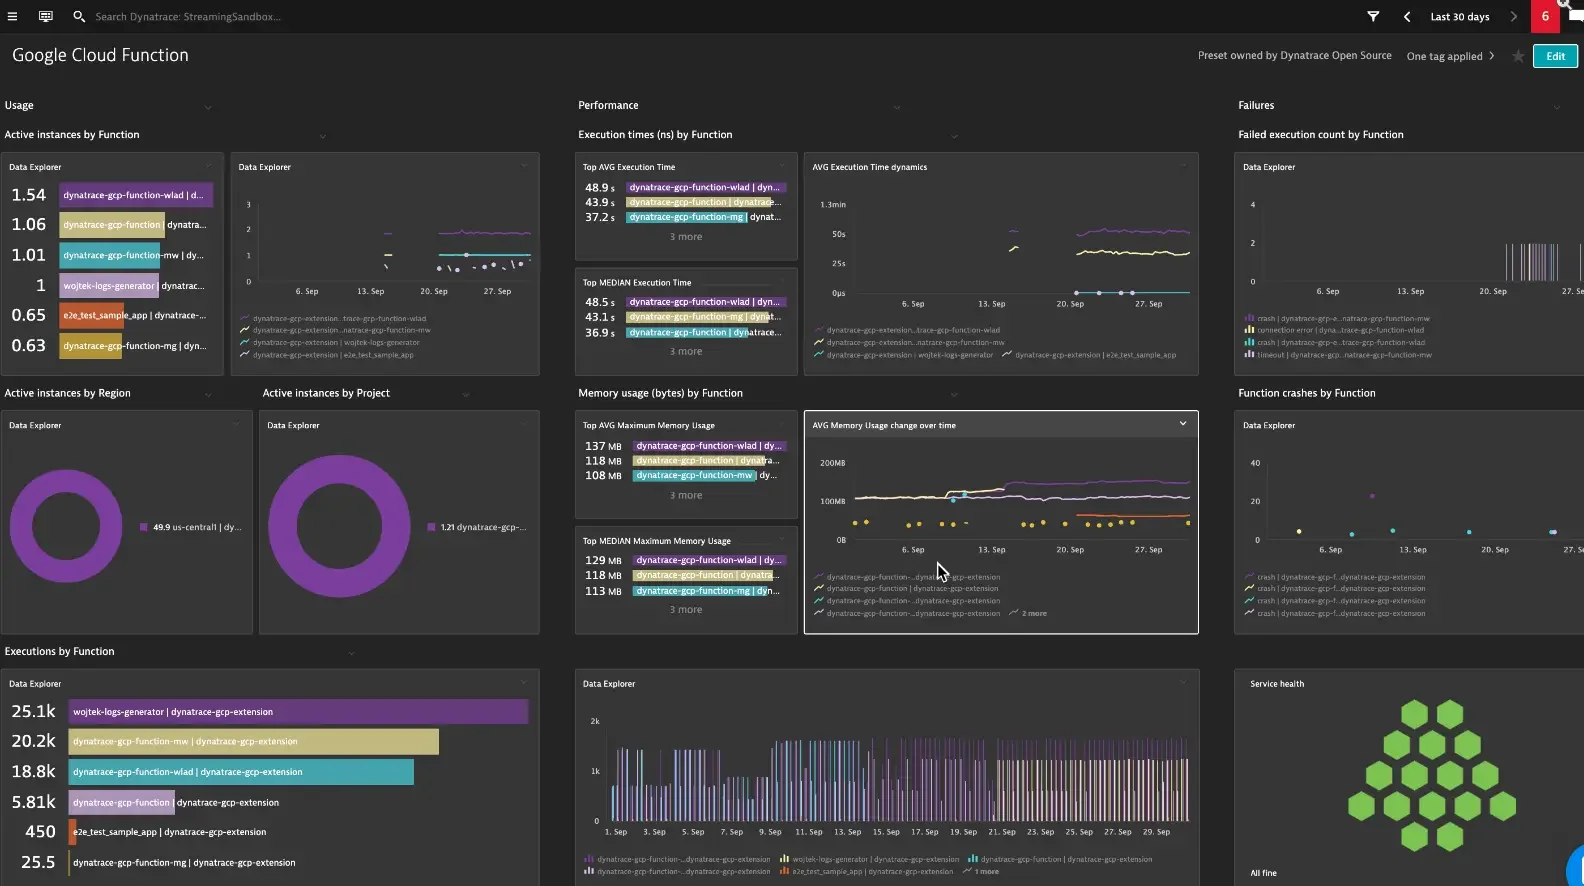
Dynatrace aims to provide deep visibility into Google Cloud services at scale and highly dynamic deployments. It analyzes metrics from each of the services available via Google Operations API. Dynatrace monitors 38 GCP services, from tracking Google APIs and Cloud Run to Google Dataflow and Cloud Spanner monitoring.
After installing Dynatrace OneAgent, the platform ingests GCP metrics and logs from multiple GCP projects. It also supports OpenTelemetry and distributed tracing. All this means automated monitoring around the clock, root cause analysis support, and real-time observability.
11. Elastic – Search, observability, and GCP security platform
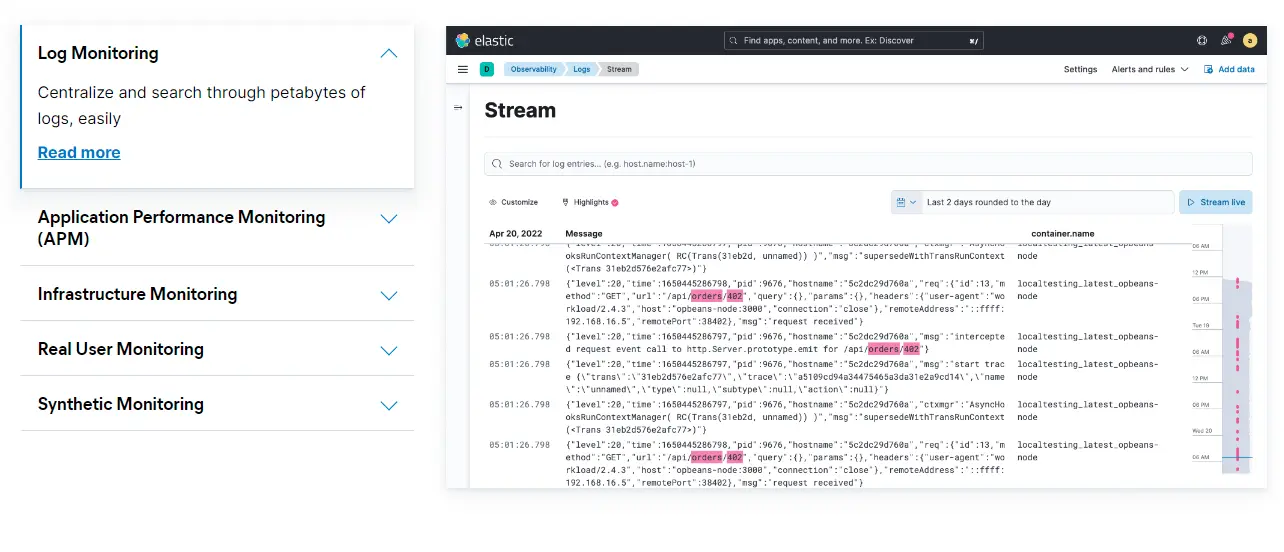
Elastic on Google Cloud ingests and stores data from your sources in any format. You can then index, search, and assemble GCP logs and metrics for real-time analysis and visualization.
Additionally, Elastic enables you to create visualizations and custom dashboards to help you interpret observability data and respond promptly to abnormal patterns.
Elastic Observability on Google Cloud helps you achieve that by monitoring metrics, logs, and APM traces at scale. The platform seamlessly integrates with other tools, including its Elastic Stack, which delivers Elasticsearch, Beats, Logstash, and Kibana for thorough data visualization, searching, and analysis.
12. Splunk – Observability and security platform for GCP
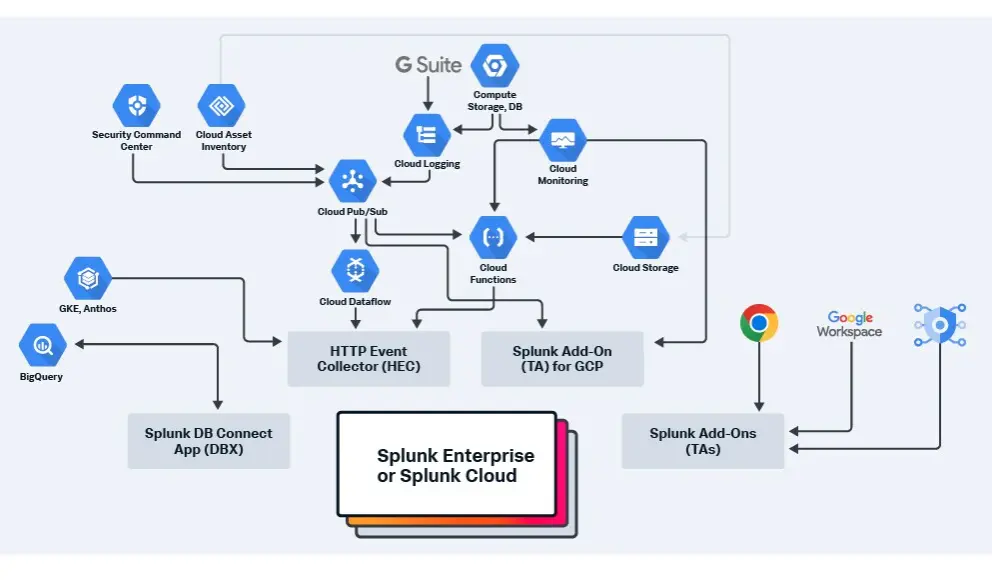
Splunk partners with Google Cloud to provide you with real-time visibility into Google Cloud logs, events, performance metrics, and billing data. By supporting open-source standards, such as OpenTelemetry, you can auto-instrument any data type once. With no reworks, you’ll have full-fidelity visibility across your hybrid system and existing GCP metrics in minutes.
Splunk does this through SignalFX. Security-wise, Splunk enables you to use Splunk Phantom Apps for Google Workspace, Google Workspace for Gmail, Google Vault, Safe Browsing, and BigQuery to orchestrate security infrastructure.
13. Opsview – Monitor GCP with host templates
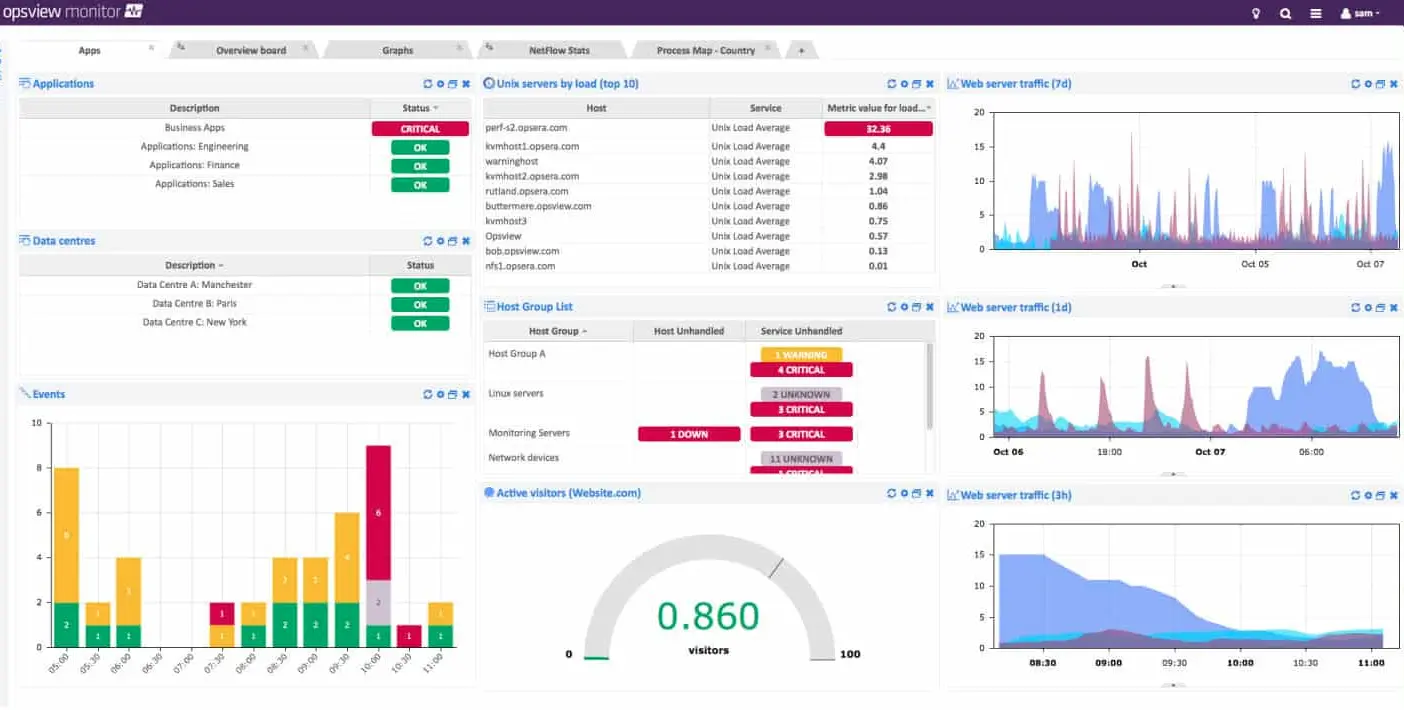
Opsview lets you extend its monitoring capabilities with plug-ins and Opspacks. Its GCP Opspack is free of charge. This Google Cloud Platform monitoring package simplifies monitoring performance metrics for Compute Engine Instances, Cloud SQL Database Instances, and Cloud Storage Buckets.
Specifically, it provides Host Templates for Cloud GCP Compute, Storage, MySQL, and PostgreSQL, in addition to all the other features of the standard monitoring service.
Opsview creates an application dependency map by searching through applications like a web crawler and passing across sites and cloud platforms. It is especially effective at chaining from websites through APIs and services, enabling complete visibility into the entire backend that supports the sites.
14. Sumo Logic – End-to-end GCP monitoring tool
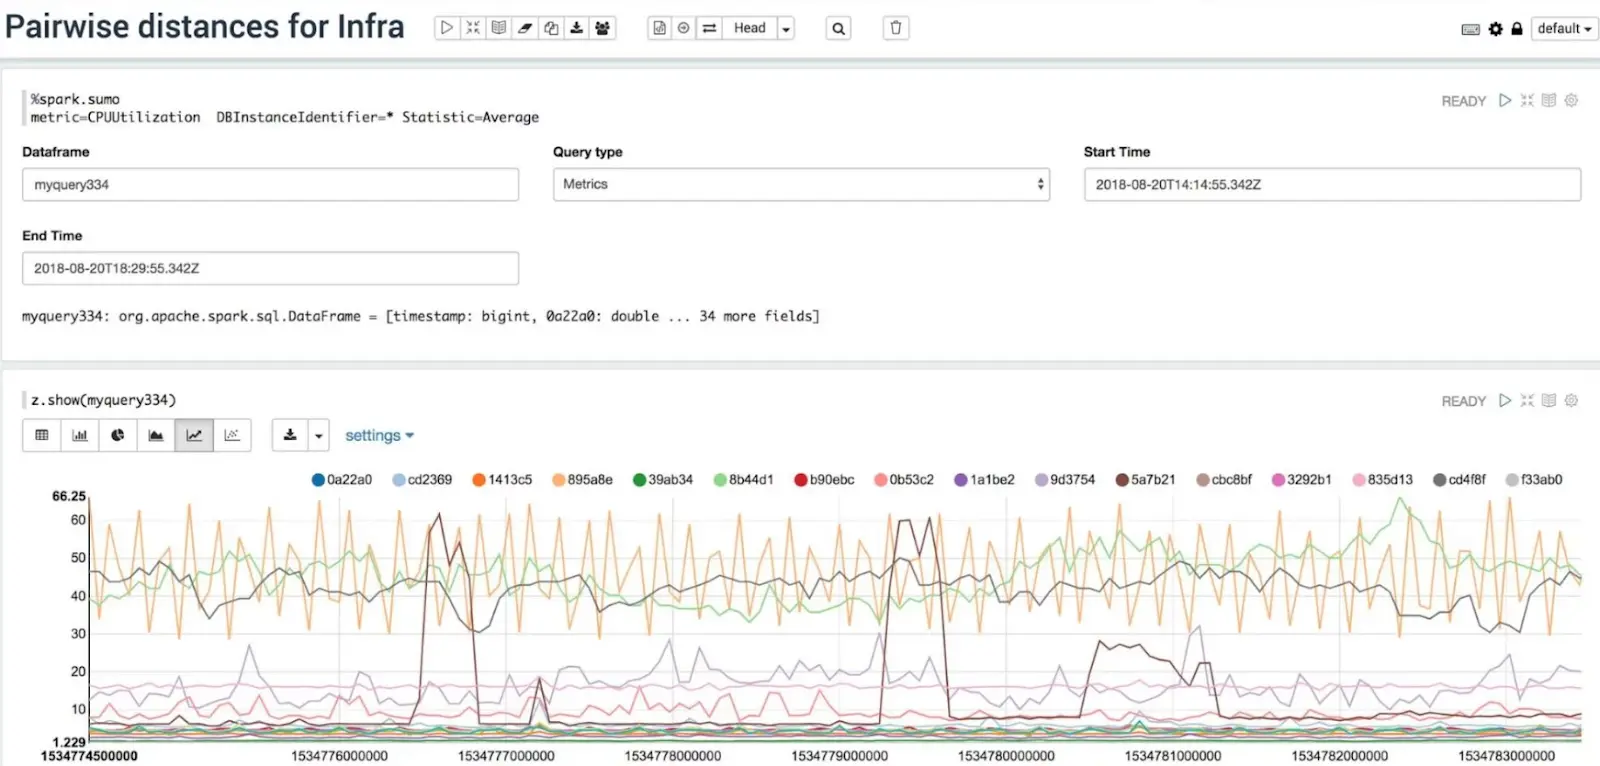
Sumo Logic emphasizes log management in addition to using metrics for real-time, continuous monitoring for Google Cloud. For example, its LogReduce algorithm enables grouping similar messages, while LogCompare provides data comparison between two periods.
The tool uses field extraction to enable rule-based data extraction from unstructured sources. It also delivers real-time application performance monitoring with alerting and custom dashboarding. You can also schedule your queries to run periodically.
Furthermore, it provides integrated PCI compliance and threat intelligence to detect, report, and counter cloud security risks.
15. New Relic – Comprehensive GCP monitoring with cross-cloud support
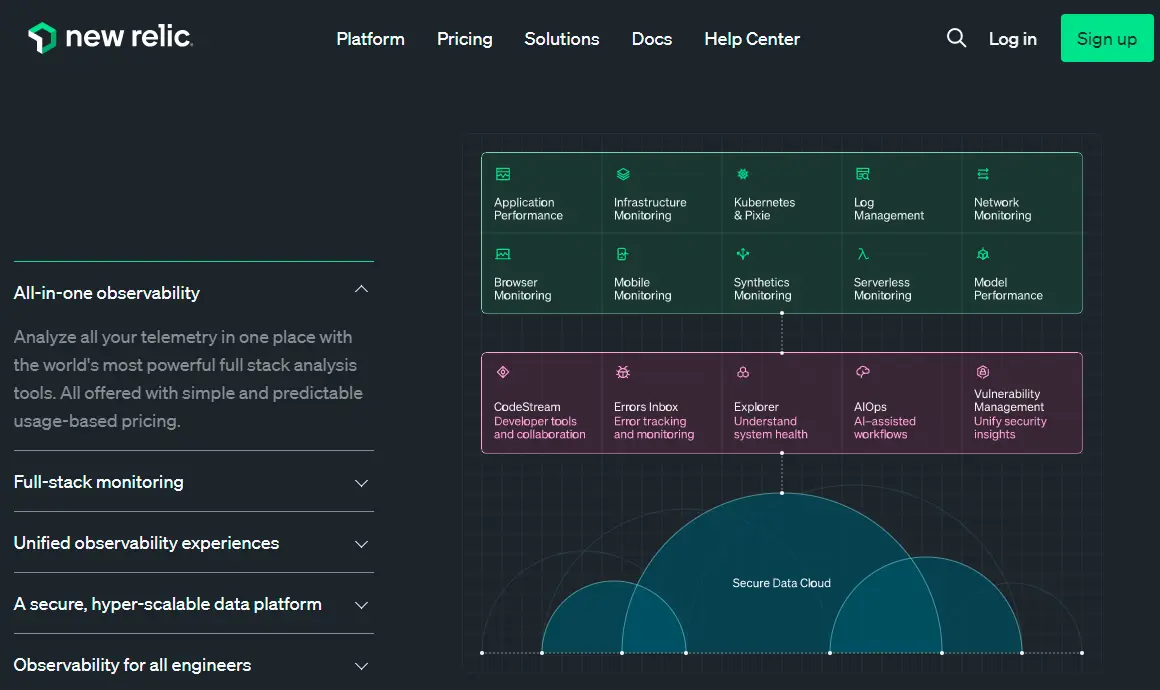
New Relic leverages metrics, logs, events, and traces to contextualize, correlate, and curate observability data across GCP environments. Expect a monitoring service with tools to track your system’s health across your infrastructure, cloud apps, and digital customer experiences – up to 21 GCP services.
New Relic also automatically detects anomalies, recognizes patterns, and reduces signal-to-noise ratio, intelligent sensing, escalation, and incident resolution.
With over 470 integrations, New Relic simplifies ingesting, hosting, and securing your telemetry data. It also lets you use your existing open-source tools with minimal additional infrastructure requirements.
What Next: Optimize Your Google Cloud Costs With Cloud Cost Intelligence
By monitoring your GCP environment with these tools, you can ensure that your cloud applications perform at their best. You can detect, analyze, and act on potential issues before they negatively affect your users.
A key metric to monitor in the GCP public cloud is cost. Most GCP cost monitoring tools display average and total costs, but CloudZero gives you granular details such as unit costs.
With CloudZero, you can view GCP cost per customer, product, feature, and more — all without endless tagging. CloudZero accurately identifies and presents the costs of tagged, untagged, and untaggable resources.
Don’t just take our word for it. {{cta(‘566b84fa(‘566b84f4-56e7-42ab-80be-70900e60024d’)}} to test CloudZero for yourself.


The Cloud Cost Playbook
The step-by-step guide to cost maturity