Cloud infrastructure and the applications it hosts generate millions of rows of raw data in short periods. Viewed in the context of everyday business activities, most of the data makes little sense. So many companies amass mountains of this type of data in data lakes and data warehouses, hoping to figure out how to use it later but end up never tapping into it.
Whether you have hundreds or thousands of customers or run a boutique business that serves a few clients with growing operations, you can face this dilemma.
What Is Cloud Reporting?
Reporting in the cloud involves collecting, analyzing, and presenting data generated in a cloud environment so that it is easier to derive and share valuable insights to support everyday business decisions. For most organizations, cloud reporting is a core part of their FinOps practice — enabling teams to track cloud spend, allocate costs, and optimize usage across AWS, Azure, and GCP.
A subcategory of effective cloud management, cloud reporting comprises a set of tools and monitoring best practices.
Reporting tools ingest metrics, logs, events, and other metadata from a variety of sources. These sources include cloud infrastructures, microservices, containerized apps, and Kubernetes clusters.
After enriching, analyzing, and normalizing the data, they present it as easy-to-understand charts, graphs, tables, and other visual representations. So, instead of these rows and columns of unusable numbers and letters…
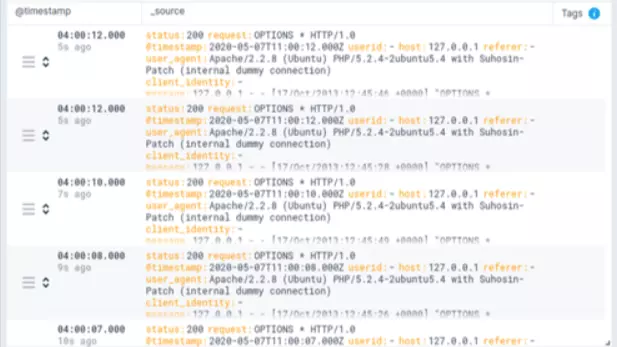
…what you get instead are meaningful insights:

The tools enable users to report data in a static or interactive format. Most cloud reporting tools also serve as cloud business intelligence tools, enabling stakeholders to gain real-time insights and make timely decisions on the fly.
Report
Finance needs to prove AI’s return: CloudZero report
260 senior finance leaders (more than half CFOs) told us why the speed of seeing AI spend, not the size of it, separates who pulls ahead on AI from who gets burned.
Advantages Of Cloud Reporting Tools Vs. Traditional On-Premises Business Reporting
Cloud-based reporting differs from traditional reporting tools in several ways. With cloud reporting, you can:
- Get real-time insights into your cloud environment to govern it effectively.
- Reduce the costs of purchasing, installing, and maintaining on-premises software. For a predictable subscription fee, cloud reporting vendors take care of all the back-end work.
- You pay only for the capabilities you need when you need them.
- Use automation to detect and report abnormal cloud activity before it becomes a problem.
- Enhance collaboration between engineering and finance teams to optimize cloud costs while providing best-in-class customer experiences.
- Share dashboards with anyone, wherever they are, as long as they have an internet connection and valid credentials.
- Make sure you are using the latest, most secure, and most efficient version of the cloud reporting tool you use.
- Share dashboard access with vendors to reconcile cloud reports.
- Build a real-time dashboard for each business process, such as cost per customer and cost per project.
So why does cloud reporting matter now more than ever?
Why Cloud Cost Reporting Is Crucial In 2026
Analytics and data play a crucial role in modern business.
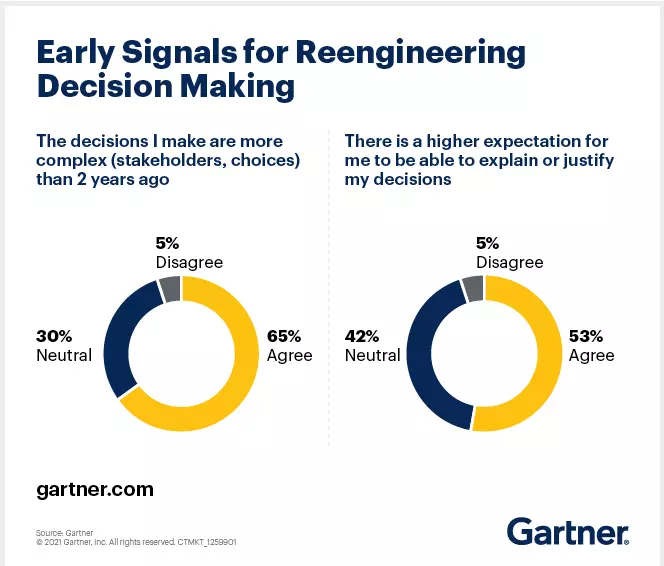
Gartner found that 65% of business leaders’ decisions now are more complex than they were just two years ago.
For a CFO or cloud governance professional, this means finding innovative and effective ways to ensure business continuity and resiliency in the face of continuous change.
Using real-time risk assessment and mitigation, automation, and continuous value delivery can help organizations make better business decisions.
The raw data you produce in the cloud needs to be aligned and reported based on how you use it in your organization rather than how the cloud environment produces it. The right business reporting tool can enable you to decide in a contextual, connected, and continuous manner.
By combining automation, security, cost optimization, and effective collaboration, the business decision-making process is also transforming. Working with distributed teams, for example, requires a secure and effective way for everyone to resolve emerging issues together.
Take a cloud reporting tool that offers automated cost anomaly alerts, for example. You can set this up to alert you every time the platform detects abnormal cost metrics. You can receive alerts by email or SMS. Alternatively, it can send them directly to your company’s most qualified person or team via Slack.
 Here, your staff can immediately find out if there is a problem they need to fix to prevent overspending. Or they can confirm that the increase is coming from genuine, growth-related activities within your business, such as onboarding new customers and supporting new features.
Reporting In The Cloud: The 15 Best Cloud Reporting Tools
These tools will allow you to explore, monitor, and visualize different kinds of cloud data without having to write a single line of code. They can turn your data into meaningful charts, tables, and graphs in real-time. You can then share the actionable insights within seconds with whoever you choose. Whether you need multi-cloud visibility, cost allocation by team, or unit economics dashboards, there’s a cloud reporting tool designed for your use case.
Cloud Cost Visibility And Reporting
An ever-changing cloud environment can make managing costs challenging. Tools like Amazon CloudWatch and Microsoft Azure Cost Management act as starting points for cloud cost visibility. However, these three are more comprehensive.
1. Cloud Cost Intelligence: CloudZero
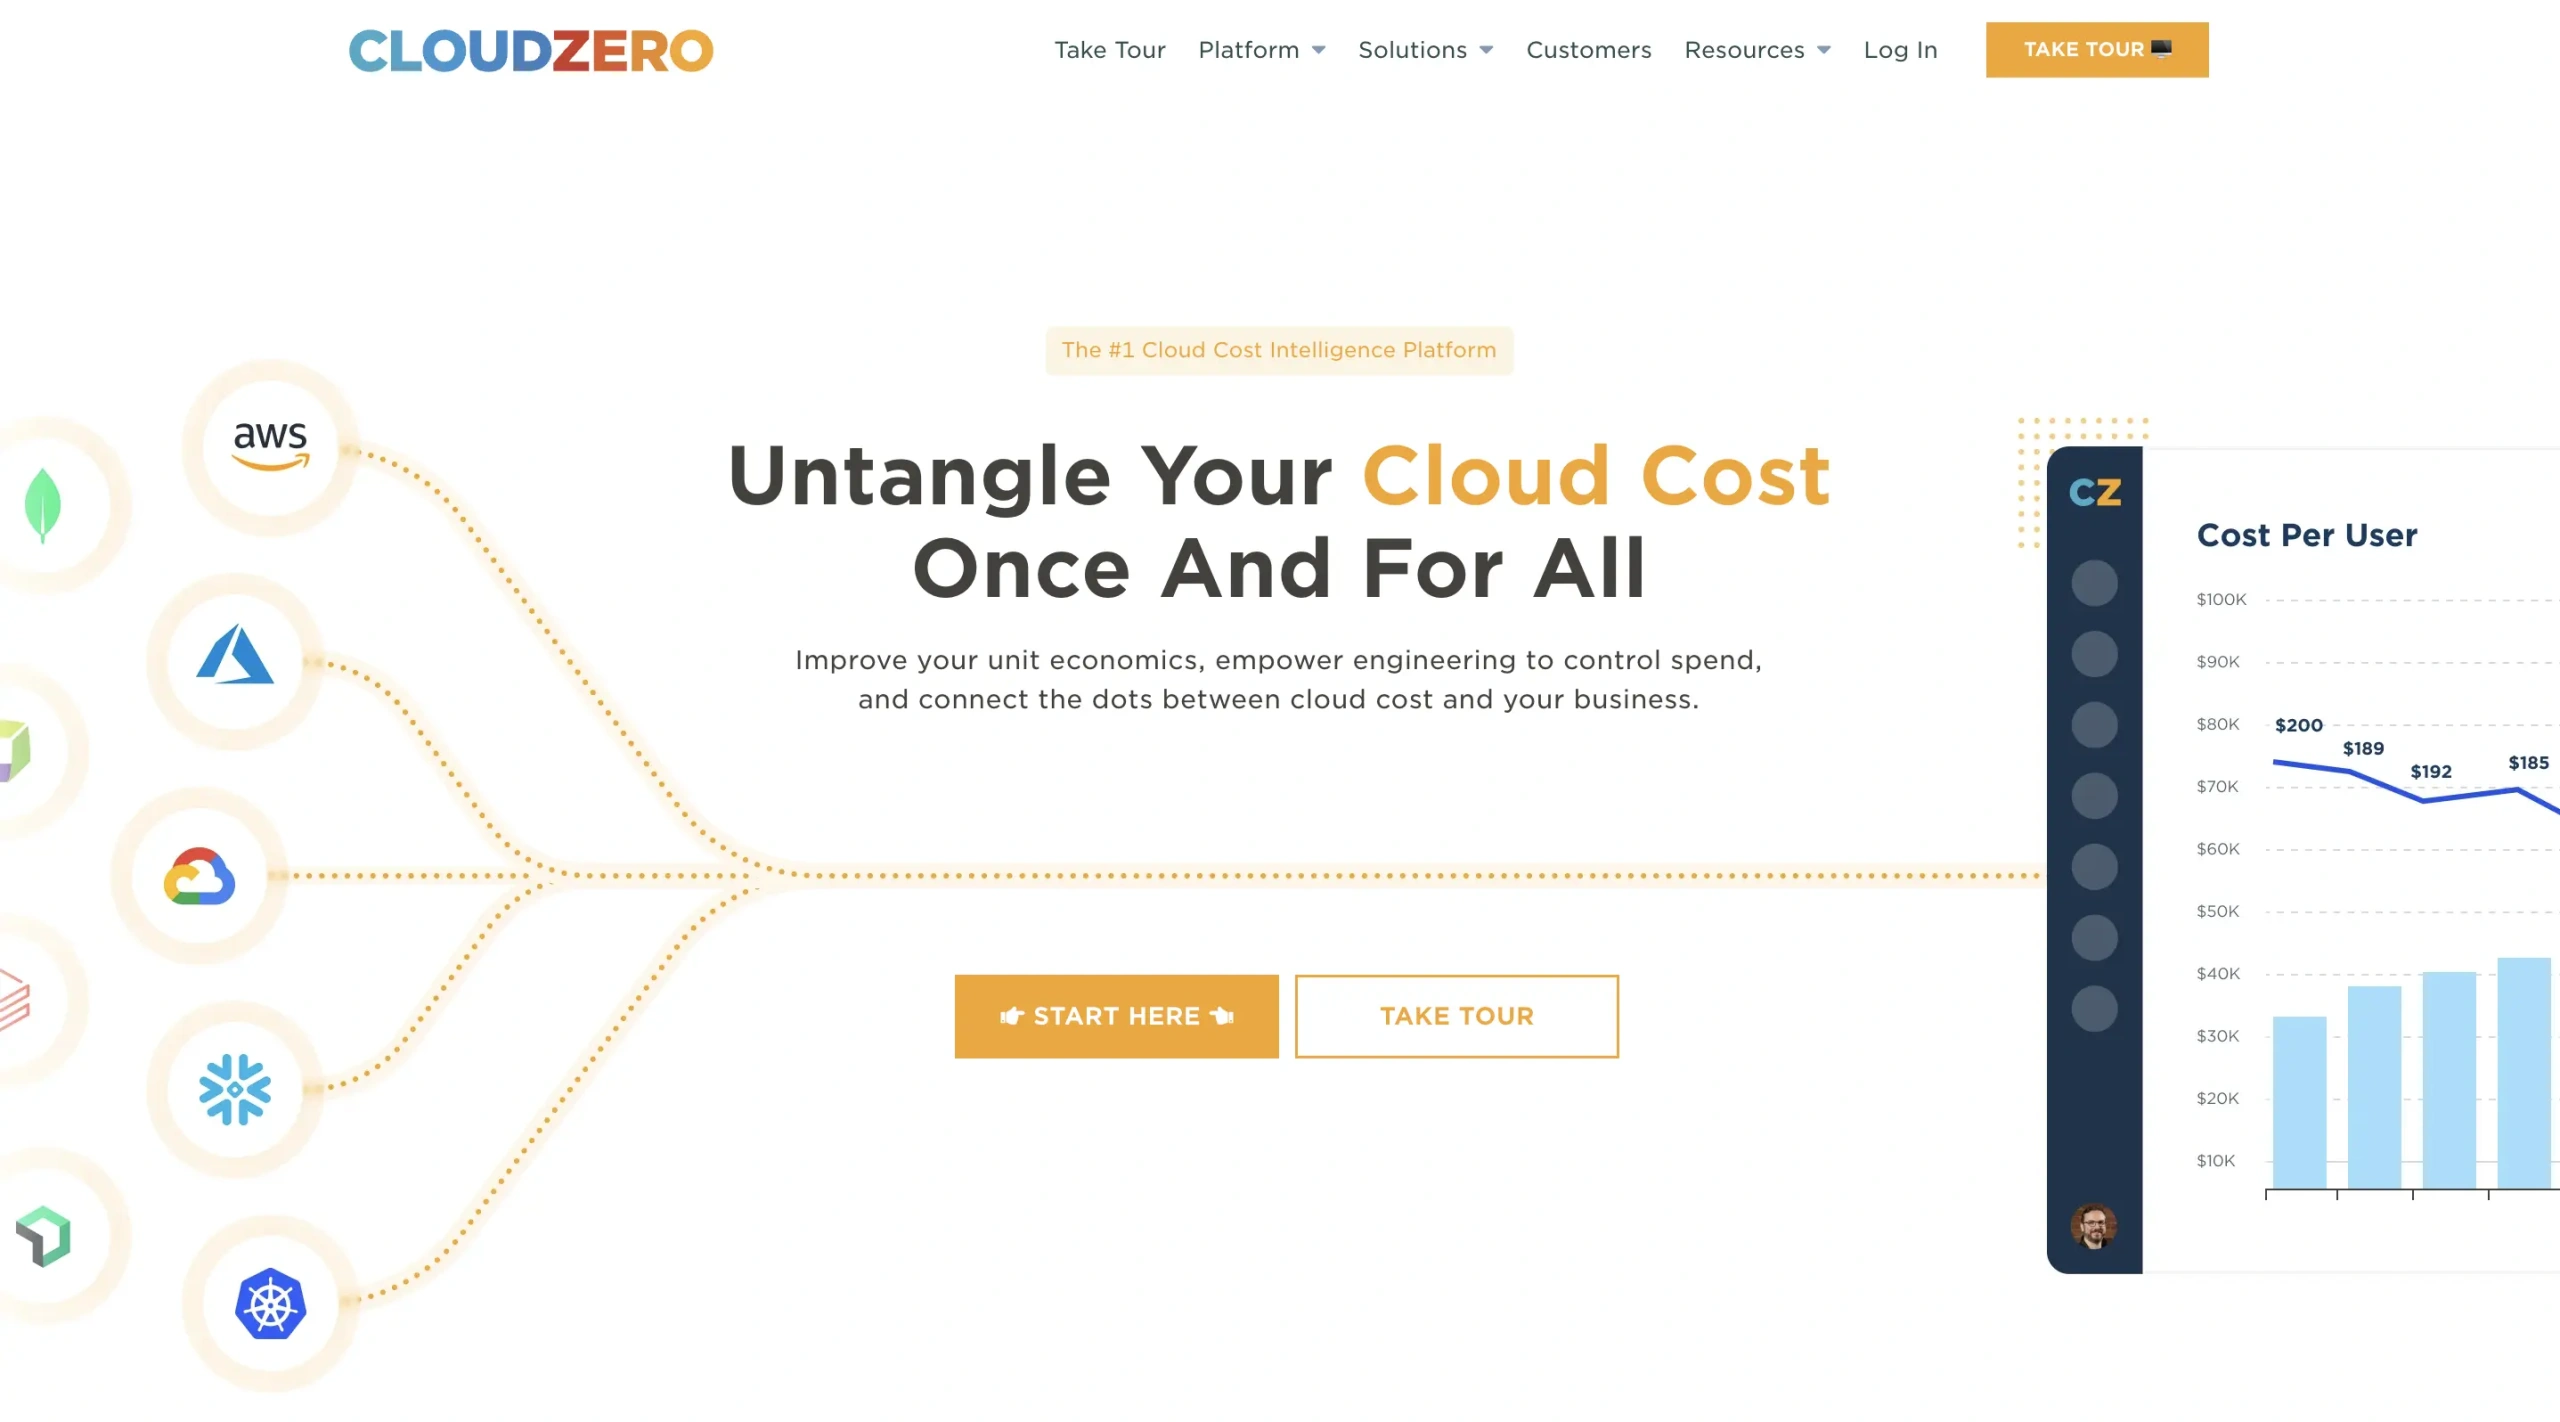
CloudZero is a modern, full-fledged cloud cost intelligence platform for SaaS and tech brands. Engineers, finance professionals, and executives can use it to track who, what, why, and where their cloud spend is going on AWS. CloudZero excels in eight key areas, unlike other reporting tools that are clunky and inexact:
- Cost per customer reporting – Find out how much it costs to support a specific customer and adjust pricing accordingly to ensure profitability.
- Unit cost insights – Know how much each product feature, development project, team, etc., costs so you can improve efficiency and achieve economies of scale.
- SaaS COGS analysis and reporting – Get a comprehensive understanding of your cost of goods sold to know how to improve your gross margins.
- Cloud cost optimization – Identify opportunities to reduce costs in the AWS public cloud through expert, timely, and ongoing recommendations and coaching.
- Tags and cost allocation – Organize your cloud costs without endlessly tagging. View meaningful insights from shared, untagged, and untaggable cloud resources so you can accurately allocate your costs.
- Kubernetes cost monitoring and reporting – Prevent cost blindspots while you embrace Kubernetes, containerized apps, and multi-tenant infrastructure.
- Cloud migration intelligence – Monitor your migration to AWS in real-time to avoid cost surprises.
- Engineering cost awareness – Enable engineers to see how their activities affect finances to build cost-optimized solutions without sacrificing innovation.
- Cost anomaly detection and alerting – Get timely reports when CloudZero detects abnormal cost metrics trending, so you can avoid exceeding your budget.
With CloudZero, you can get the answers you need to enhance innovation, flexibility, speed, and efficiency without overspending. Schedule a demo here.
2. Traditional Cloud Cost Reporting: CloudHealth
CloudHealth, VMware’s cloud cost management tool, provides several reporting capabilities. CloudHealth may be a good option for you if you are looking for a platform to combine cost reporting with security and compliance management. It also offers reporting for hybrid cloud and multi-cloud environments.
3. Traditional Cloud Cost Reporting: Cloudability
Cloudability promises to help IT, DevOps, and finance teams optimize cloud resources for cost, quality, and speed. The Cloudability dashboard lets you see your cloud costs at a high level, configure Reserved Instances, switch between different accounts, and turn off unused resources. You can also use it to rightsize your public cloud resources to minimize costs.
Cloud Security And Compliance Reporting
There are several types of cloud security solutions available today. With the following tools, you will receive continuous cloud security and compliance reporting to keep your cloud environment safe from data breaches and external performance degradation.
4. Automated Detection And Response: Blumira
Through its cloud SIEM platform, you can detect threats in time to mitigate damage. Along with reporting on cybersecurity threats in near-real time, Blumira also offers automated risk detection, known threat blocking, and quick response.
Blumira integrates seamlessly across cloud environments, identity providers, such as Google Workspace, and endpoint protection solutions. Blumira can help with CMMC, NIST 800-53, and FFIEC compliance.
5. Secure DevOps Platform: Sysdig
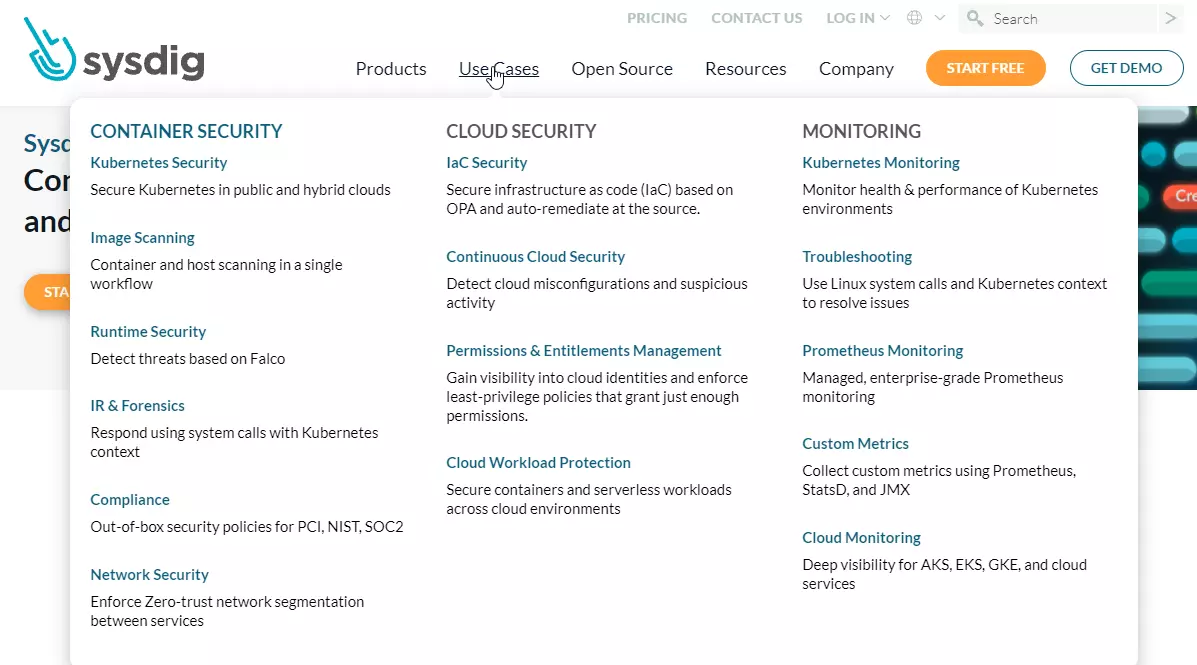
If you’re looking for one agent to monitor and report on Kubernetes, hosts, and containers, Sysdig is may be a suitable choice for you. It provides continuous infrastructure operational monitoring and security reporting.
Integrate it with multiple platforms to extend its functionality, such as SIEMs like ServiceNow and PagerDuty, registries like DockerHub, and continuous integration and delivery (CI/CD) tools such as Jenkins and Bamboo.
6. Cloud Infrastructure Security: Orca Security
Orca Security provides agentless security in AWS, GCP, and Azure clouds. It uses a cloud provider’s snapshot mechanism to get a read-only view of data. Orca Security promises this has no performance implications and is agnostic to VPCs, OS credentials, and machine run-states.
The platform collects data directly from your cloud configuration and the runtime block storage out-of-hand of the workload to enable you to fix vulnerabilities, malware, misconfiguration, and more.
Cloud Infrastructure Monitoring And Reporting
Cloud infrastructure often generates lots of immediately unusable data. Several tools are available for capturing logs, metrics, traces, and events at each layer.
You can then analyze it, present it in a meaningful format, and share the actionable reports with stakeholders to make data-backed cloud decisions.
7. Cloud Infrastructure Reporting: SolarWinds
Solarwinds provides a full-stack platform that lets you monitor and report on your infrastructure health, network performance, and cloud security. The platform includes several tools you can use for specific tasks:
- AppOptics for infrastructure and application monitoring data
- Pingdom for websites and web applications reports
- Loggly for aggregating and analyzing logs, and
- Papertrail for viewing logs quickly.
It provides out-of-the-box support for Amazon Web Services and Microsoft Azure. It also supports real-time monitoring, distributed tracing, and various log structures.
8. Cloud Log Reporting: Sumo Logic
Sumo Logic is a cloud monitoring platform with a strong focus on cloud log management, but also analyzes and delivers insights based on metrics and traces. You can use it across AWS, Azure, and Google Cloud Platform.
Both novices and more experienced users can cluster messages using its LogReduce feature. Using the LogCompare tool, you can then detect any abnormal changes between data produced at different times.
9. Infrastructure Health Reporting: Sematext
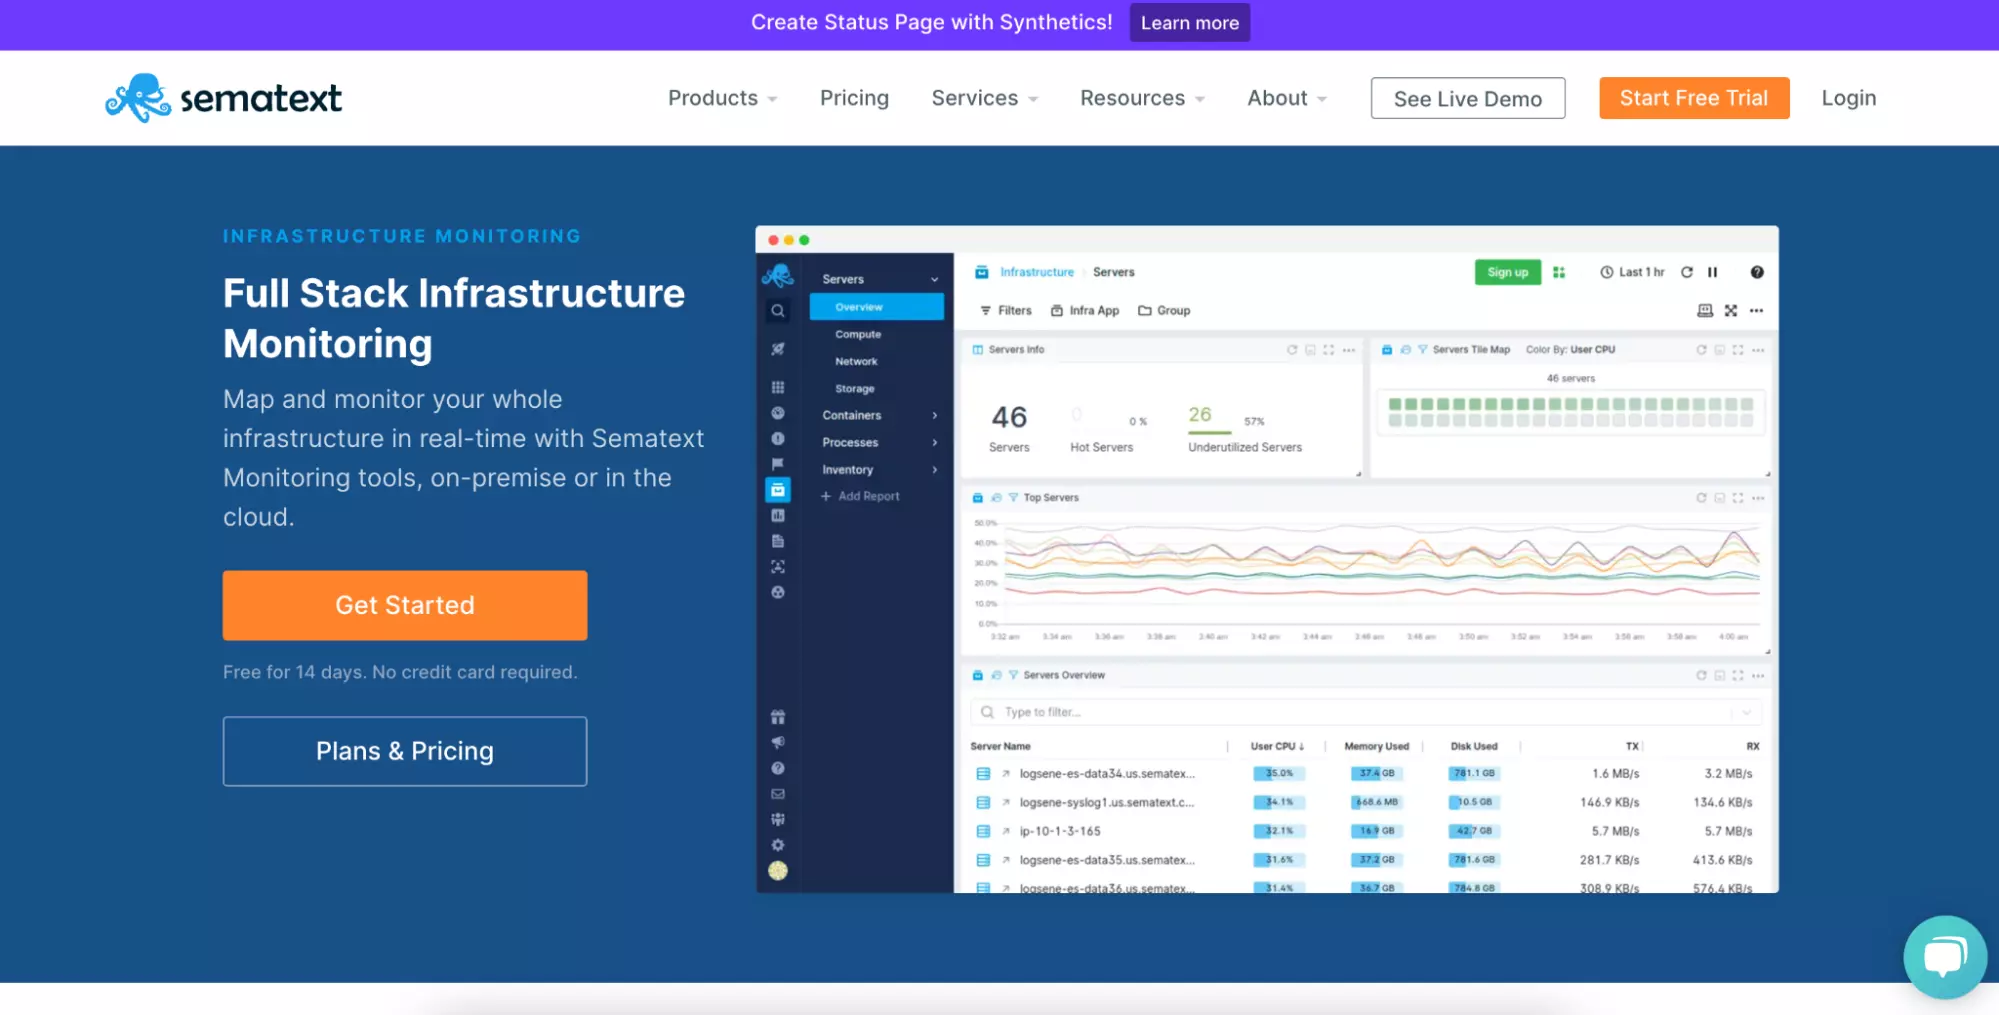
Sematext provides visibility into your IT infrastructure, whether it’s in the cloud (Sematext Cloud) or on-premises (Sematext Enterprise). It is an end-to-end observability platform that reports on various aspects of your cloud, including server logs, databases, and response times. It also works with both private and public clouds and hybrid and container platforms to enhance reporting.
Cloud Application Performance Reporting
You may find these three options helpful when you want to monitor and report on your cloud applications’ performance, whichever environment they are in.
10. Full-stack APM Reporting: DataDog
DataDog’s roots are in infrastructure monitoring and reporting as a full-stack observability tool. It later added application performance monitoring (APM) for modern apps.
You can use its APM tool to trace distributed requests across all involved hosts and each service from end to end. You can also see details such as errors per second, aggregate latency, and hits per second.
11. Modern App Environment Reporting: New Relic
With New Relic, you have full visibility into your cloud applications and the environment those apps run in. Getting a more contextual view enables you to determine root causes.
New Relic shows exact method calls, complete with line numbers, for all app sizes to ease finding such issues. By utilizing query-based analytics and customizations, the tool helps you spot any abnormalities in the application environment.
12. Root-cause APM Reporting – Dynatrace
Dynatrace also provides full-stack application performance and infrastructure monitoring capabilities. With a single APM agent, it supports real-time, end-to-end reporting for both.
You can use Dynatrace to gain insights into any environment or application. It traces requests through the entire call tree to identify root causes that are easy to miss. You can also get reports on hosts, services, processes, and entire data centers.
Kubernetes Governance And Reporting
The rapidly changing nature and the vast scope of Kubernetes environments can easily blindside you. In the following platforms, you can make sense of Kubernetes data to eliminate blind spots.
13. Native Kubernetes Reporting: Kubernetes Dashboard
The UI add-on runs on an internet browser, so you can easily see what’s going on inside your Kubernetes environment. With the Kubernetes Dashboard, you can view reports on workload health and node status, such as CPU and memory utilization metrics.
Using it as a starting point for monitoring a Kubernetes environment can be a good learning experience before exploring more comprehensive Kubernetes reporting tools.
Another straightforward option to consider here is Prometheus with Grafana, or cAdvisor.
14. Open-Source Kubernetes Reporting Tool: The ELK Stack
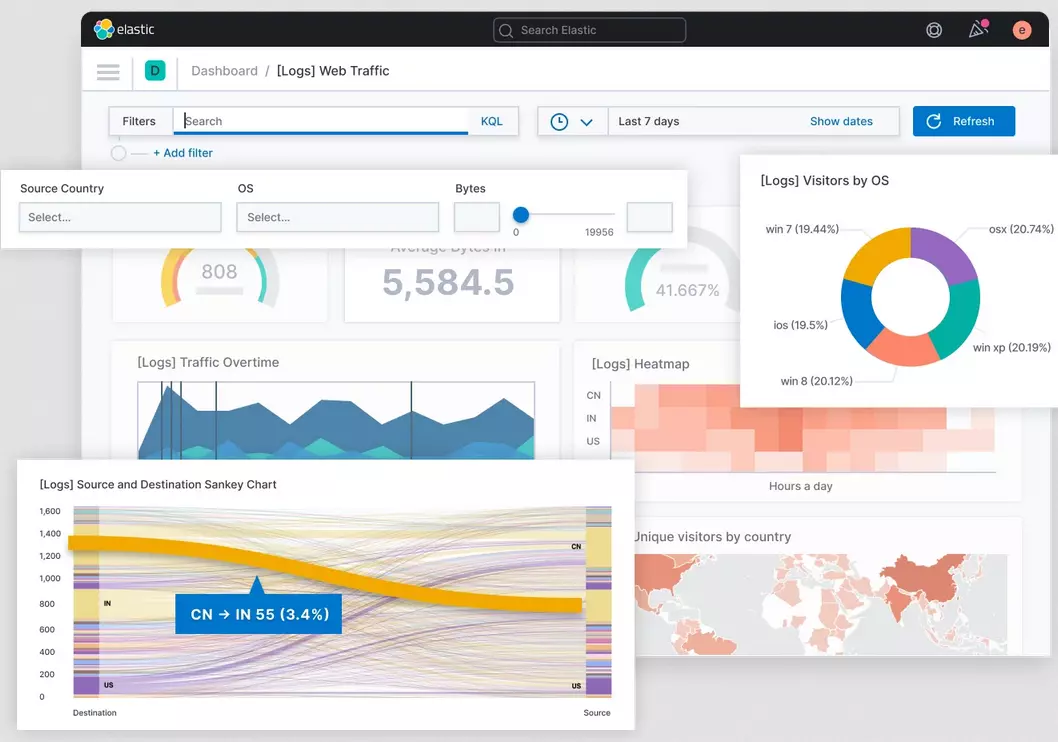
Once you’ve gained Kubernetes management expertise, you can explore more complex functions with an open-source tool like The ELK Stack (Elasticsearch, Logstash, and Kibana). Elasticsearch offers logging at scale, while Logstash provides log aggregation and analysis. Kibana delivers an elegant and meaningful way to visualize the analyzed reports.
Also included in the stack are Kafka, which provides buffering on large datasets, and Beats for capturing data.
Cloud Network Monitoring And Reporting Tools
Keeping a keen eye on your cloud network performance can help you identify bottlenecks and unusual traffic that could affect security, compliance, and costs. Here’s one solution you can use.
15. Network Monitoring: Paessler PRTG
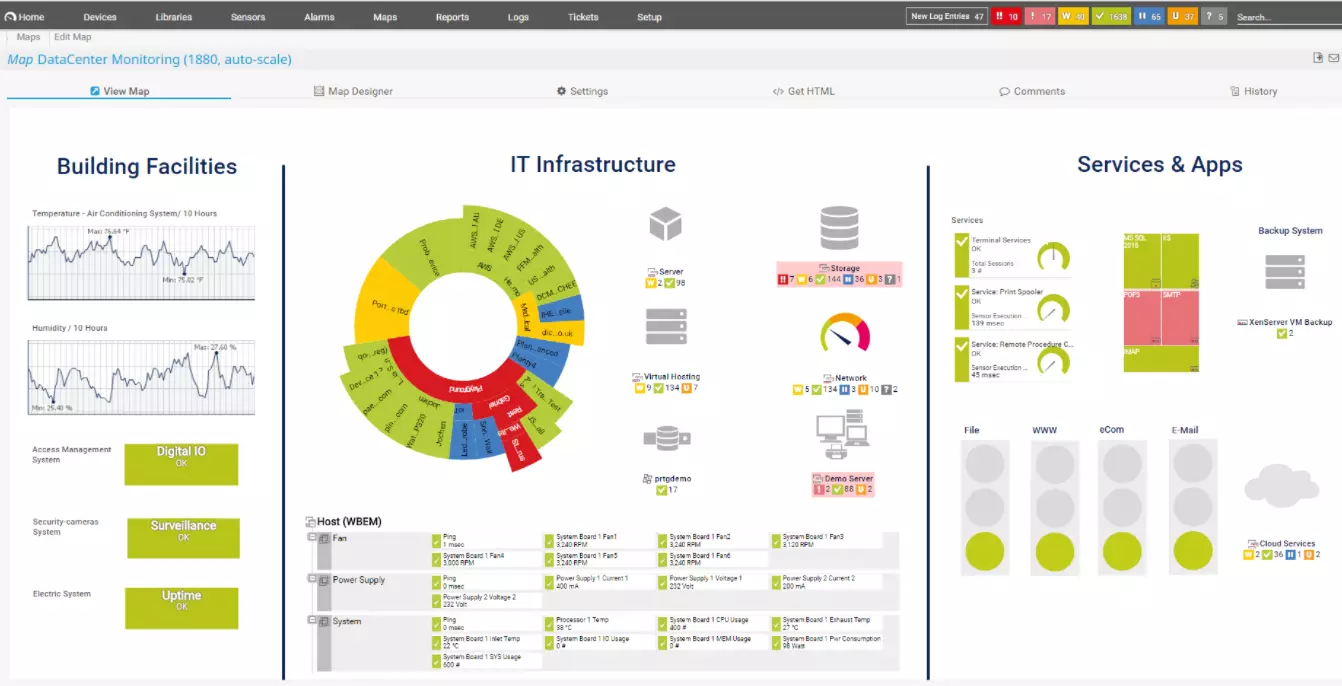
PRTG Network Monitoring visualizes your cloud network’s live status information with real-time maps. The reports will help you identify bottlenecks and how much bandwidth your applications and devices use.
You can also monitor the performance of many components of your Local Area Network via a single dashboard, including switches, workstations, servers, and routers. You can even receive notifications on your phone if you enable notifications in the Paessler Android or iOS apps.
Trade Traditional Cloud Reporting For Cloud Cost Intelligence
The cloud was supposed to save you money, streamline your workflows, and accelerate your growth. It was supposed to help you get meaningful data to make more profitable decisions continuously.
The problem is without a robust cost intelligence solution, you’ll struggle to make sense of the terabytes of data your cloud environment produces. For this reason, we designed CloudZero to speak your language — without endless tagging in AWS.
The CloudZero cloud cost intelligence platform enables engineers to see the cost impact of their activities so they can innovate without overspending. Think: cost per feature, cost per deployment, and cost per dev team.
Finance can easily translate cloud metrics into cloud investment insights, such as cost per customer and cost per project.
Leadership can analyze COGS and unit cost economics to make strategic decisions that increase competitiveness and profitability.
With Cloudzero’s cost anomaly alerts, and up-to-the-minute monitoring and reporting, your organization can innovate without fear of cost surprises.  to see why companies like Remitly, MalwareBytes, and Drift love CloudZero.


