Quick Answer
Grafana Cloud pricing in 2026 starts at $0 and scales with usage. The free tier includes 10,000 metrics series, 50 GB of logs, and 14-day retention. Pro adds a $19/month platform fee plus $6.50 per 1,000 billable series for metrics, $0.40 per GB to write logs (plus $0.05/GB processing and $0.10/GB monthly retention), and the same three-part rate for traces. Advanced plans start at $25,000/year. Amazon Managed Grafana charges $9/editor and $5/viewer per month. Most teams find their actual bill lands two to five times higher than their first estimate.
What Is Grafana Cloud?
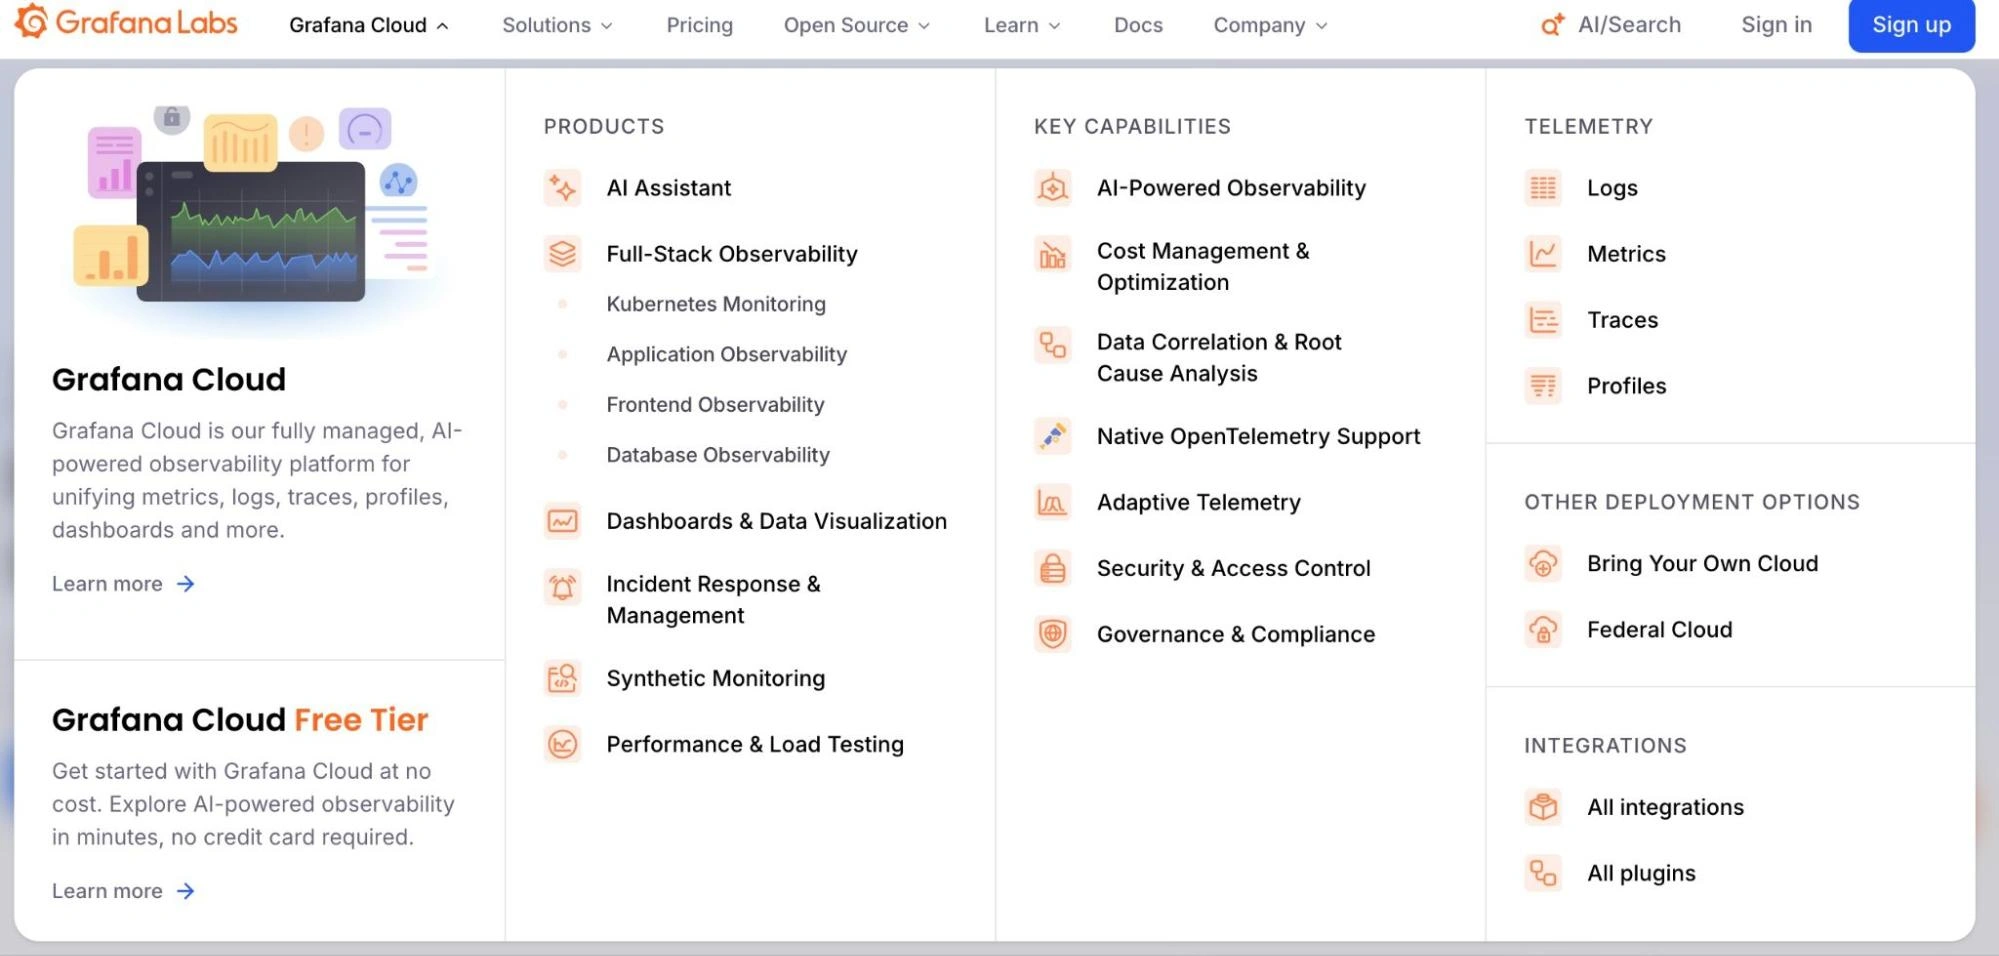
Grafana Cloud is a fully managed Grafana observability platform that collects, stores, and visualizes metrics, logs, and traces in one place. Built by Grafana Labs, it bundles four open-source backends (Mimir for metrics, Loki for logs, Tempo for traces, Pyroscope for profiling) behind the dashboard layer most engineers already know. Add k6 for load testing, IRM for incident response, and the recently launched Grafana Assistant AI, and you have a monitoring suite covering everything from Kubernetes pod health to frontend user sessions.
That breadth is the appeal and the cost risk. Each backend bills independently on its own usage meter, so what looks like one tool on the dashboard is seven or more line items on the invoice.
Understanding Grafana pricing means understanding each meter separately, which is roughly as fun as it sounds. Your total Grafana cost depends entirely on which combination of products you use and how much telemetry your infrastructure generates.
For teams comparing cloud monitoring tools and application monitoring tools, this complexity matters. Grafana Cloud adds another set of billing dimensions on top of your existing compute, storage, and AI inference costs. A cost intelligence platform like CloudZero aggregates every vendor into one view, so you’re not toggling between Grafana’s billing console, AWS Cost Explorer, and a spreadsheet at month-end.
The first pricing question most teams ask is the simplest one: can I use it for free?
Research Report
FinOps In The AI Era: A Critical Recalibration
What 475 executives told us about AI and cloud efficiency.
Is Grafana Cloud Free?
Yes. The Grafana Cloud free tier is genuinely useful, not a bait-and-switch demo.
Grafana Cloud Free includes 10,000 active metrics series, 50 GB of logs, 50 GB of traces, 50 GB of profiles, 500 VUh of k6 load testing, and three users, and no credit card required.
For personal projects, prototyping, and small development environments, that’s more than enough. For production monitoring, you hit two walls fast.
The 14-day retention limit means dashboards show only two weeks of history — not enough for trend analysis, capacity planning, or the kind of “what happened last quarter?” question your VP asks on Monday morning. The 10,000 series cap sounds generous until you point a default Prometheus exporter at a Kubernetes cluster and watch the series count blow past it before lunch.
Grafana OSS (the self-hosted open-source edition) is also completely free under an AGPLv3 license. You run it on your own infrastructure and pay nothing to Grafana Labs. But Sirius estimates that internal SRE labor for self-hosting the full LGTM stack easily exceeds $300,000 per FTE annually. For teams evaluating Grafana on premise pricing, “free” often turns out to be the most expensive option.
The Grafana Cloud free tier follows the same tiered pricing pattern as every cloud service provider: generous enough to get you building, limited enough that production workloads require payment. The question isn’t if you’ll upgrade. It’s when. And once you do, the billing model changes entirely.
How Does Grafana Cloud Pricing Work?
Once you outgrow the free tier, Grafana Cloud shifts to usage-based billing, metered independently across seven or more product dimensions. Each dimension has its own unit, its own rate card, and its own talent for surprising you on invoice day.
The core billing axes:
- Metrics — per 1,000 billable series (calculated via 95th percentile of active series and DPM)
- Logs — per GB processed, per GB written, and per GB retained monthly
- Traces — per GB processed, per GB written, and per GB retained monthly (same rate as logs)
- Profiles — per GB processed, per GB written, and per GB retained monthly (same rate as logs and traces)
- Visualization — per active user per month
- k6 — per virtual user hour (VUh)
- IRM, Synthetic Monitoring, Grafana Assistant — each on their own meter
Grafana recently introduced an alternative host-hour billing model alongside the traditional telemetry model. Under host-hours, the free tier includes 2,232 host hours and 37,944 container hours per month, with pay-as-you-go pricing after that.
A host is any OS instance sending observability signals, billed only for active minutes. Teams choose between host-based or telemetry-based billing — flexibility that’s welcome but adds another variable to cost forecasting.
This multi-meter structure mirrors how AWS prices compute, storage, and networking as separate dimensions. The challenge is identical: accurate cost forecasting requires totaling across all dimensions simultaneously. CloudZero handles this by ingesting billing data from AWS, GCP, Azure, Oracle Cloud, and 25+ SaaS platforms into a single normalized model. No spreadsheet reconciliation. No toggling between billing consoles at month-end.
With the billing model clear, the next step is mapping the specific Grafana Cloud plans and what each tier actually includes.
How Much Does Each Grafana Cloud Tier Cost?
Here are the Grafana pricing tiers:
|
Dimension |
Free |
Pro |
Enterprise |
|
Price |
$0, always free |
From $19/month + usage |
From $25,000/year spend commit |
|
Metrics |
10K active series |
$6.50/1K series (as low as $3/1K Enterprise) |
Volume-discounted, custom |
|
Logs |
50 GB ingested |
$0.05/GB process + $0.40/GB write + $0.10/GB retain |
Volume-discounted, custom |
|
Traces |
50 GB ingested |
$0.05/GB process + $0.40/GB write + $0.10/GB retain |
Volume-discounted, custom |
|
Profiles |
50 GB ingested |
$0.05/GB process + $0.40/GB write + $0.10/GB retain |
Volume-discounted, custom |
|
K8s Monitoring |
2,232 host hrs + 37,944 container hrs |
$0.01/host hr ($7.20/host) + $0.0007/container hr ($0.50/container) |
Volume-discounted, custom |
|
Retention |
14 days (metrics, logs, traces, profiles) |
13 months (metrics); 30 days (logs, traces, profiles) |
Custom |
|
Support |
Community |
8×5 email |
Premium |
|
Users |
3 included |
$8/active user/month |
Custom |
Note: Grafana Enterprise pricing is negotiable. Vendr data shows buyers save an average of 16% off list, and teams with annual prepayment or volume commitments commonly negotiate 10–20% discounts. Always ask.
For organizations managing spend across multiple tiers and vendors, CloudZero shows where each Grafana tier’s cost fits within total cloud and AI spend.
What Does Each Grafana Cloud Service Cost?
The tier table shows the structure. The per-service math below shows the invoice.
How much do Grafana Cloud metrics cost?
$6.50 per 1,000 billable series per month at low resolution and $16 per 1,000 at high resolution. Grafana bills on the 95th percentile, excluding the top 5% of usage spikes, which adds some buffer but doesn’t eliminate bill shock.
Cardinality — the number of unique time series generated by every combination of metric name and label values — is the word that makes finance teams nervous and engineers look away.
A Kubernetes cluster with 50 pods carrying labels for namespace, deployment, container, and pod_name generates 100,000 or more series from default Prometheus exporters. At $6.50 per 1,000 series, that’s $650 per month for one cluster — before custom metrics, before staging environments, before anyone adds an instance label.
This is the same exponential growth pattern that drives Databricks pricing complexity and Snowflake pricing surprises. The unit is cheap. The volume isn’t. CloudZero’s cost-per-customer attribution shows teams exactly which services and features drive cardinality growth, turning “our metrics bill spiked” into “deployment X added label Y, creating 40,000 new series owned by team Z.”
How much do Grafana Cloud logs cost?
$0.05 per GB to process, $0.40 per GB to write, and $0.10 per GB per month to retain. That three-part billing model charges you to receive the data, store it, and keep it, catching teams who only budgeted for ingestion.
A microservices stack generating 100 GB of logs per day costs $5 per day in processing plus $40 per day in writes ($1,350 per month) plus $300 per month in retention at the 30-day default. That’s $1,650 per month in logs alone — and because billing is per GB ingested (not queried), every debug-level log line your Java application produces at 3 a.m. goes straight to a paid backend that nobody reads.
The cheapest log line is the one you never ship. Grafana’s Adaptive Logs (Advanced tier only) identifies patterns worth dropping. For everyone else, the cost lever is log verbosity at the source.
How much do Grafana Cloud traces and profiles cost?
Grafana Cloud traces cost $0.05 per GB to process, $0.40 per GB to write, and $0.10 per GB per month to retain — the same rate structure as logs. Profiles follow the identical pricing model. Without sampling, a service handling 1,000 requests per second generates multiple GB of trace data per hour. Production deployments should implement 10–20% head-based sampling or tail-based sampling (error/high-latency traces only) to keep costs proportional to value.
What do Grafana k6, IRM, and other add-ons cost?
Grafana k6 Cloud pricing uses virtual user hours (VUh), with 500 included in the free tier and volume-discounted rates beyond. Grafana OnCall pricing (IRM) is included in Pro for base usage, with per-user charges for active IRM users beyond the allocation. Grafana Assistant (the AI feature, launched January 2026) bills per active user per month, independent from visualization pricing.
Seven-plus independent meters, each ticking on its own schedule. Forecasting total Grafana cost accurately is hard enough. Forecasting it alongside cloud compute, storage, databases, and AI inference costs is where most teams lose the thread. That’s the problem cost intelligence platforms exist to solve.
So what do real organizations actually end up paying?
How Much Does Grafana Cloud Really Cost Per Month?
Sticker pricing and real-world spend are distant cousins. Here is what organizations actually pay, drawn from verified buyer data and community estimates:
|
Team profile |
Metrics series |
Logs/month |
Users |
Estimated monthly cost |
|
Solo developer, side project |
Under 10K |
Under 50 GB |
1–3 |
$0 (free tier) |
|
Small startup, 5–15 engineers |
~50K series |
~200 GB |
15 |
~$499/month |
|
Mid-market, 50–200 |
100K–500K series |
500 GB–2 TB |
50–100 |
$3,000–$15,000/month |
|
Enterprise, 500+ engineers |
500K+ series |
2+ TB |
100+ |
$25,000+/year minimum |
|
Self-hosted (Grafana OSS) |
N/A |
N/A |
N/A |
$100K+ year 1 (infra + labor) |
Those real-world costs assume you’re buying Grafana Cloud directly. But if your infrastructure runs on AWS or Azure, managed options with different pricing models are also on the table.
How Does Amazon Managed Grafana Compare To Azure Managed Grafana And Grafana Cloud?
If your infrastructure runs on AWS or Azure, the managed Grafana options price differently and deliver something fundamentally different. Teams comparing AWS Grafana pricing or Azure managed Grafana pricing have three paths.
|
Dimension |
Grafana Cloud |
Amazon Managed Grafana |
Azure Managed Grafana |
|
What it is |
Full observability stack |
Visualization layer only |
Visualization layer only |
|
Pricing model |
Platform fee + usage |
Per-user/month per workspace |
Per-instance/hour + per-user |
|
Editor cost |
$8/user/month |
$9/editor/month |
Included in instance |
|
Viewer cost |
$8/user/month |
$5/viewer/month |
$6/user/month |
|
Instance cost |
Included |
Included |
$0.043/hr standard (~$31/month) |
|
Enterprise plugins |
$55/user/month |
$45/user/month |
Separate add-on |
|
Data backends |
Mimir, Loki, Tempo, Pyroscope |
None (BYOB) |
None (BYOB) |
|
Free option |
Generous free tier |
90-day trial, 5 users |
Essential tier (no SLA) |
The critical distinction that Amazon Managed Grafana pricing and Azure Managed Grafana pricing obscure: both are dashboards. Not observability stacks. They give you Grafana’s visualization layer on top of data sources you manage and pay for separately — CloudWatch, Amazon Managed Prometheus, Azure Monitor.
Grafana Cloud bundles the full LGTM backend.
A 20-editor team on Amazon Managed Grafana pricing pays $180/month for dashboards. But the underlying Prometheus, CloudWatch, and storage costs sit on different invoices. Your total Grafana Cloud cost for observability is fragmented across billing systems by design.
Why Is Grafana So Expensive?
Multiple Reddit threads rank for this question; “Grafana becoming costly,” “Grafana Cloud Cost Experience,” and so on. This tells you the frustration is real and the authoritative answers are thin.
Three structural forces drive the bill shock:
- Cardinality grows exponentially. Adding a second Kubernetes cluster doesn’t double your series count. It can quadruple it, because every new label value multiplies against every existing combination. Your metrics bill tracks cardinality, not infrastructure count, and cardinality has a gift for growing faster than anyone budgets for.
- Logs bill on ingestion, not value. Grafana Loki pricing charges $0.05/GB to process and $0.40/GB to write regardless of anyone actually querying the data. The gap between “data we produce” and “data we use” is where observability bills inflate. Most teams have never audited the ratio.
- Products compound across meters. Metrics, logs, traces, profiles, IRM, k6, Assistant: each product adds its own billing dimension. When seven products each cost “a little,” the total costs a lot.
This compounding pattern isn’t unique to Grafana. It’s the same dynamic behind OpenAI pricing complexity, Databricks compute-credit surprises, and Snowflake warehouse costs. Teams evaluating Grafana Cloud vs. Datadog or Prometheus vs. Grafana face similar cost unpredictability across all platforms, because the underlying challenge is structural: usage-based observability pricing rewards efficiency and punishes inattention. For teams exploring a Grafana alternative, whether it’s Datadog, New Relic, or a self-managed Prometheus-Thanos stack, the grass isn’t necessarily greener. The better path is controlling what you’re already spending.
The antidote is unified cost visibility that attributes spend to business outcomes, not just technical dimensions. That’s the “was it worth it?” question, and answering it starts with the optimization strategies below.
How Can You Reduce Grafana Cloud Costs?
Usage-based pricing means the most effective savings target usage, not the rate card.
- Audit active series. Run count({__name__=~”.+”}) in Prometheus/Mimir. Identify high-cardinality labels (pod_name, request_id, instance) on metrics where per-entity granularity adds no value. Dropping one label from one metric can eliminate thousands of billable series overnight.
- Pre-aggregate with recording rules. A Prometheus recording rule that computes average CPU by deployment stores one series instead of hundreds of per-pod series. Write less, pay less.
- Ship fewer logs. Set production log levels to WARN or ERROR for services that don’t need verbose output. Use structured logging so you can filter efficiently. Debug-level logging in production is the gift that keeps on billing.
- Sample traces. Head-based sampling at 10–20% captures enough for debugging while cutting trace volume 80–90%. Tail-based sampling (errors and high-latency only) is even more surgical.
- Negotiate. Vendr data shows buyers commonly save 10–20% through annual prepayment or volume commitments. Ask for the discount. The worst they say is no.
- Use Adaptive Metrics (if you’re on Advanced). Grafana’s Adaptive Metrics and Adaptive Logs features automatically aggregate unused telemetry, though accessing them requires the $25,000/year Advanced tier.
- Attribute costs to teams. When the team that owns a verbose microservice can see that their logging costs $2,000 per month, the pull request to reduce verbosity writes itself. This is the step most organizations skip — and the step that makes every other optimization stick.
That attribution step is where native Grafana billing ends and CloudZero begins.
How Does CloudZero Help You Manage Grafana And Total Observability Costs?
The fundamental mismatch in Grafana Cloud pricing, and observability billing generally, is that invoices speak in technical units (series, GB, spans) while business decisions speak in business units (customers, features, teams, ROI). Native billing tools give you the first. They cannot give you the second.
CloudZero resolves that mismatch. The platform maps every dollar of cloud, SaaS, and AI spend to the business dimensions where decisions actually happen, across every vendor in your stack including Grafana Cloud.
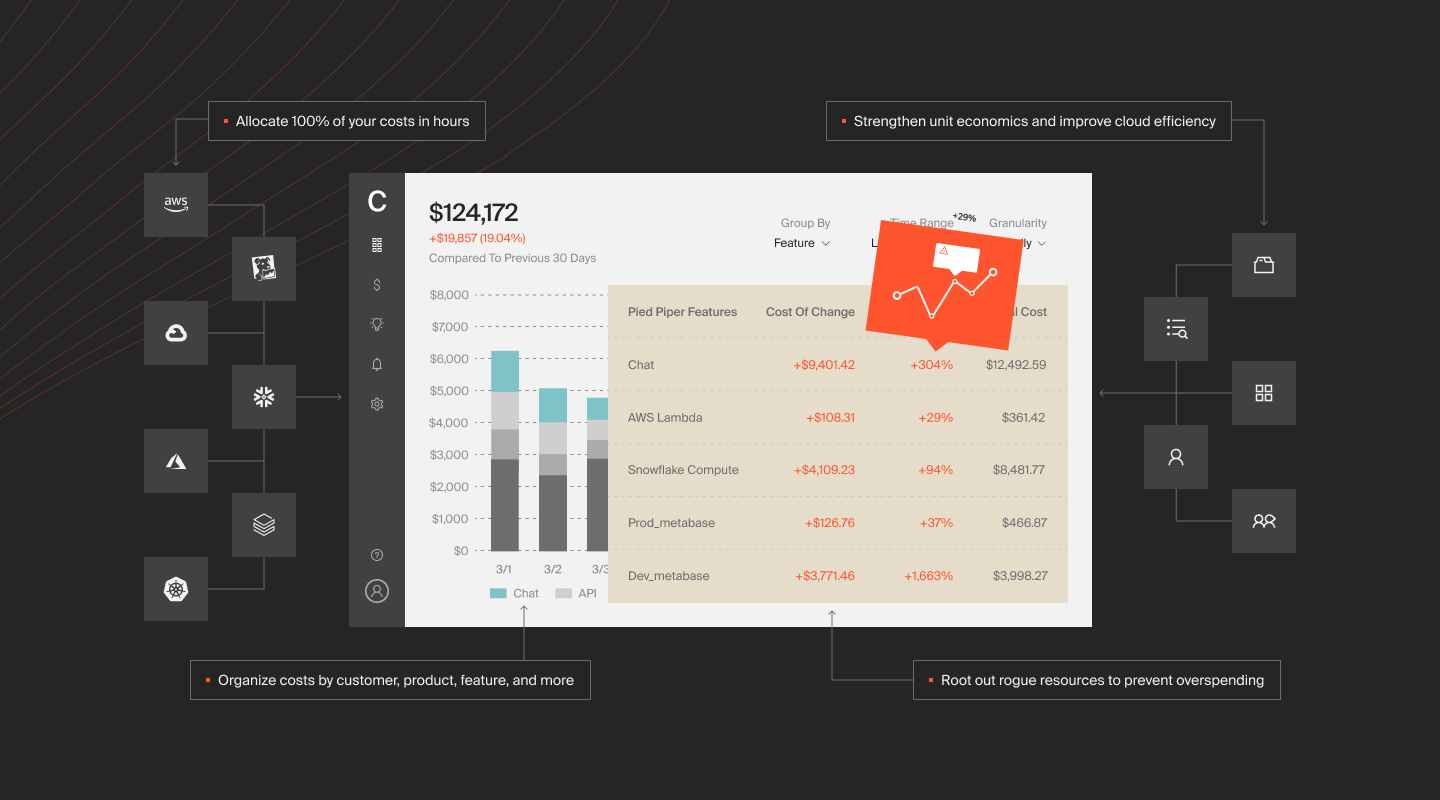
Cost per customer, per feature, per team. Instead of “$8,000 in Grafana metrics this month,” CloudZero shows which product generates the most observability overhead, which customer’s workload drives the most cardinality, and which team’s logging costs the most. Cost per customer isn’t a report. It’s an engineering feedback loop. When teams see the cost of their decisions attributed to the outcomes those decisions serve, optimization becomes self-directed.
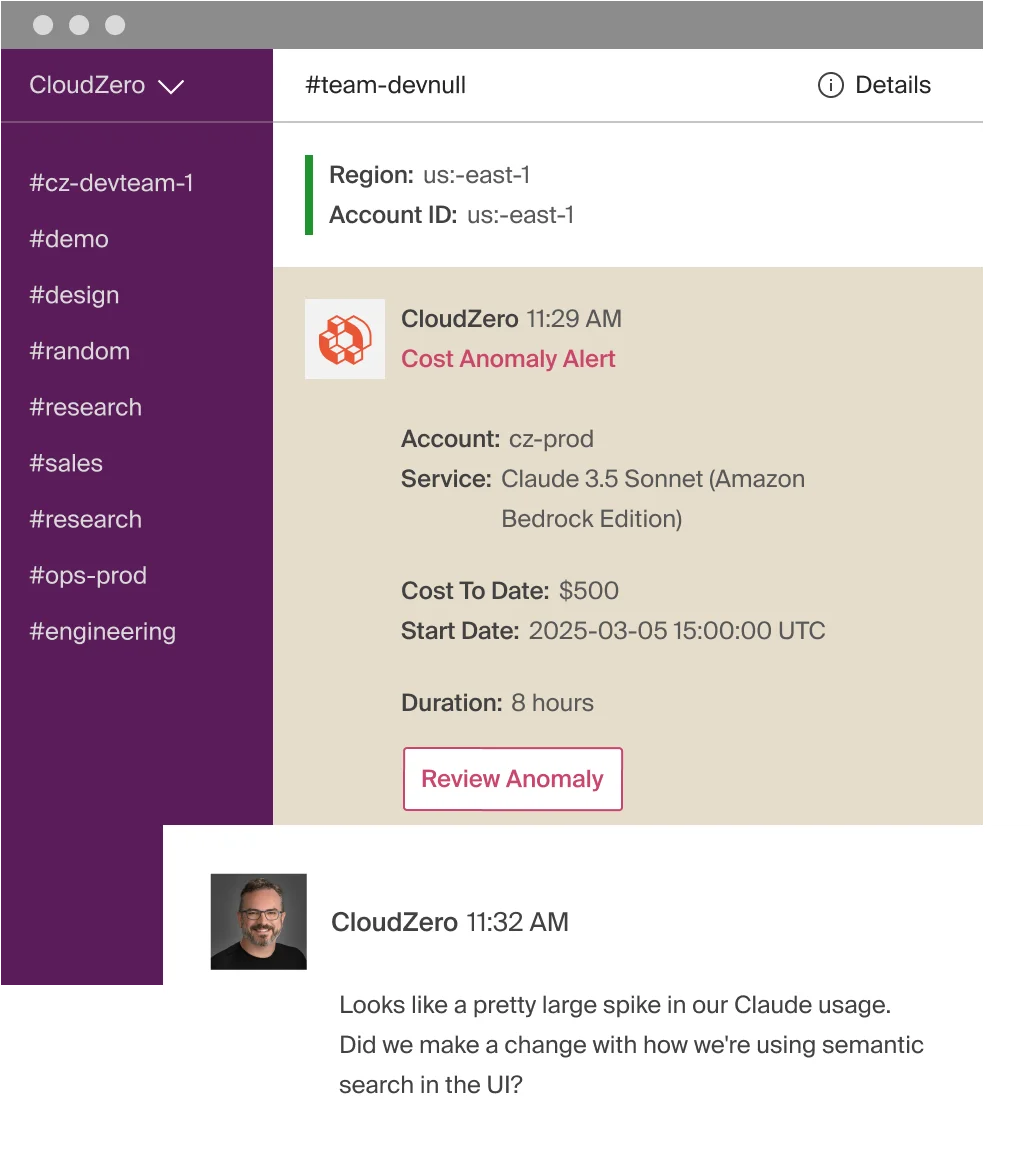
AI-powered anomaly detection. CloudZero compares hourly spend from the past 36 hours against 12 months of historical data, automatically establishing normalcy thresholds. When a deployment introduces a high-cardinality label and your Grafana bill spikes, the responsible engineer gets a Slack alert with root cause attribution before finance closes the books.
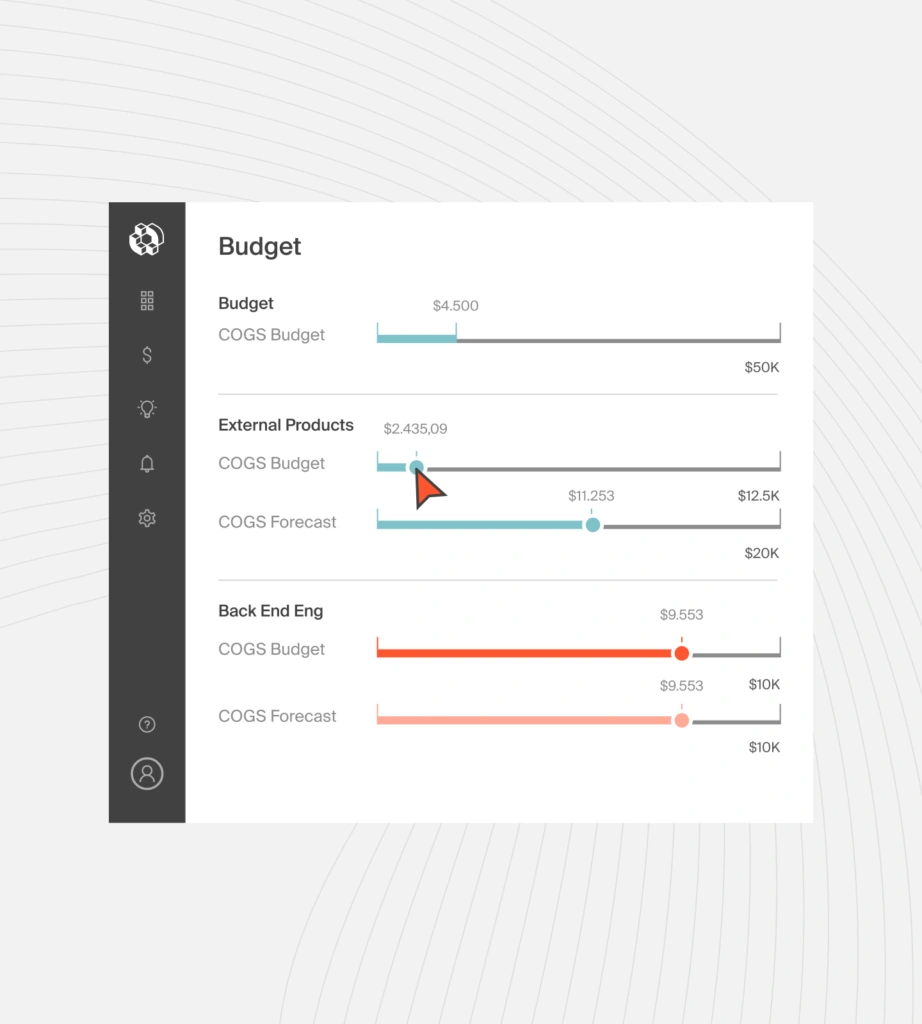
Budgeting across every vendor. Grafana costs compound with GPU cloud pricing for AI workloads, EKS pricing for Kubernetes, S3 pricing for storage, and AI inference costs that shift every time a model provider updates their rate card. CloudZero’s budgeting tools set guardrails across the total stack, not one vendor at a time. CloudZero’s own FinOps in the AI Era research found that about 50% of organizations investing in GenAI can’t confidently calculate ROI on their AI initiatives, and just 43% track AI spend by customer. That’s the measurement gap CloudZero closes.
The deepest integration ecosystem in cloud cost intelligence. CloudZero connects to Grafana, AWS, GCP, Azure, Oracle Cloud, Snowflake, Datadog, MongoDB, Anthropic, OpenAI, CoreWeave, and 25+ platforms. It was the first cloud cost platform to integrate directly with Anthropic’s Usage and Cost Admin API, and recently launched the CloudZero Claude Code Plugin, putting cost intelligence inside AI-native engineering workflows. The platform also connects natively with Oracle Cloud for GPU and high-performance compute visibility.
For teams running AI workloads alongside observability infrastructure, CloudZero answers the question no other platform can: “What does our AI cost, what does monitoring it cost, and is the total worth it?”
The proof is in the numbers. CloudZero manages $15 billion+ in cloud and AI spend across customers including Toyota, Duolingo, Skyscanner, and Coinbase. One customer saved $20 million through granular cost visibility. Another achieved six times greater engineering engagement with cost optimization by giving every team line-of-sight into their own spend. CloudZero also tracks more than 50 LLMs and helped one customer achieve more than $1 million in savings and a 50% compute reduction on AI workloads.
If Grafana is where you see your infrastructure, CloudZero is where you find out if it was worth it.
See the CloudZero Grafana integration or  to see Grafana, cloud, and AI costs mapped to customers, features, and teams. You can also get a free cloud cost assessment to benchmark your current spend or take a self-guided product tour to explore on your own.
Frequently Asked Questions About Grafana Cloud Pricing


FinOps In The AI Era: A Critical Recalibration
What 475 executives told us about AI and cloud efficiency.