
Cloud computing was already booming before 2020. But in the following two years, remote work flourished, and cloud adoption soared. The trend continues to accelerate — even faster now.
Some companies have since returned to the office. Others are adopting hybrid models, balancing work-from-home and in-office.
Yet, there’s more to the rise of cloud computing than remote working.
For example, cloud infrastructure also supports big data analytics, Artificial Intelligence (AI), Machine Learning (ML) models, the Internet of Things (IoT), and advanced Business Intelligence (BI). So, we compiled the following remarkable cloud computing statistics from reliable sources to help keep you up to date.
We’ve also included tips, tricks, and tools to make cloud computing less of a hassle. That includes practical advice on how to manage and optimize cloud costs across AWS, Azure, GCP, Kubernetes, and Snowflake within a single platform.
Related read: The 15+ Best Cloud Cost Management Tools
Also: If you came here looking for cloud cost trends or cloud spend data and how it’s changing from month to month, check out our monthly Cloud Economics Pulse which updates on the second Tuesday of every month.
Top Picks
- Globally, the cloud computing market will surpass $1 trillion by 2028. (Precedence Research)
- The global cloud computing market hit $912.77 billion in 2025, up from $156.4 billion in 2020. (Source: Precedence Research)
- Over 20% of organizations say they have little to no idea how much different aspects of their business cost in relation to the cloud. (CloudZero, The State of Cloud Cost in 2024)
- A cloud bill can comprise hundreds of millions or billions of rows of data. (FinOps Certification)
- An Amazon Cost and Usage Report is too large to load into Excel at once. Instead, Amazon splits its monthly CUR into many separate files. Good luck understanding them. (FinOps Certification)
- 97% of enterprise cloud apps are unsanctioned because departments, teams, or employees purchase new tools to support their productivity efforts. (Osterman Research)
- Modernizing and integrating apps with public cloud services is a top priority in the next three years. (VMware)
- You can reduce your Total Cost of Ownership (TCO) by as much as 40% by migrating your business to the public cloud. (Accenture)
- 80% of organizations use multiple public or private clouds. (Virtana)
- The world creates 2.5 quintillion bytes of data every day. (Osterman Research)
- Fun Fact: A “FinOps Hug” is a state of harmony between finance and engineering teams.
Let’s dive right into it, shall we?

Cloud Adoption Stats: How Many Companies Use Cloud Computing?
Most organizations, particularly enterprises, have at least some of their workloads in the cloud.
More than 90% of organizations use the cloud (Source: O’Reilly)
O’Reilly’s latest Cloud Adoption report had some interesting numbers. Consider this:
- About two-thirds of respondents currently operate in a public cloud, and 45% use a private cloud, versus 55% who still rely on traditionally managed on-premises systems.
- 48% plan to migrate at least half of their applications to the cloud in the next year; 20% intend to move all their applications to the cloud.
- 47% are pursuing a cloud-first strategy, 30% are already cloud-native, and 37% intend to become cloud-native in about three years.
- Only 5% plan on switching from the cloud to on-premises infrastructure (cloud repatriation).
60% of organizations are running over half of their workloads in the cloud (Source: Fortinet)
This marks a steady climb from 39% in 2022. Cloud-first and hybrid strategies continue to grow as businesses move more core operations to cloud infrastructure.
Cloud adoption among enterprise organizations is over 94% (Source: RightScale)
More than 94% of organizations with over 1,000 employees have a significant portion of their workloads in the cloud, according to a survey of 800 organizations. The latest edition shows enterprise cloud computing continues to grow rapidly — and then some. For example:
- More enterprises are exploring a multi-cloud or hybrid cloud approach rather than just using a public or private cloud strategy. More on this later.
- 54% will move their workloads to the public cloud in the next 12 months.
There’s more.
Organizations with 1,000 or fewer staff invest big in the cloud (Source: TechRepublic)
About 44% of traditional small businesses use cloud infrastructure or hosting services. That’s compared to 66% of small tech companies and 74% of enterprises.
There is one more thing. The public cloud will host 63% of SMB workloads and 62% of SMB data within the next year.
The U.S. and Western Europe still dominate cloud computing (Source: ReportLinker)
Combined, these two regions account for 82% of the world’s cloud computing. This chart shows cloud adoption by country and region according to Gartner:
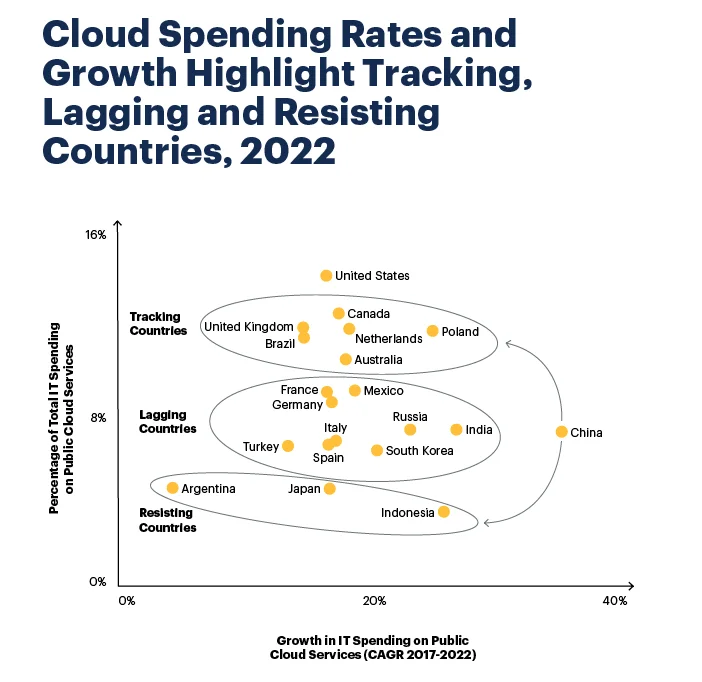
Credit: Gartner 2022
40% of organizations in developing regions are currently evaluating and planning cloud strategies (Oracle and IDC)
The cloud computing industry is not just booming in developed economies. According to new Oracle findings, cloud computing is rapidly developing in Sub-Saharan Africa (SSA) as well as in Central and Eastern Europe (CEE).
Currently, 30% of respondents report using the cloud. Among companies with more than 2,500 employees, half are planning or evaluating cloud strategies as are 41% of those with 1,000 to 2,500 employees.
Cloud Computing is becoming more popular across lines of business teams (Oracle and IDC)
Lines of business (LoBs) are even more involved (40%) than IT (38%). That’s a good thing. Both units are leveraging the cloud’s power in different areas of their organizations more than they used to.
Why Are Companies Adopting Cloud Computing So Fast?
Organizations are moving to the cloud for a variety of compelling reasons. Cloud computing offers several powerful benefits, including:
Cloud computing boosts gross margins and profitability (Source: Wipro FullStride)
In its global survey of 1,300 C-Suite executives, Wipro FullStride Cloud Services showed that a well-executed move to digital increased revenue and profitability.
While SaaS companies reported the highest margins, others also enjoyed notable gains. As an example, finance executives reported revenue increases of up to 15% and profitability increases of up to 4%.
Another survey by Deloitte showed small and medium businesses that used cloud computing made 21% more profit and grew 26% faster.
Cloud computing generates more revenue (Source: Infosys)
The survey also noted that migrating to the cloud helps unlock additional revenue streams that can boost profit growth by as much as 11.2% year-over-year.
Here’s the kicker. The survey concluded that your organization needs at least 60% of its workload in the cloud to realize noteworthy financial gains.
Achieve faster time to market (Source: IBM)
Some 65% of respondents who identified as “Optimizers” told IBM that cloud computing helped them reduce time to market. Check this out:
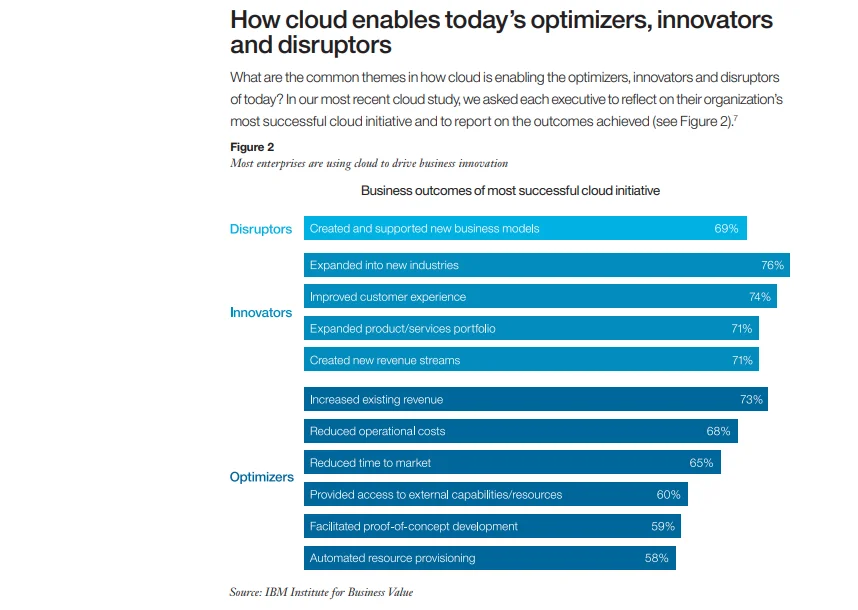
Credit: IBM’s Beyond Agility – How Cloud is Driving Enterprise Innovation Report
Reduce startup costs (Source: OpsRamp)
Cloud computing reduces upfront startup costs, including setup and maintenance costs.
- 94% of IT professionals in an OpsRamp survey said it is true for them.
- Accenture also found that moving workloads to the public cloud leads to Total Cost of Ownership (TCO) savings of 30-40%.
Also, operating in the cloud converts your Capital Expenditure (CapEx) to Operating Expenditure (OpEx), freeing more resources to fund your operations and growth.
6 in 10 CxOs say cloud computing improves security (Source: Oracle)
Security is the top benefit of cloud computing, according to 60% of C-Suite executives — ahead of cost savings, scalability, ease of maintenance, and speed.
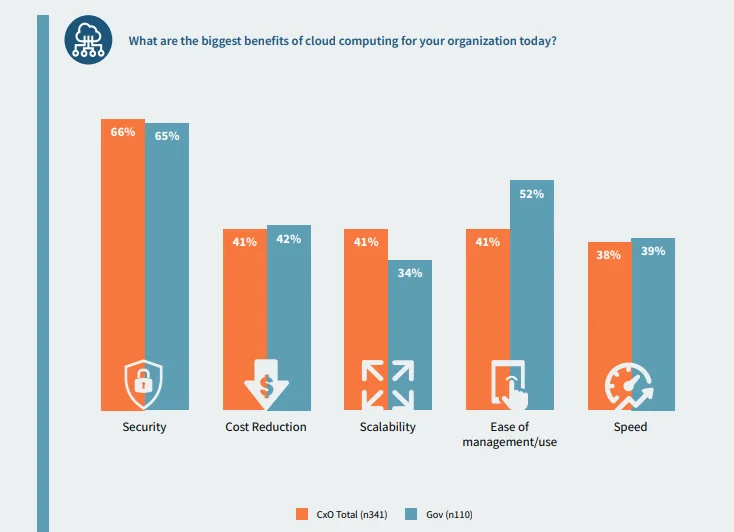
Credit: Oracle’s Security in the Age of AI Report
It makes sense, considering they also cited human error as the most significant threat to security. The cloud supports automation, which reduces the risk of human errors that can lead to security breaches.
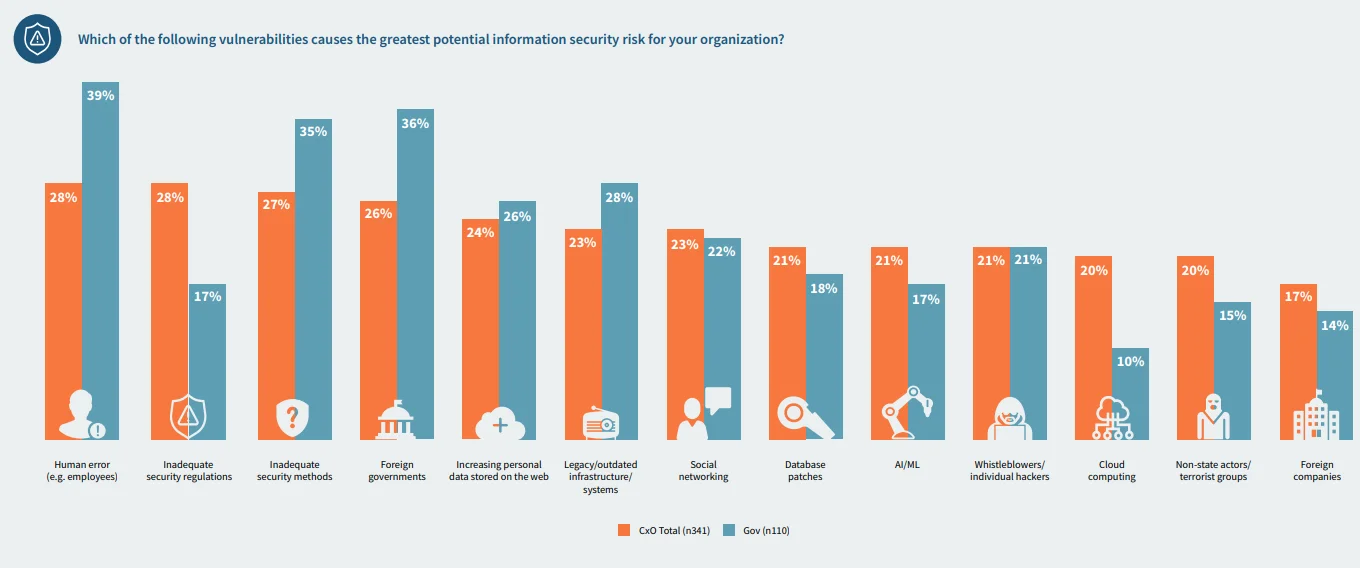
Credit: Oracle
Moving to the cloud improves business resilience (Source: Aberdeen)
Cloud-based solutions support best practices for business resilience, such as remote working, pivoting to a new business model, and disaster recovery.
For example, Aberdeen found that cloud-based businesses could resolve disaster recovery issues in just 2.1 hours, as opposed to 8 hours for businesses that didn’t use cloud services.
The cloud boosts flexibility (Source: OpsRamp)
Out of 137 IT executives surveyed, 115 said they planned to migrate more workloads to the cloud in the next 24 months.
- 62% said they’ll do so for more flexibility and scalability.
- 47% cited wanting more cost control, using elastic resource provisioning.
Migrating to the cloud reduces carbon emissions by 84% (Source: Accenture)
According to Accenture, organizations with consistently high environmental, social, and governance (ESG) scores had 4.7 times larger operating margins compared to low ESG performers between 2013 and 2019.
By moving to Infrastructure-as-a-Service (IaaS), eco-friendly brands can reduce carbon emissions by up to 84% and energy consumption by up to 64%.
Accenture made this chart to compare carbon emissions between cloud and on-premises operations:
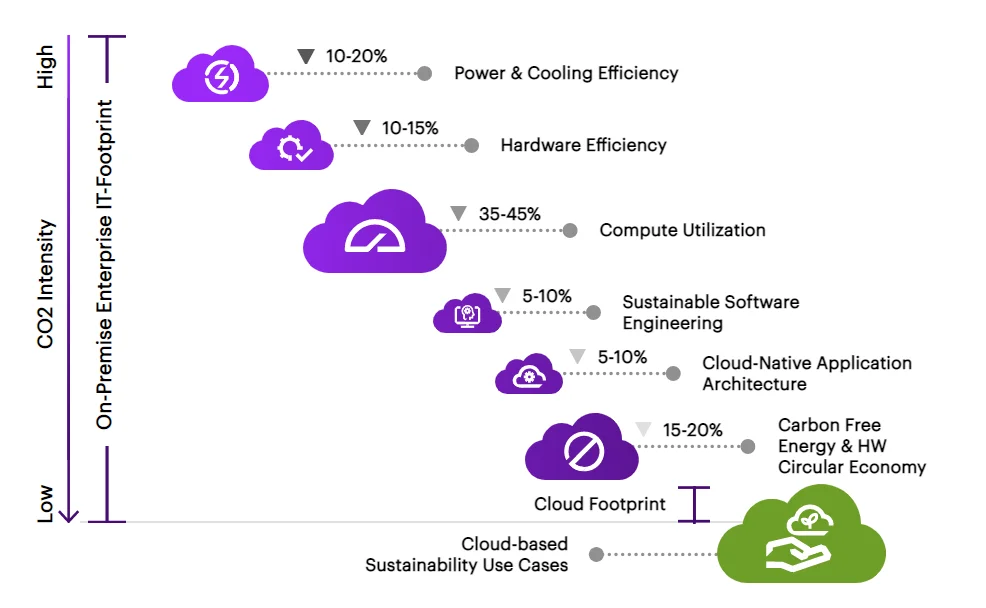
Credit: Accenture
Cloud Spending Statistics
All sizes of organizations are making significant investments in cloud computing to take advantage of its benefits. You can see what that looks like here:
SMBs’ tech budgets for cloud services to surpass 50% in 2025 (Source: McCary Group)
Small and medium-sized businesses (SMBs) are projected to allocate more than half of their technology budgets to cloud services in 2025. This reflects a major shift towards cloud adoption.
Global public cloud spending to reach $723.4 billion in 2025 (Source: Gartner)
End-user spending on public cloud services worldwide is forecasted to total $723.4 billion in 2025. This is up from $595.7 billion in 2024, and is driven by the increasing adoption of AI and hybrid cloud strategies.
33% of organizations are spending over $12 million annually on public cloud services in 2025 (Source: Flexera)
This marks an increase from 29% in 2024, reflecting the growing investment in cloud infrastructure. The surge is largely driven by the adoption of AI technologies, with 72% of organizations now utilizing generative AI services.
54% of SMBs spend more than $1.2 million on the cloud (Source: RightScale)
RightScales’s findings also show a noteworthy increase in SMBs that spend more than $1.2 million annually, compared to 38% two years ago.
Also, IDC predicts SMBs will increase their cloud spend by 31% to support further adoption.
Cloud costs are higher than expected for 6 in 10 organizations (Source: CloudZero)
As companies invest more in the cloud, only 4 in 10 organizations have their cloud costs where they expect.
Some 490 out of 1,000 respondents said their cloud costs were a little higher than they should be, while 110 reported that cloud costs were way too high.
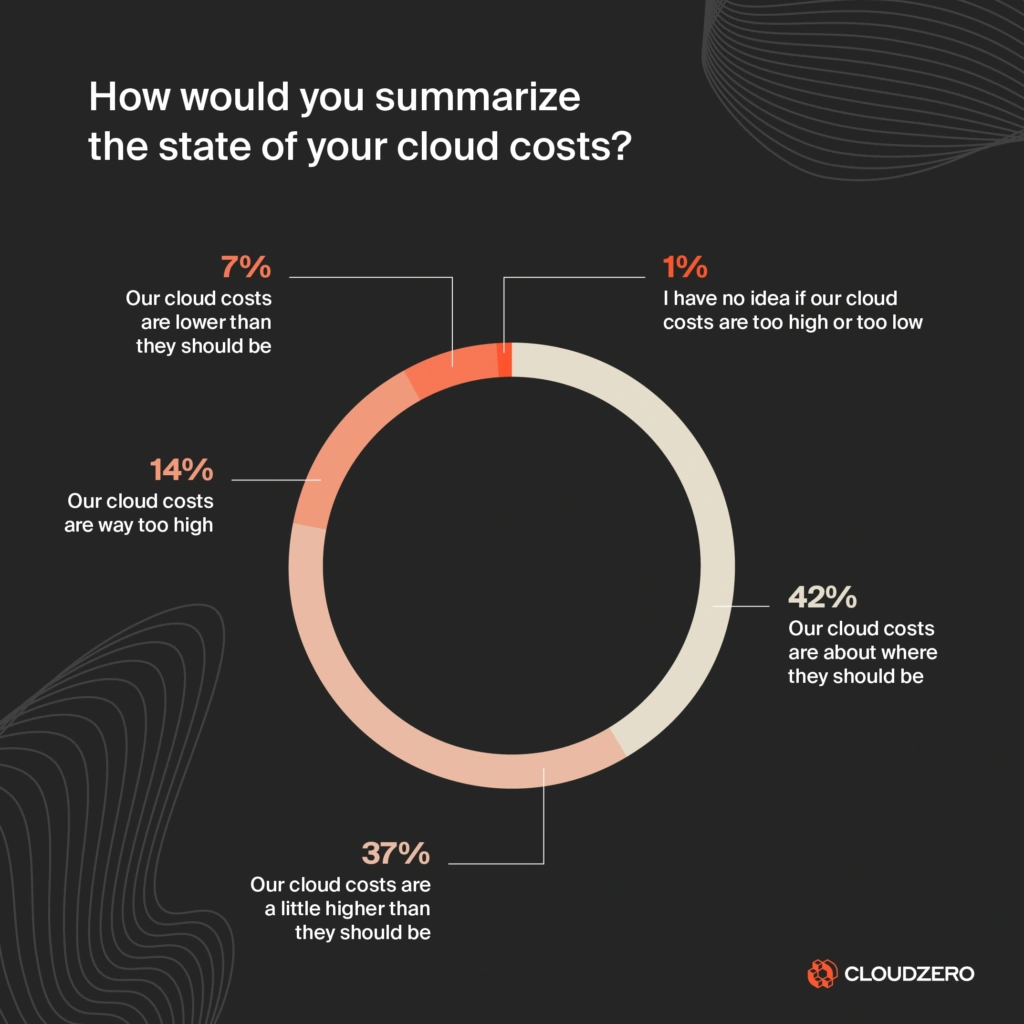
Credit: CloudZero’s 2024 State of Cloud Cost Intelligence Report
71% of organizations expect their cloud spend to increase (Source: Flexera)
Some 58% of all respondents in the survey of 501 IT executives worldwide expect a slight increase in cloud spending. Some 13% of them expect a significant increase. Compare that to just 2% who expect a significant decrease and 10% who expect a slight decrease in their cloud spend.

Credit: 2022 Tech Spend Pulse
58.7% of IT spending is still traditional, but cloud-based spending will soon outpace it (Source: Gartner)
According to Gartner, traditional IT spending still dominates cloud spending. However, its 2019-2025 forecast predicts cloud-based spending will continue to grow while traditional IUT spending will continue to shrink, eventually falling behind cloud spend from 2025.
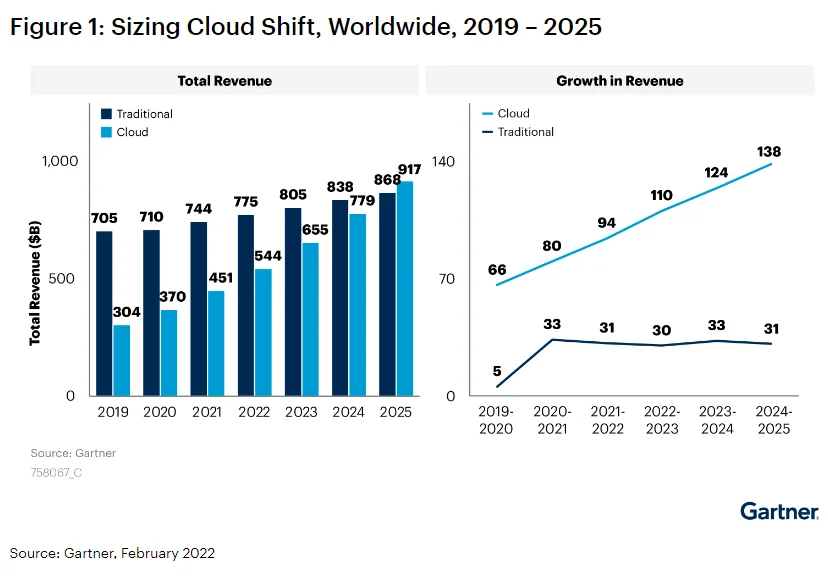
Credit: Gartner forecast on cloud spending growth vs traditional IT spending until 2025
But is all this spending really worth it? What kind of returns are companies getting from their cloud investments?
World Wide Waste: Cloud Waste Is A Big Problem
Cloud waste is shockingly prevalent today:
32% of a cloud budget went to waste (Source: Flexera)
Cloud waste averaged 30% of companies’ cloud budgets in 2021, according to Flexera. In 2022, that figure jumped to 32%. Considering Gartner’s estimation that cloud spend reached nearly $500 billion in 2022, that 2% increase might represent a massive amount of wasted cloud spend.
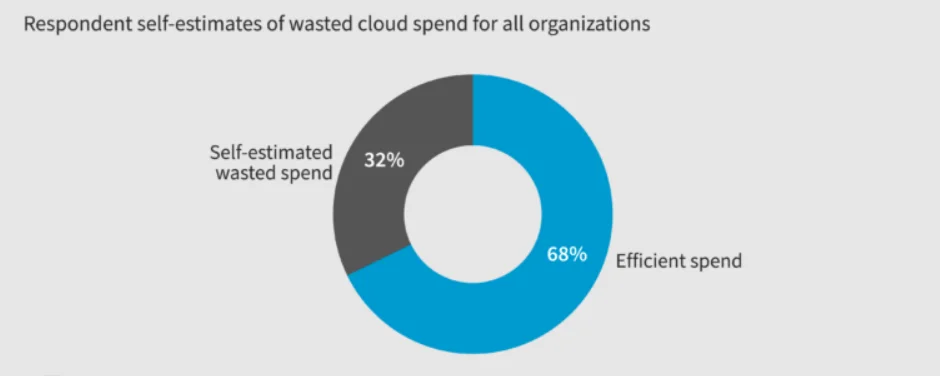
Credit: Wasted cloud spend, State of the Cloud Report by Flexera
75% of organizations report an increase in cloud waste (Source: StormForge)
Most companies reported that as their cloud spend increased, so did their cloud waste. The StormForge survey of 131 IT professionals shows cloud waste could be as high as 47% of a cloud budget.
49% of cloud-based businesses struggle to control cloud costs (Source: Anodot)
There’s more:
- In 54% of cases, cloud waste stems from a lack of visibility into cloud costs.
- According to 44% of executives, at least a third of their cloud spend is wasted.
- Complex cloud pricing is a challenge for 50% of respondents.
- Nearly half of respondents said managing multi-cloud environments is challenging.
These challenges make controlling cloud costs even more difficult.
42% of CIOs and CTOs say cloud waste is their biggest challenge in 2025 (Source: Zesty)
Overprovisioning and poor scalability still drive cloud waste. 58% also struggle to match the right cloud services to their workloads, making cost control even harder.
Over half of enterprises are struggling to see cloud ROI (Source: PwC)
About 53% of enterprises had yet to see “substantial value” from their investment in the cloud.
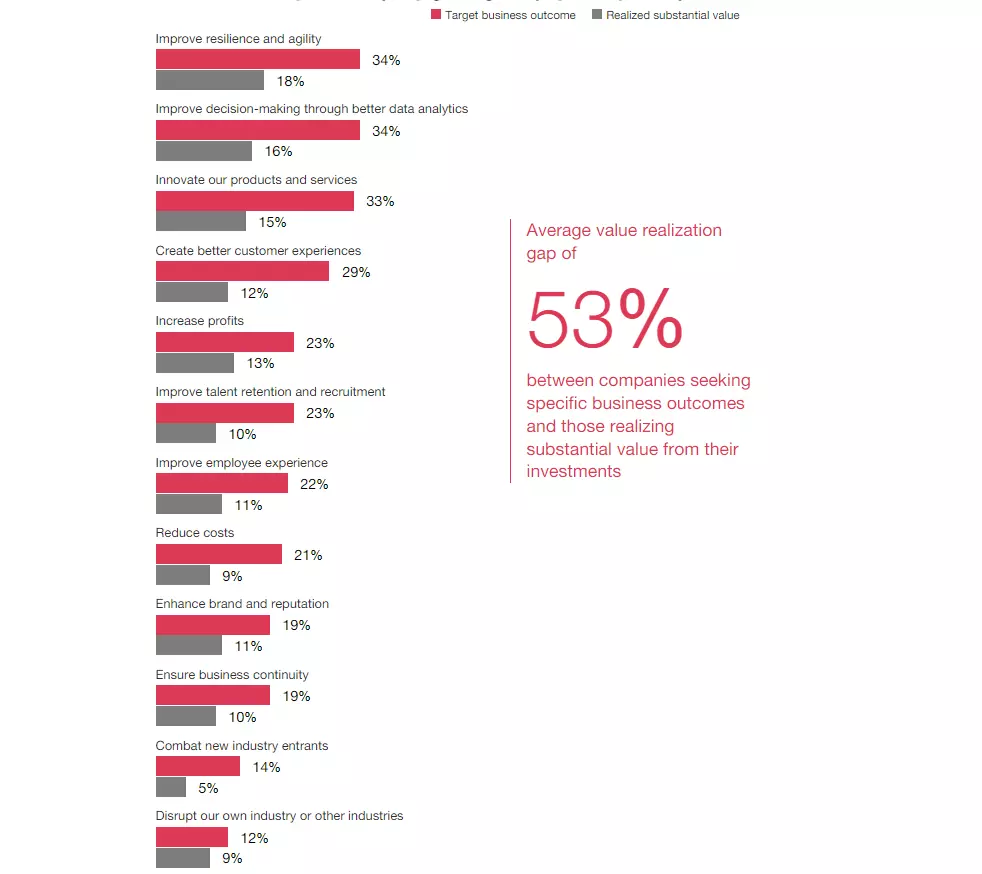
Credit: How much value do companies see from cloud investments? – PwC research
This is true for many organizations — and it can be aggravating for companies that moved to the cloud for cost savings.
1-3 years is the average payback period for cloud investment (Source: McKinsey)
Firms like McKinsey show that companies might not see cloud benefits immediately. Instead, they can expect to gain significant benefits within 1-3 years of implementing cloud computing best practices.
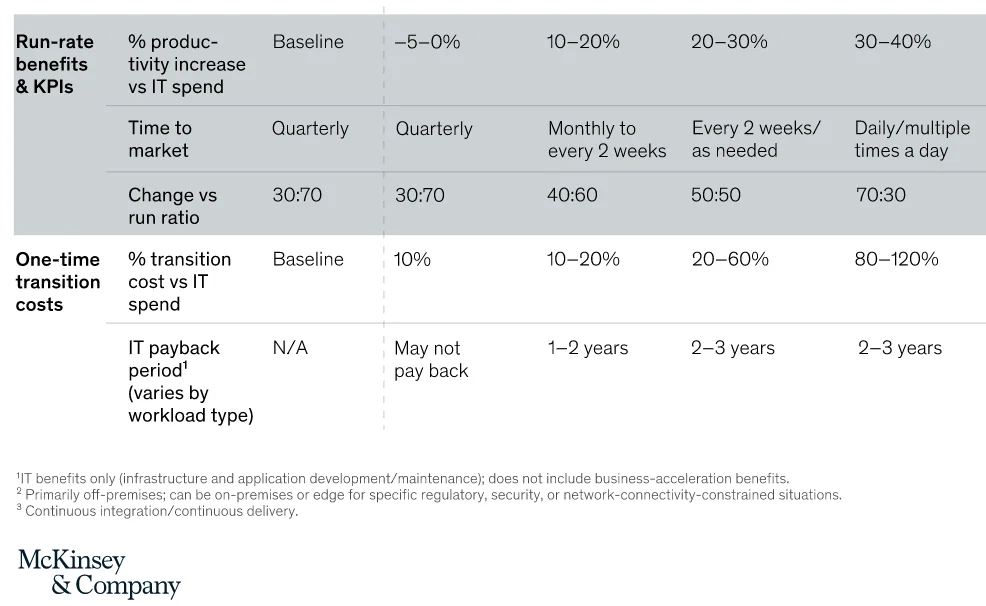
Credit: McKinsey’s
Cloud Cost Optimization Statistics
With cloud spend wastage on the rise, many companies are seeking to reduce and optimize cloud costs to maximize their returns. The following revelations are mind-blowing:
7 out of 10 companies aren’t sure what they spend their cloud budget on (Source: CloudZero)
The 2024 State Of Cloud Cost Intelligence Report shows that only 30% of surveyed organizations knew where their cloud budget was going exactly — a truly grim picture of cost attribution in the cloud.
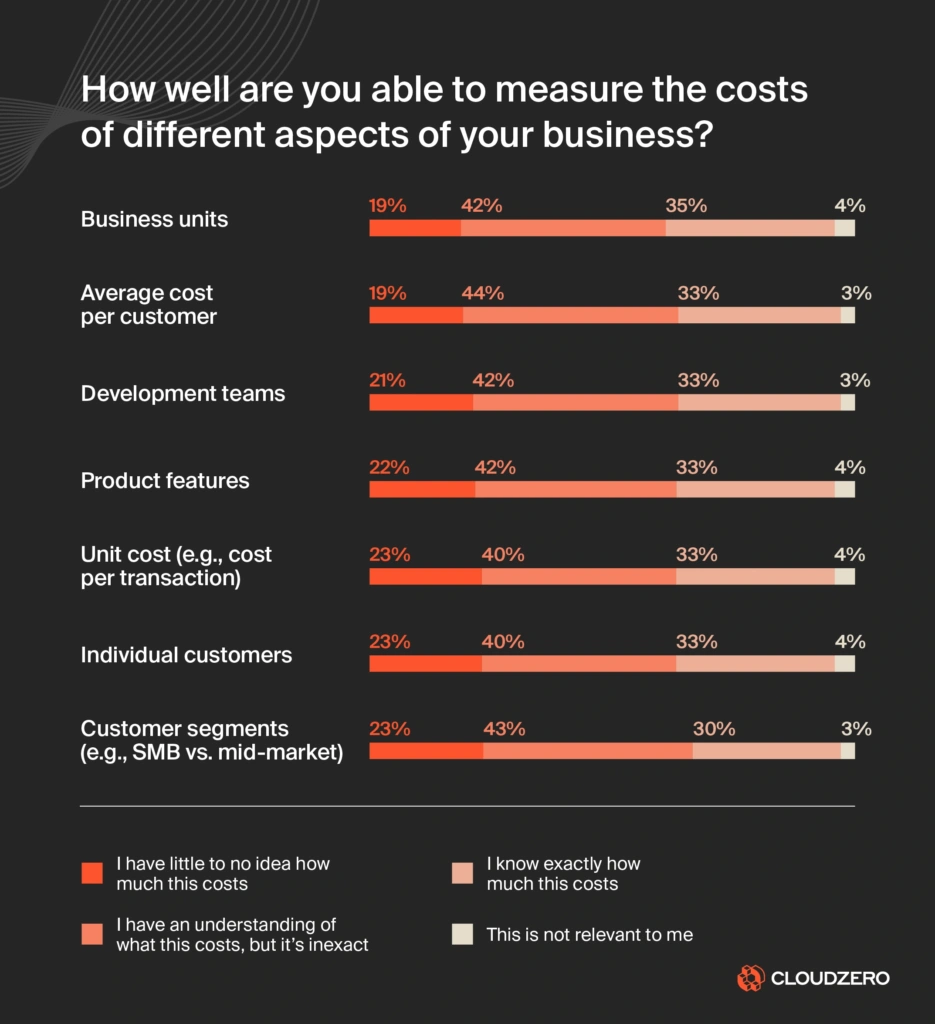
This means that most companies struggle to allocate cloud costs accurately because they are unsure what, why, and who drives their cloud costs.
Also, the larger the company, the bigger the cost visibility problem was:
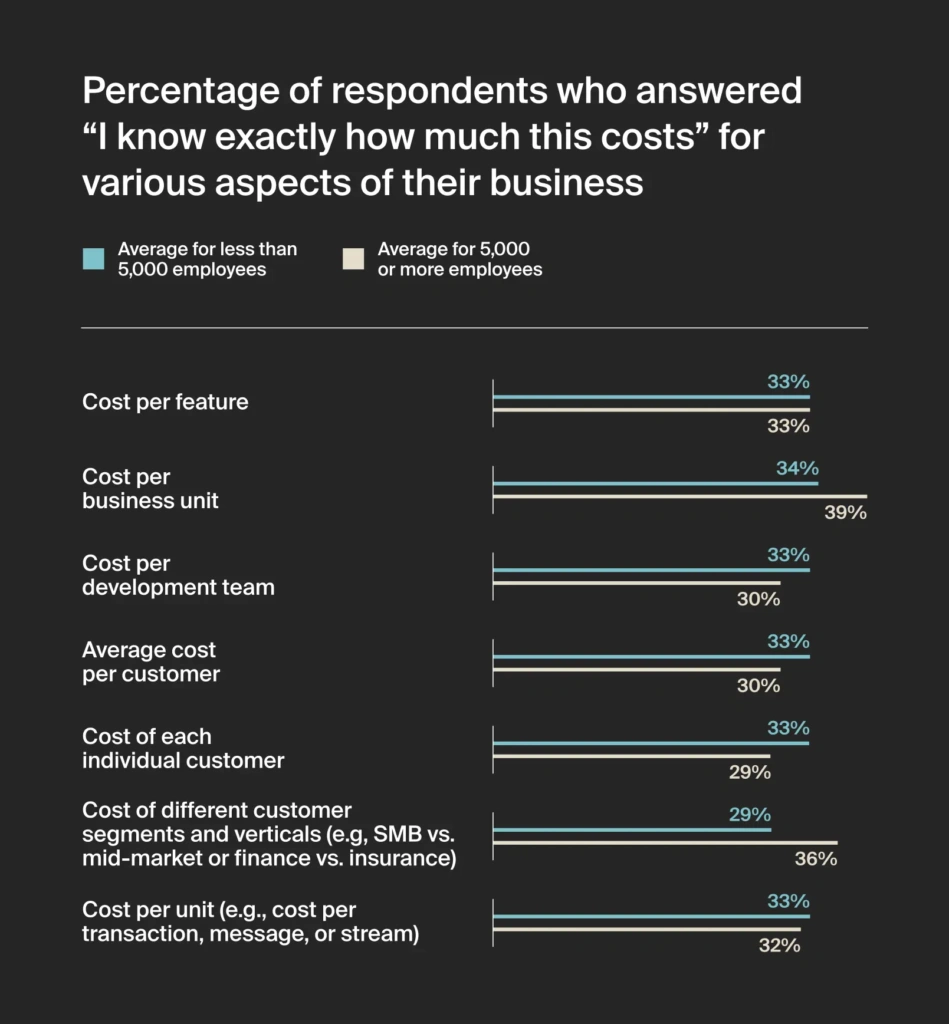
Compared to smaller organizations, larger organizations often have less understanding of exactly how much they spend on various business aspects.
The challenge highlights the need to adopt a robust cloud cost optimization solution like CloudZero. CloudZero’s cloud cost intelligence approach breaks down complex cloud bills into unit costs that you actually care about and can understand. It then presents that data to you as:
- Cost per customer
- Cost per software or product feature
- Cost per team
- Cost per environment
- Cost per engineering project
- Cost per deployment, and more
The result: CloudZero empowers you to identify what drives your costs and connect your cloud costs to your business goals. That means CloudZero helps you pinpoint where to reduce usage or increase investment to cut costs or increase ROI, respectively.
 to see CloudZero in action.
78% noticed cloud cost variance late (Source: CloudZero)
Only 22% of respondents said they were unable to detect cloud cost anomalies instantly or within minutes. Some 8% of respondents said they noticed cost anomalies after a week or more, 14% after days, and 56% in hours.
Only 23% see less than 5% cloud cost variance (Source: CloudZero)
In terms of how much cloud cost variance organizations are seeing, CloudZero found:
- 60 out of 1,000 respondents experienced more than 30% variance.
- About 230 saw cloud costs variance of between 15-29%.
- More than 480 saw cost anomalies that ranged between 55 and 14%.
Check this out:
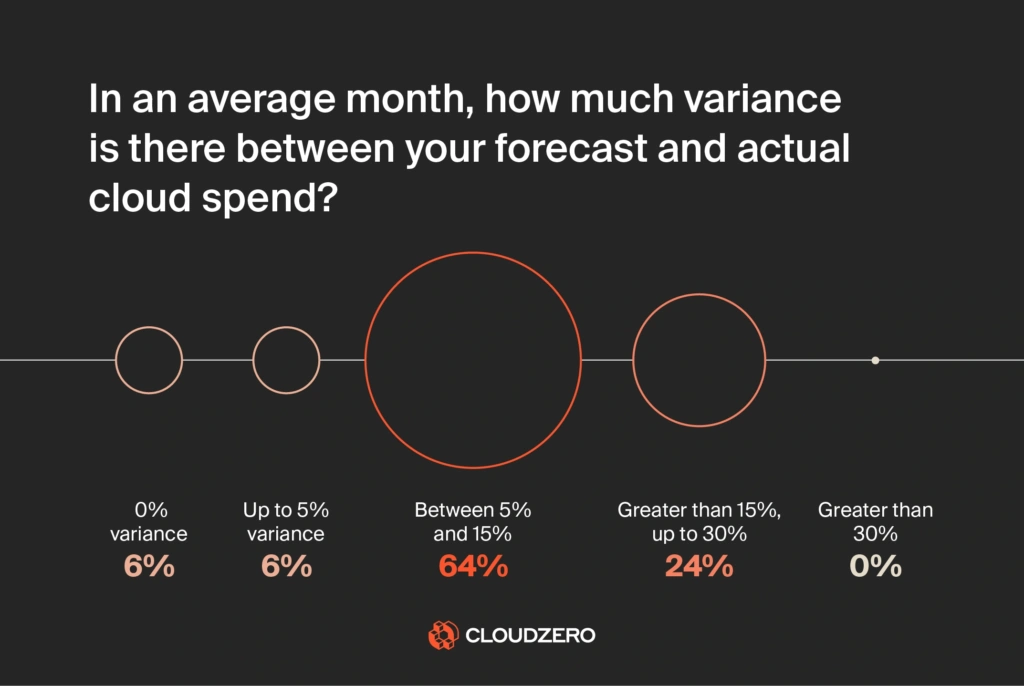
Credit: Cloud cost variance among respondents
49% of business leaders cite measuring value as a major barrier to achieving cloud ROI (Source: PwC)
In addition, 48% of CFOs lack confidence in their ability to measure cloud ROI.
We see this as yet another cloud cost visibility issue because once you understand how you’re spending your cloud budget, it’s much easier to determine whether your investment is paying off.
For example, you can identify which processes, teams, or products consume the most cloud resources, analyze each one’s return on investment, and cut their spending in favor of the best performers.
24% measure cloud value in terms of faster innovation and delivery (Source: PwC)
Some 126 out of 524 technology leaders at Fortune 1000 companies told PwC that faster innovation and faster service/product delivery was the top way they measured the value of the cloud — followed by improved operational resiliency.
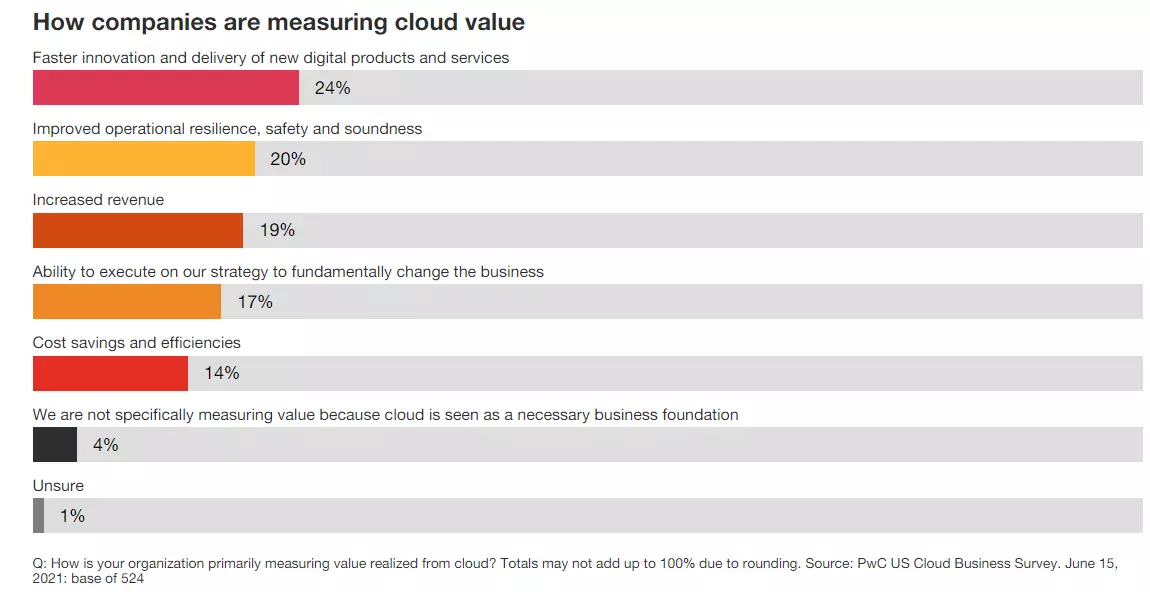
Credit: PwC Cloud Business Survey
59% use 3+ tools to manage and optimize their cloud (Source: Anodot)
This makes it tough to collect, analyze, and understand cloud resource usage with accuracy, let alone optimize utilization. Add to that the adoption of complex cloud-native technologies, such as containers, Kubernetes, and microservices, and tracking costs becomes even more complicated.
67% of CIOs say cloud cost optimization is a top IT priority in 2025 (Source: Splunk, BCG)
More leaders are tightening cloud budgets this year. One-third say cost control is their most critical focus, up eight points from 2024. FinOps practices are also on the rise.
Statistics On Cloud Service Providers
The cloud computing market continues to attract more players and shift market share among them.
AWS led the cloud market with 32% share in 2024 (Source: Synergy Research Group)
AWS remains the top provider. Azure follows at 23%, and Google Cloud holds 12%.
Salesforce and Adobe are the most valuable SaaS companies today (Source: Mike Sonders)
Salesforce invented the modern SaaS model about 25 years ago and provides some of the best SaaS tools for businesses today.
Salesforce currently holds a $231.4B market cap. Adobe follows at $148.8B. While tech giants like Microsoft lead in SaaS revenue, Salesforce remains the top dedicated SaaS provider by valuation.

Diverse players are great at different offerings (Source: Synergy Research Group)
A deeper look into various cloud computing segments reveals that:
- AWS is the clear leader in the Infrastructure-as-a-Service (SaaS) segment.
- Azure is the provider to beat in the Platform-as-a-Service (PaaS) for enterprises segment.
- While AWS has made headway in AI research, ML modeling, and IoT, Google’s GCP excels at these with its Deep Learning offerings and Tensor Processing Units (TPU) chips.
- Alibaba dominates in IaaS across the Asia-Pacific region and is the third-largest provider globally, after AWS and Azure.
- CloudFlare and Akamai also show up in the Content Distribution Network (CDN) space.
Consider this:
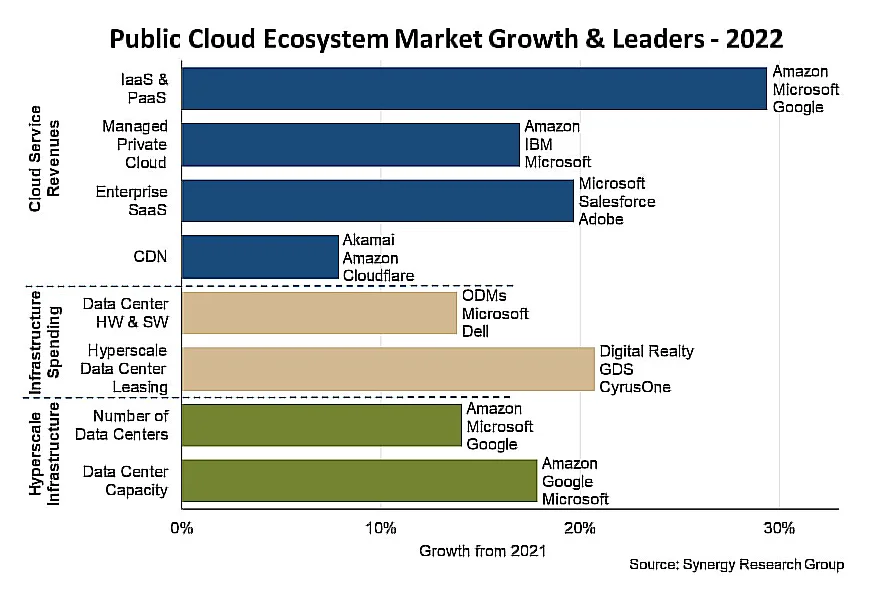
Image: the top cloud computing market players and their offerings
Databricks is now the most valuable data cloud platform in 2025 (Source: Databricks, Yahoo Finance)
Databricks hit a $62B valuation after a $10B raise in early 2025. Snowflake’s market cap was $43.6B as of April 2025. Both lead in cloud data warehousing, with Databricks showing faster growth and higher projected revenue.
Read more: Snowflake Vs. Databricks: Which Data Cloud Platform Should You Use Now?
Palantir is a leader in governing AI (Source: The Motley Fool)
Palantir Technologies provides Artificial Intelligence and data mining services. It owns AIP, Foundry, Apollo, and Gotham. Founded in 2003, Palantir generated $1.91 billion for fiscal year 2022, a 24% year-over-year growth, with $31 million in GAAP net income.
54% of respondents use three different cloud storage providers (Source: GoodFirms)
The research firm had some interesting findings:
- About 300 out of 600 respondents said they use cloud storage for work, although personal usage is on the rise.
- Google Drive, Dropbox, OneDrive, and iCloud are the four most used personal cloud storage services.
- 87.96% use cloud storage for website purposes compared to mobile apps at 89.35% and 10.65% for desktop apps.
The research also found that younger individuals were more likely to use cloud storage for personal use rather than for work.
Statistics On Cloud Computing Models: IaaS, PaaS, SaaS
SaaS, IaaS, and PaaS cloud delivery models have dominated the cloud services market for the longest time. But new entrants are making a mark as more organizations strive to make cloud computing work for them.
The cloud market reached $330 billion in 2024, up $60 billion from 2023 (Source: Synergy Research Group)
This growth was driven by generative AI technologies, which contributed to half of the market’s expansion.
SaaS continues to lead cloud services with projected revenues of $390.5 billion in 2025 (Source: Statista)
SaaS is expected to remain the dominant cloud service model, with revenues reaching approximately $390.5 billion. This surpasses the projected revenues for Platform as a Service (PaaS) at $208.64 billion and Infrastructure as a Service (IaaS) at $180 billion.
IaaS will grow at a CAGR of 26.2% through 2025 (Source: Bure Valley Group)
The IaaS market is expanding fast, fueled by AI, big data, and remote work infrastructure. It remains the fastest-growing cloud segment, outpacing both DaaS and PaaS adoption rates this year.
Google Cloud’s IaaS growth reached 11% global share in 2024 (Source: Statista)
While AWS leads with 31% and Azure follows with 24%, Google Cloud holds steady in third place. GCP’s IaaS momentum is driven by AI workloads, analytics, and developer-centric tools.
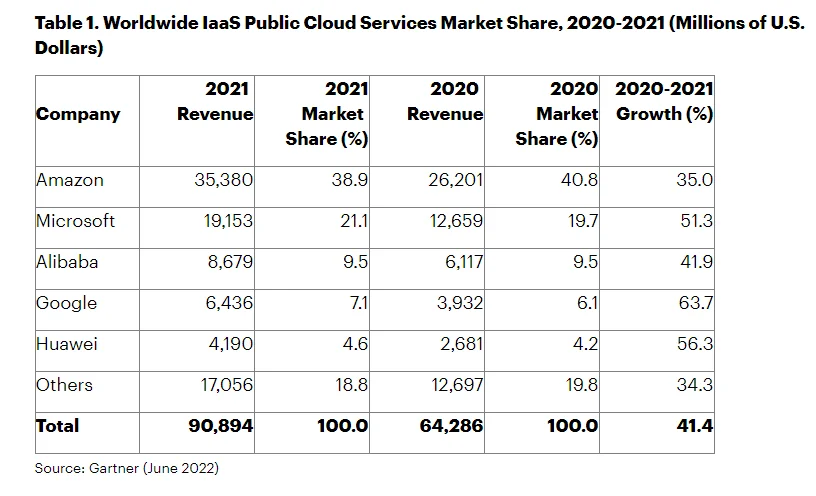
Credit: IaaS market share growth 2020/2021
Cloud Computing Strategy Statistics: Public Vs. Private Vs. Hybrid Vs. Multicloud
Organizations are using two or more clouds at the same time for a variety of reasons, as you’ll see here.
Multicloud and hybrid cloud statistics
Going hybrid or multicloud is not just about preventing vendor lock-in. Most organizations deploy a hybrid cloud (39% vs. 36% last year) or a multicloud strategy (33%) to leverage multiple services, achieve scalability, or support business continuity.
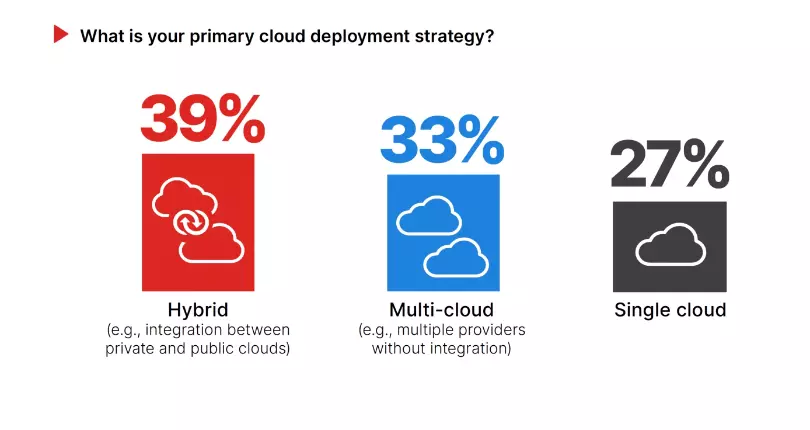
Credit: Fortinet
- Typically, organizations deploy or test on 3.4 public clouds and 3.9 private clouds. (Flexera)
- Four out of five companies use two or more IaaS or PaaS providers. Some 86% have at least 11 SaaS providers, and a third have more than 50.
- 80% of organizations use multiple public cloud providers. (Virtana)
As a result, respondents told Virtana they had difficulty visualizing and controlling costs across multiple public and private clouds:
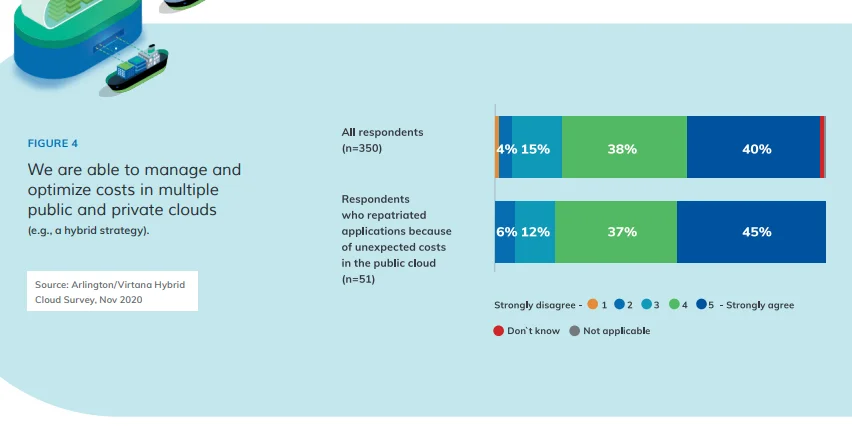
Credit: Virtana State of Hybrid Cloud
Public vs. private cloud statistics
Picture this:
- Sixty-seven percent of respondents say they use a public cloud, 55% maintain their own infrastructure on-premises, and 45% of organizations use a private cloud. (O’Reilly)
- Only 8% of organizations use just a single public IaaS provider. (Cisco)
Experts also expect cloud strategies to evolve from “private” or “public” to “dedicated” or “shared.”
59% of tech Leaders use hybrid or multicloud for security (Source: Zesty)
CIOs, CTOs, and other tech leaders said they don’t want to depend on one vendor’s security protocols and believe their data is safer with multiple cloud providers.
- 56% of respondents said they wanted the unique technological advantages that a specific cloud provider offered
- 395 cited cost efficiency as a reason for adopting a hybrid cloud or multicloud strategy
So, which cloud provider dominates the private cloud market?
Azure continues to lead in private cloud deployments (Source: Flexera)
Azure Stack remains the most used private cloud platform. While newer private-only stats are limited, Azure’s 24% global infrastructure share in 2024 shows its continued dominance in hybrid and private environments.
How Many Applications Do Companies Have In The Cloud?
Cloud usage statistics show evidence of SaaS sprawl, for example. Here are the findings:
A typical company uses 254 SaaS apps (Source: Productiv)
The average company has 254 SaaS apps, while enterprises have 364, according to a Productive study of over 30,000 apps.
- The average engagement rate among licensed employees over 60 days was 45%.
- That suggests that less than half use their app licenses regularly.
Notably, tools purchased outside of IT scored higher at 54% engagement. This may suggest employees find more value in the tools they choose on their own.
The typical employee is dabbling in 36 cloud-based services per day, on average
There’s more:
- The average department now has 40-60 tools, however, cross-functional apps are the most popular.
- The average number of apps in the security, engineering, and IT departments is higher at 78, 77, and 61, respectively.
- IT departments do not own or manage 56% of SaaS applications.
So, which companies experience the most sprawl?
Most sprawl occurs in smaller, high-growth organizations
The reason for this may be that they are growing faster, with more rapidly evolving SaaS portfolios. The findings were as follows:
- 68% SaaS sprawl for companies with less than 500 employees.
- 52% SaaS sprawl for companies with less than 2,000 employees.
- 52% SaaS sprawl for companies with more than 2,000 employees.
Overall cloud services usage is likely to increase as cloud spend increases vs. on-premises spend, as you can see in the next section.
On-Premises Spending Vs. Cloud Spend: What Share Of IT Spending Is Cloud-Based?
Even though on-premises spending still dominates IT spending, the gap is narrowing. Fast.
Enterprises planned to spend 80% of their IT hosting budget on cloud by 2024 (Source: McKinsey)
McKinsey projected most enterprise IT budgets would shift to cloud hosting, including IaaS, PaaS, and SaaS. Although newer 2025 data isn’t out yet, cloud spending continues to outpace traditional infrastructure.
Traditional IT spending to shrink by 32% (Source: Morgan Stanley)
By 2022, only about 32% of all enterprise applications were expected to run on traditional servers, down from 50% in 2019, when companies preferred to own and operate on-site data centers. Shrinkage is likely to increase further over the next three years.
51% of IT spending is shifting to the public cloud (Source: Gartner)
The public cloud will replace traditional solutions for apps, infrastructure, business process services, and system infrastructure by 2025, compared to 41% in 2022.
- The amount spent on application software will increase from 57.7% to 65.9% in 2025.
- The percentage of cloud-based application software expenditures will rise from 57.7% in 2022 to 65.9% in 2025.
That said, which sectors of the economy are driving cloud services growth?
Cloud Monitoring Statistics
Cloud monitoring is a key component of cloud management. The cloud is dynamic, and workloads are constantly changing, making it crucial to continuously monitor your application’s performance, security, and costs.
Here are some interesting cloud computing statistics to know in this area:
Multiple tools are challenging to manage for organizations (BetterCloud)
Teams manage their cloud environments using multiple tools, according to the 2022 State of SaaSOps. This leads to complexity, mix-ups, and insufficient visibility. Instead, integrate your cloud monitoring tools so you can easily analyze the information in one place.
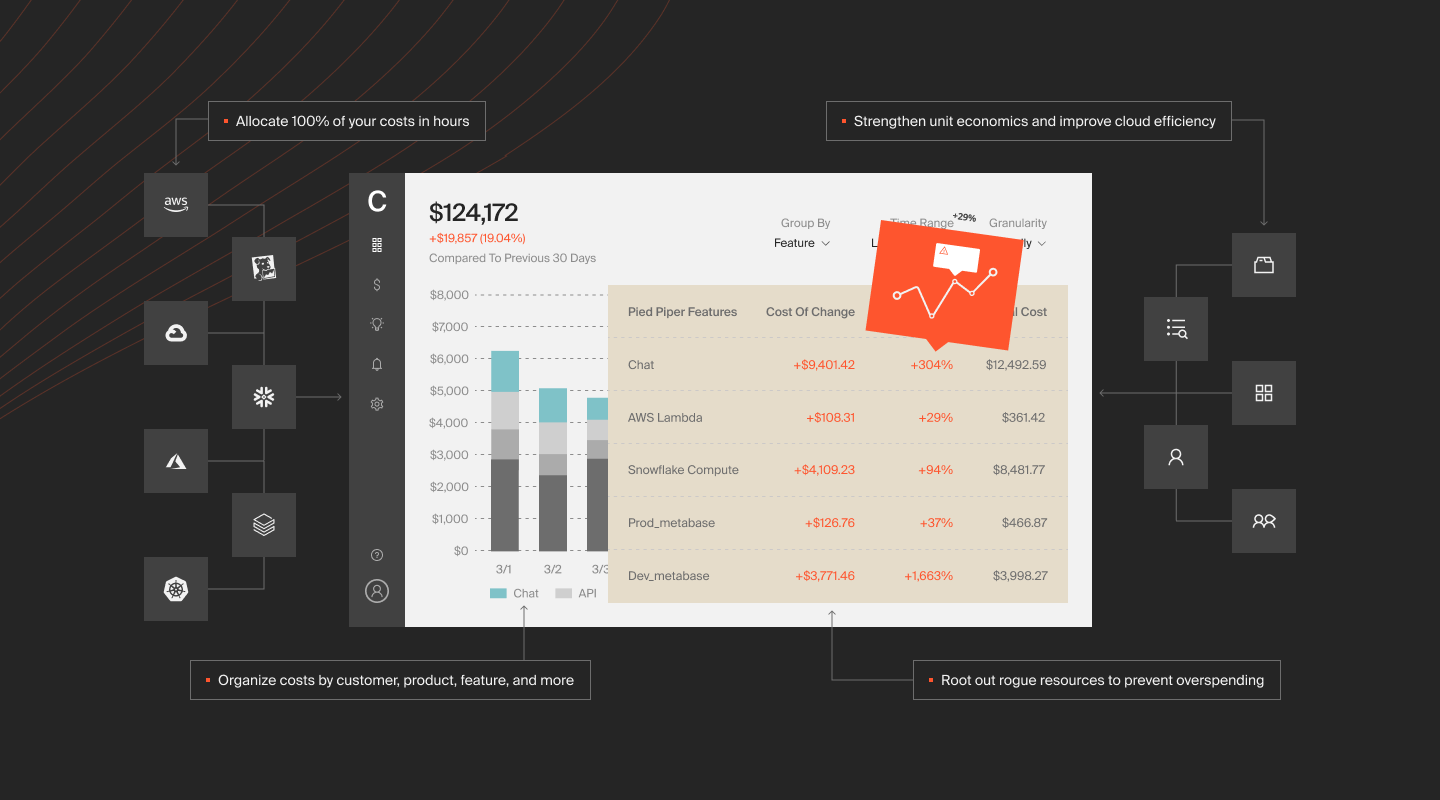
For example, CloudZero offers a single pane of glass to view, understand, and act on all your cloud costs. You can collect and analyze your AWS, Azure, and GCP costs in one place and view your platform costs from Kubernetes, Snowflake, MongoDB, Databricks, Datadog, and New Relic.
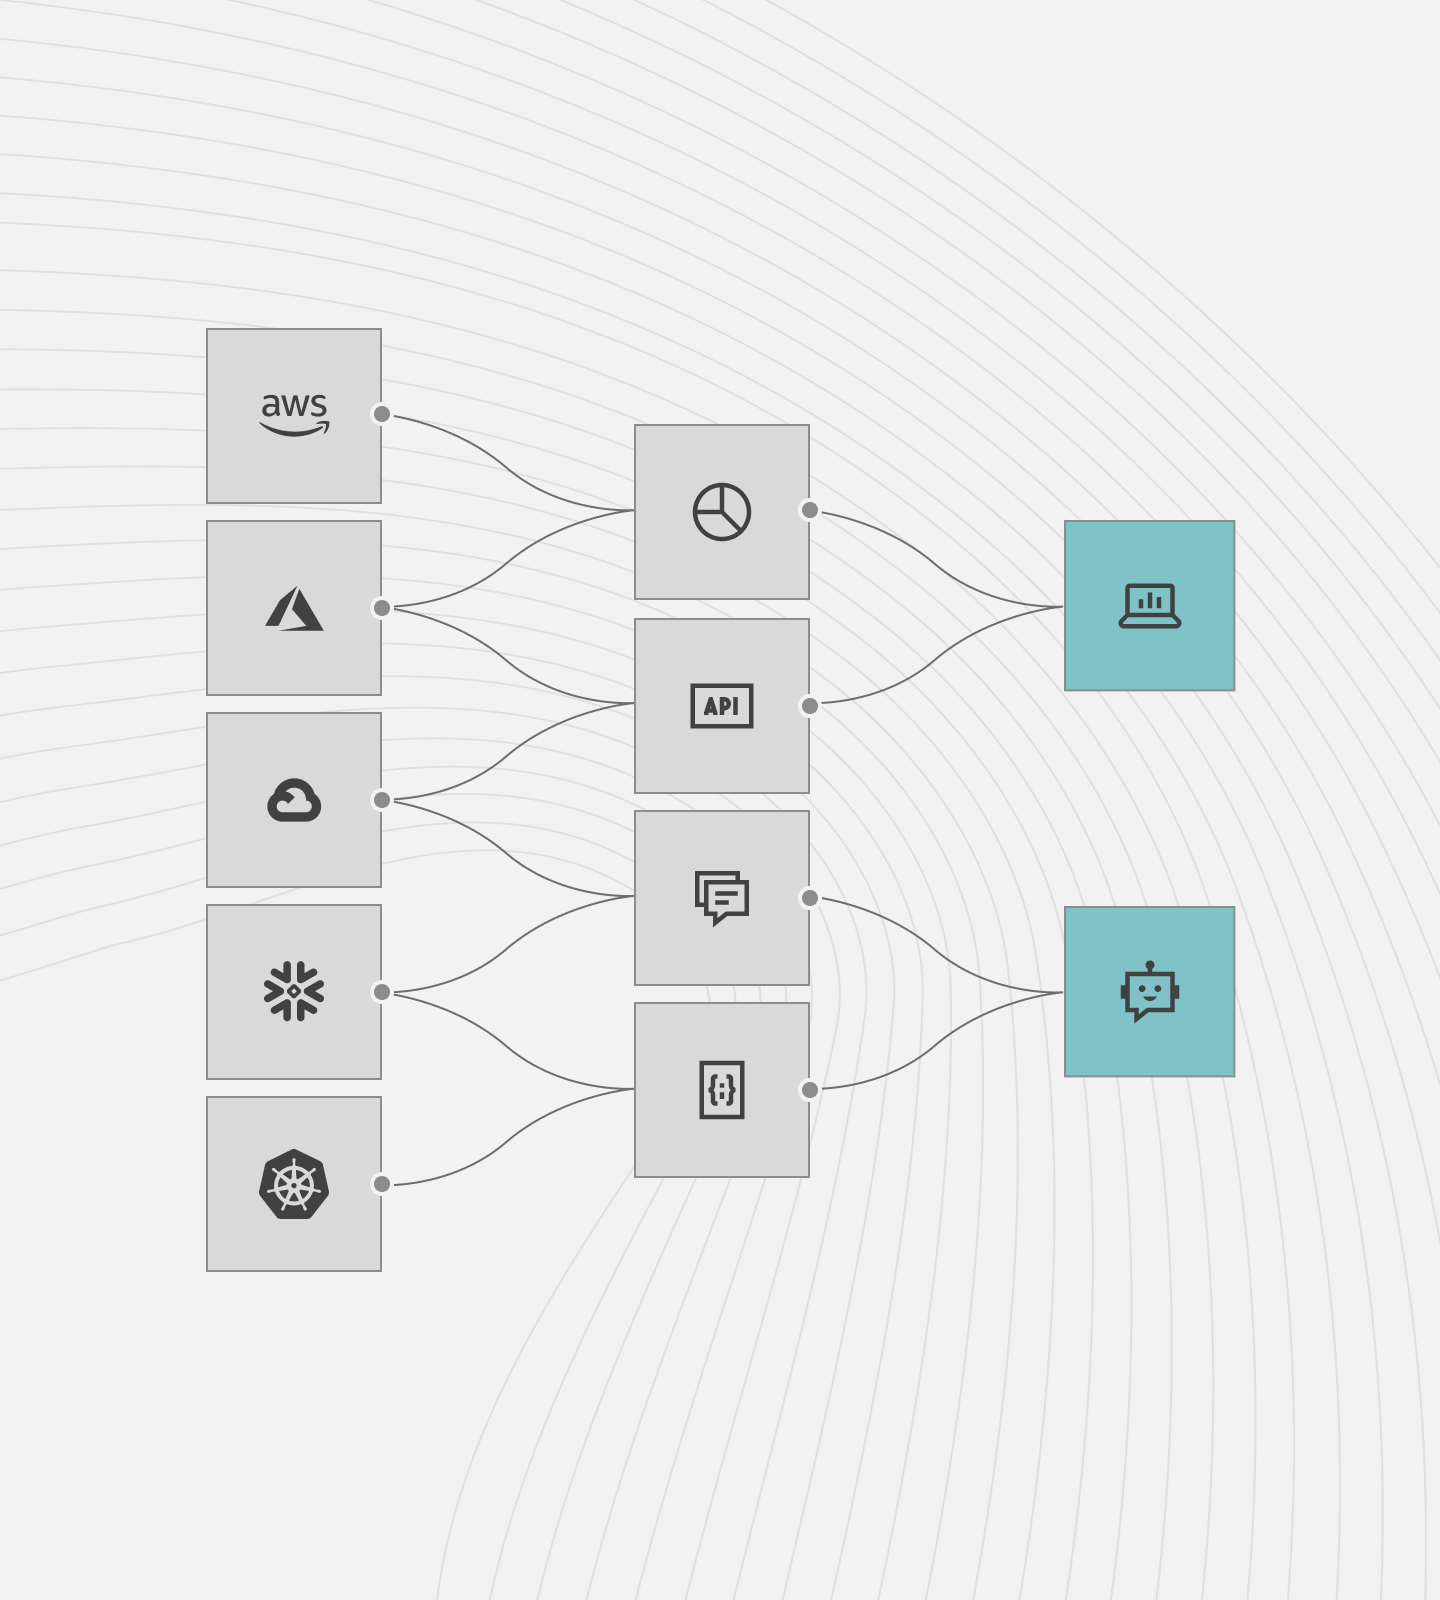
You get it all in one place without sacrificing the clarity, granularity, and actionable intelligence you’ve come to expect from CloudZero, including cost per customer, per team, per project, per feature, per environment, and more. to see how CloudZero works.
Limited visibility leads to limited functionality (Nasuni)
A staggering 80% of organizations report widening visibility gaps across their cloud operations and infrastructure. The blind spots hamper their ability to monitor workload performance, security threats, and cloud costs, as a few examples:
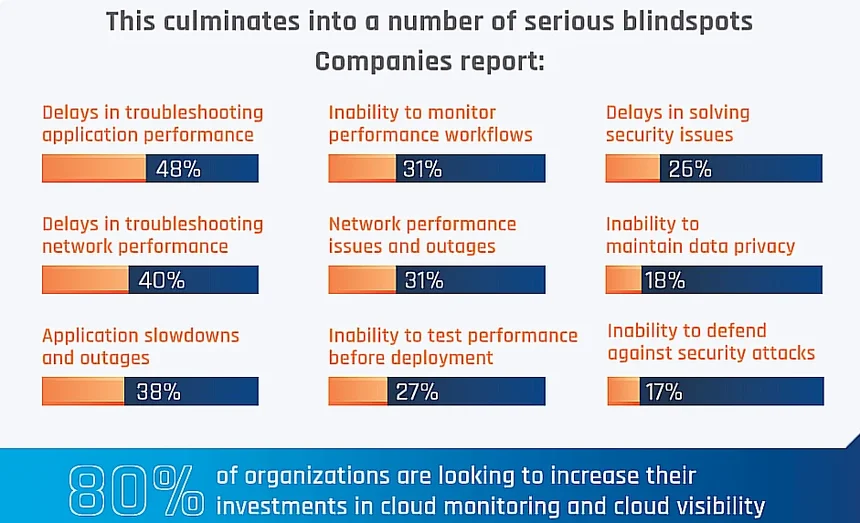
Image: Challenges associated with a lack of cloud visibility
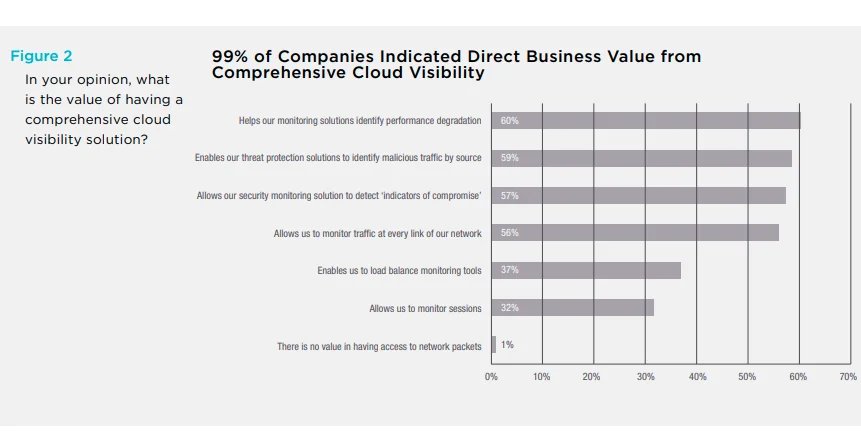
99% say comprehensive cloud monitoring has direct business value (KeySight)
Most respondents in KeySight’s State of Cloud Monitoring report said they used monitoring solutions to identify performance degradation, malicious traffic by source, and more. Check this out:
95% of organizations automate some CloudOps tasks (Source: State of CloudOps Report, 2024)
While nearly all organizations have adopted some level of automation in their cloud operations, only 15% report using it significantly. However, 88% plan to increase automation efforts to optimize cloud ROI and streamline operations.
At least 30% of organizations need to master shared and untagged costs in the cloud (Source: FinOps Foundation and CloudZero)
In three out of ten cases, shared costs are not split in any way. Another 46% of respondents said they use the proportional model, 32% split shared costs by percentage, and 10% by even split (average cost per X).
By using a robust cloud monitoring tool, you can identify the people, products, and processes driving your usage patterns, performance, and costs — even if you use a multi-tenant architecture.
There are a few platforms that already do this, such as CloudZero (for multi-cloud and Kubernetes cloud costs) and Kubecost (Kubernetes cost analysis).
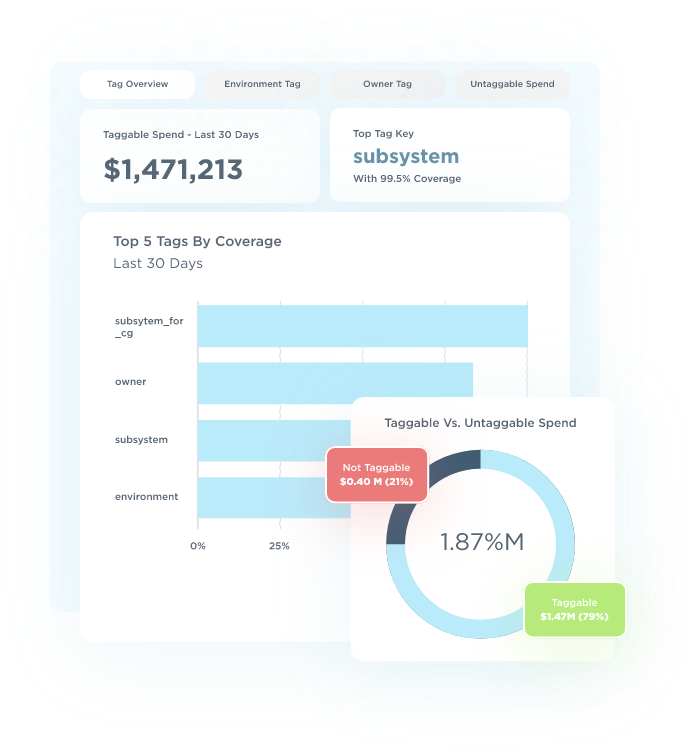
Credit: CloudZero lets you capture the cost of tagged, untagged, and untaggable resources in the cloud, as well as allocate 100% of shared costs
Cloud Computing Stats By Industry: Which Industries Use Cloud Services The Most?
While cloud adoption statistics show that all industries are embracing cloud services, a closer look reveals that some sectors have invested much more than others.
Cloud-native development is gradually becoming the new normal for tech companies (CNCF)
To fully capitalize on the cloud, tech companies need to leverage cloud-native technologies. A new report from the Cloud Native Computing Foundation shows that they are making progress. The report shows 30% of companies are using cloud-native techniques for development, such as GitOps, containers, and rapid release cycles (CI/CD).
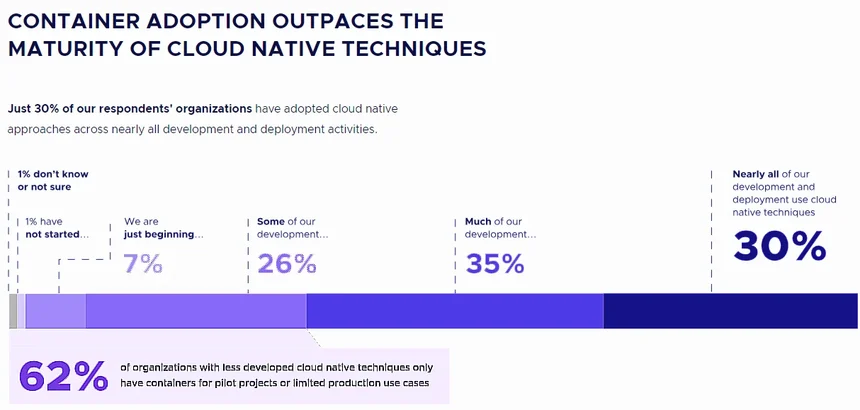
Credit: CNCF 2022 Annual Survey
Health records make up 23.2% of sensitive data in the cloud (SANs Institute)
Healthcare providers are leveraging the cloud to collect, analyze, share, and take action on various diagnoses more quickly. Digital health access helps patients receive the care they need, including quick referrals and information exchanges that can save their lives.
81% of insurers use cloud-based technology to support claims management (IBM)
A further 25% said they use the cloud exclusively. According to IBM, these insurers augment claims processes at scale and speed using AI and ML. These technologies enable them to handle large volumes of data, reduce manual handling, lower error rates, and process more data straight through.
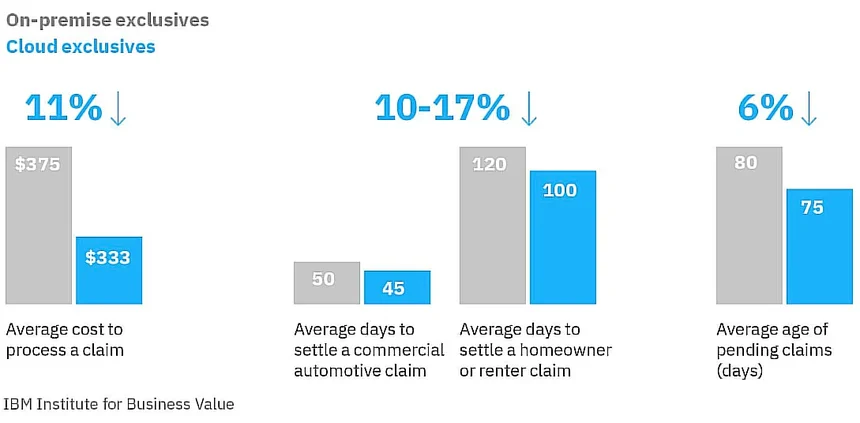
Credit: IBM Institute for Business Value
Retail & Ecommerce is the Most Proactive Cloud Services User (Source: O’Reilly)
O’Reilly’s Cloud Adoption survey found the most proactive cloud usage by industry came from Retail & Ecommerce, Finance & Banking, and Technology (software). Government (16%) and electronics & hardware (25%) used cloud services the least in 2022.
Over 30% of commercial real estate leaders plan to invest in cloud computing (Source: Deloitte)
A Deloitte survey of 400 commercial real estate professionals revealed that cloud computing is the top investment priority. Other key areas of focus include blockchain, artificial intelligence, and data analytics.
The smart robot market will hit $21.92 billion in 2025 (Source: Research and Markets)
Smart robots are driving factory automation and powering Industry 4.0. The market is expected to more than double by 2029. IoT and connected tech continue to boost innovation across the manufacturing sector.
63% of educators plan to manage education offerings using curriculum software (The Learning Counsel)
A school management system helps collect and manage data about students, faculty, and staff. Using a cloud-based system can ease the burden of planning lessons for 74% of teachers who feel overwhelmed, allowing them to create student-centric learning programs with ease.
According to Data Bridge, growth in the global school management system sector will average a CAGR of 17.1% between 2021 and 2028. By 2028, the market will be worth $41.26 billion.
Data Analytics And Cloud Storage Statistics
Data lakes, warehouses, marts, and analytics play a major role in enabling cloud computing. The following cloud computing stats provide key examples:
47% of corporate cloud data was considered sensitive in 2024 (Source: Thales Group)
Thales found that nearly half of all corporate data stored in the cloud contains sensitive information. This includes personal details, financial records, and health data — raising ongoing concerns around cloud security and compliance.
Business and financial records remain the most stored sensitive data in the cloud (Source: GetAstra, 2024)
About 53% of sensitive data in the cloud is related to finance or business. Employee records (48%) and customer data (44%) follow closely, showing a consistent trend in what organizations store in public cloud environments.
The cloud will host more than 100 zettabytes of data by 2025 (Source: Forbes)
Cloud usage generates a colossal amount of data daily. Within three years, the world will generate over 200,000 terabytes of data. Half of that will be stored in the cloud. This emphasizes the growing need to capture, process, analyze, secure, and utilize data effectively.
That’s not all.
IoT devices will generate a whole lot of data (Source: Cisco)
By 2025, Cisco estimates there will be more than 75 billion Internet of Things devices worldwide. This figure covers connected devices across B2B and B2C segments, such as smart homes, intelligent security systems, and connected cars.
Data analytics is key to enabling digital transformation (Source: Gartner)
Data is a critical organizational asset for 90% of organizations. That makes data analytics a core competency every organization will want to develop. Data fabrics use APIs to break down silos, allowing organizations to consolidate data access, management, and security across multiple cloud providers.
A centralized data management framework reduces vendor lock-in and allows organizations to utilize their distributed services to gain a unified view of their operations.
46% of European companies store all their data in the cloud (Source: Thales)
Thales Europe found that 43% of the data is classified as “sensitive.” While a quarter of companies admit to suffering a breach in the past year, only 54% of their sensitive data is encrypted.
Cloud computing is a modern data protection strategy (Source: Veeam)
The cloud plays a crucial role in today’s data protection strategy, according to half of the surveyed businesses. They told Veeam that they moved to the cloud as a way to do disaster recovery using a cloud service (54%), to migrate workloads to the cloud (50%), and to shift workloads between clouds (48%).
Cloud Security Statistics
Cloud computing security remains one of the most concerning aspects of operation — and a key barrier to cloud migration for some. Here are some things you need to know.
95% of companies are concerned about cloud security (Source: Fortinet)
Fortinet reported that almost everyone is moderately or extremely concerned about security in the cloud.
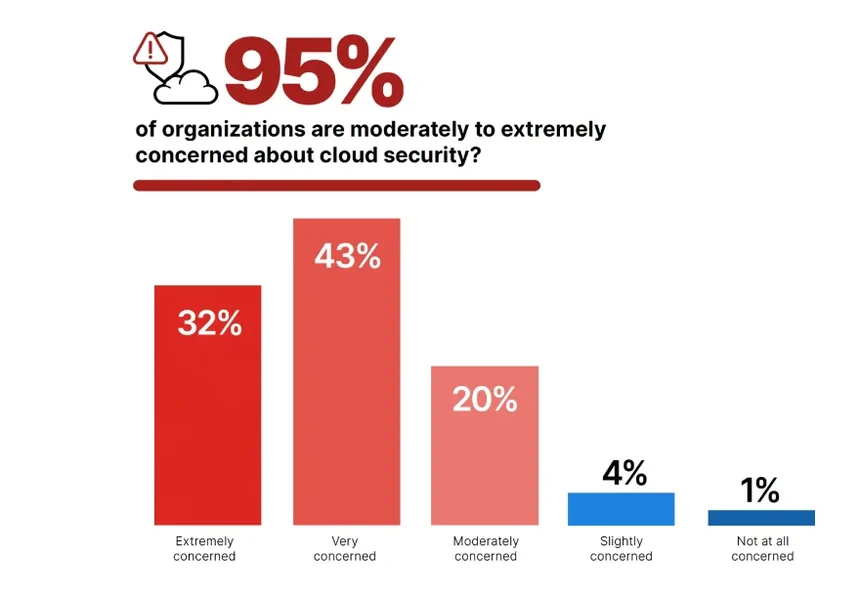
The concern is justified, considering that:
Cybercrime costs an organization about $13.0 million on average (Source: Accenture)
The State of CyberSecurity Report by Accenture examines the cost of cybercrime and makes it easier to quantify the economic cost of malicious activities in cyberspace.
The average cost of a data breach rose to $4.88 million in 2024 (Source: IBM)
Healthcare remains the hardest hit, with breach costs averaging over $10.9 million. This marks a steady rise as threats grow more complex and widespread.
Ransomware accounts for 24% of all cyberattacks in 2025 (Source: Integrity360)
Ransomware is still one of the most common and costly attack types. Phishing remains the top entry point, with attackers impersonating brands such as Microsoft, Google, and Apple.
Data breaches exposed over 16.8 billion records in 2024 (Source: Flashpoint)
In 2024, data breaches increased by 6%, exposing over 16.8 billion records. This surge was primarily due to compromised credentials, ransomware, and vulnerability exploits.
73% believe cloud technology has increased complexity (Source: Fujitsu and Vitreous World)
A survey revealed that 73% of respondents think cloud technology has added complexity to their operations. Additionally, 70% of CIOs feel they have less control due to cloud technologies.
IT downtime costs an average of $14,056 per minute in 2024 (Source: BigPanda)
Research indicates that unplanned IT downtime now averages $14,056 per minute. For large enterprises, this figure rises to $23,750 per minute.
It takes almost two hours to resolve server downtime (Source: Veeam)
The Data Protection Trends Report showed that 95% of organizations struggle with unexpected outages. The average outage lasts almost 2 hours (117 minutes).
For a High Priority application, an hour of downtime costs $67,651, while for a Normal application, it costs $61,642. Downtime is unacceptably costly in today’s business environment.
For enterprises, the cost can be wildly higher.
A single hour of downtime costs enterprises over $100,000 (Source: Accenture)
That is according to nearly all (98%) of surveyed leaders. Some 40% of enterprises said they lost $1-$5 million in just one hour of downtime. This eye-watering cost excludes legal fees, fines, or penalties.
Add Service Level Agreement (SLA) obligations and other forms of inconveniences and business losses, and you are looking at even larger damage.
Misconfiguration is responsible for 68% of issues (Source: Fortinet)
Organizations ranked the following threats as the most significant security threats to their public clouds:
- Misconfiguration (68%)
- Unauthorized access (58%)
- Insecure interfaces (52%)
- Hijacking of accounts (50%)
Meanwhile, most apps have fewer than three security certifications, while IT-owned apps are more likely to utilize single sign-on (SSO). Similarly, many organizations had not prioritized cybersecurity and compliance:
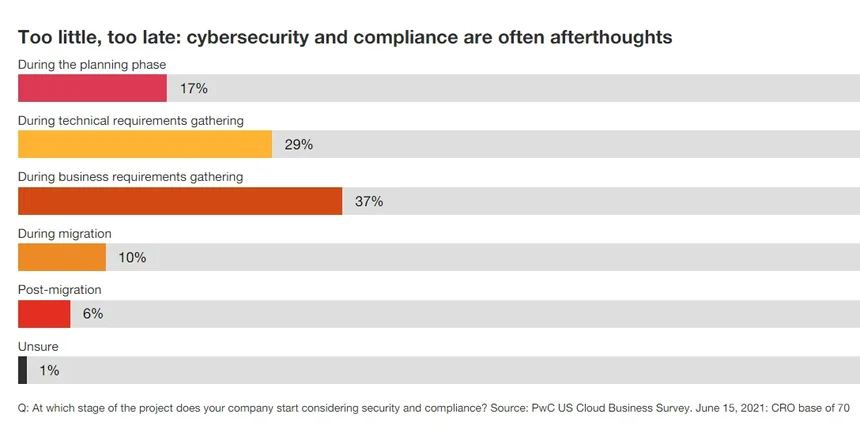
Zero trust policies are a thing now (Source: Fortnet)
More organizations are implementing zero trust policies to improve their cloud security, according to Fortinet. Consider this:
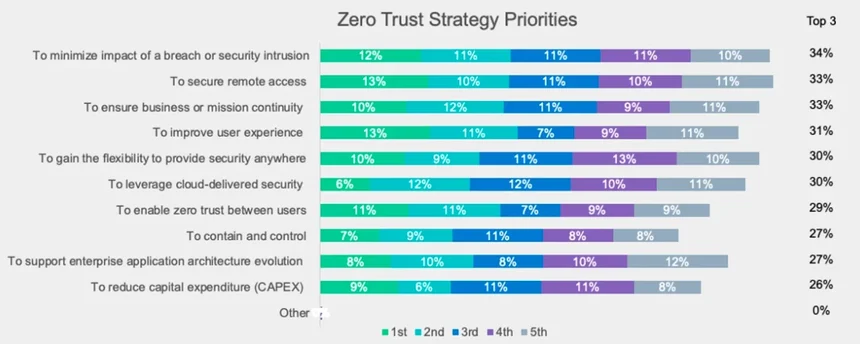
What organizations hope implementing zero trust policies will achieve.
Top Cloud Concerns For Decision-Makers
Apart from cloud security concerns, organizations pointed to several other issues as the biggest unforeseen factors that slow or stop cloud adoption.
Managing costs is the biggest challenge to cloud adoption (Source: Flexera)
Among those surveyed for the State of the Cloud Report, managing cloud costs and security were the main reasons for not fully embracing cloud computing. This is true for both enterprises and SMBs.
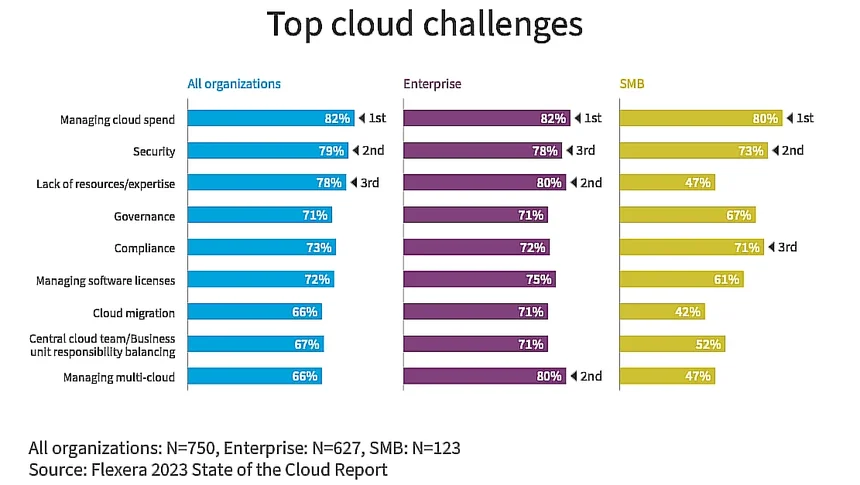
Credit: State of the Cloud Report for 2023
In addition, enterprises and SMBs experience issues with acquiring expertise and managing compliance in the cloud, respectively.
Low visibility is a major barrier to cloud adoption (Source: Fortnet)
According to findings in the 2022 Cybersecurity Insiders Report by Fortinet, cloud adoption limitations include:
- Lack of visibility (49%)
- High cost (43%)
- Lack of control (42%)
- Lack of staff resources or expertise (39%)
- Lack of security (22%)
A major obstacle to controlling cloud costs is not getting “true visibility” into costs:
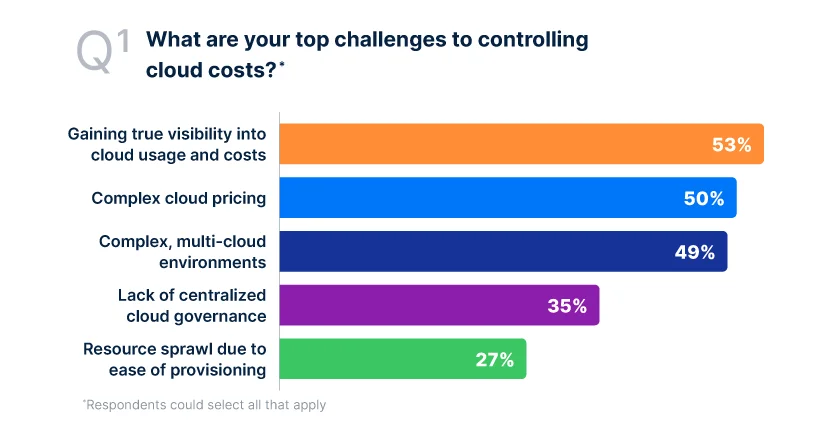
Credit: Anodot
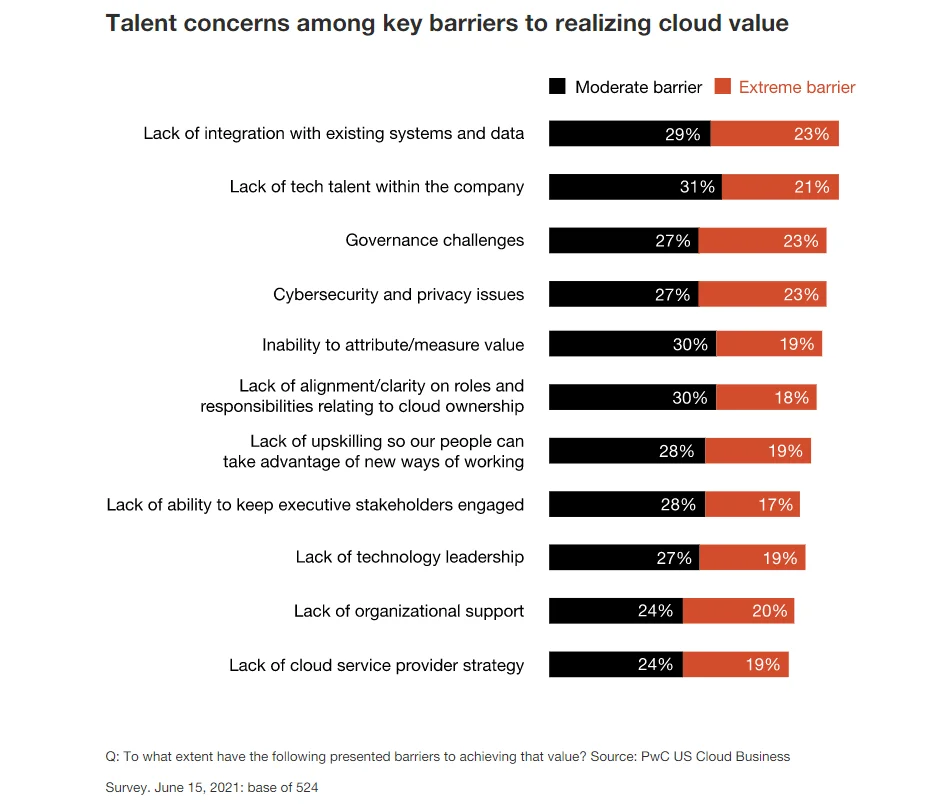
Integration issues cause governance challenges (Source: PwC)
The US Cloud Business Survey by PwC reported that a lack of integration with existing systems, insufficient talent, and a lack of expertise are other top challenges to adopting cloud computing.
There is more.
SaaS companies are moving away from massive discounting (OpenView Venture Capital)
A good 68% of SaaS companies are discounting their prices in less than a quarter of all deals, according to the State of SaaS Pricing report.
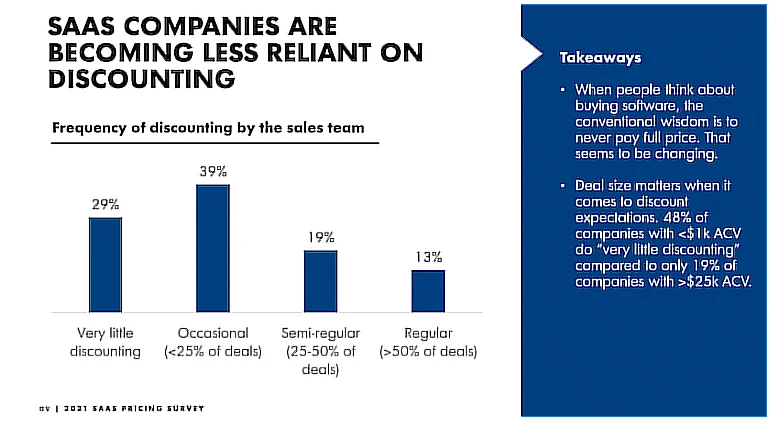
A further 29% report that their sales team offers “very little discounting.” This is helping them generate more revenues and maintain their margins.
But what if you want to encourage new subscriptions and renewals?
The problem may not have been discounting. They may have been unsure how much discount to offer — especially without hurting their margins. We recommend you use cost per customer to determine how much you spend to support a specific customer — like this:
This information can help you pinpoint how much you can discount that particular customer without compromising your margins on their contract.
What Are The Top Cloud Computing Initiatives In 2025?
In response to those challenges, many organizations have or are implementing initiatives to counter them. Here are some top cloud computing statistics that show how.
Serverless adoption has surpassed 75% in 2025 (Source: Datadog, AWS Heroes)
Over 70% of AWS users now rely on Lambda. Google Cloud Run use has quadrupled since 2020. Azure’s serverless usage jumped 76% in one year, driven by container-based platforms.
78% of organizations are making cloud cost optimization their top priority in 2025 (Source: Flexera)
Flexera’s latest report shows most companies aim to reduce cloud waste. They also want better cost visibility and plan to move more workloads to SaaS and public cloud.
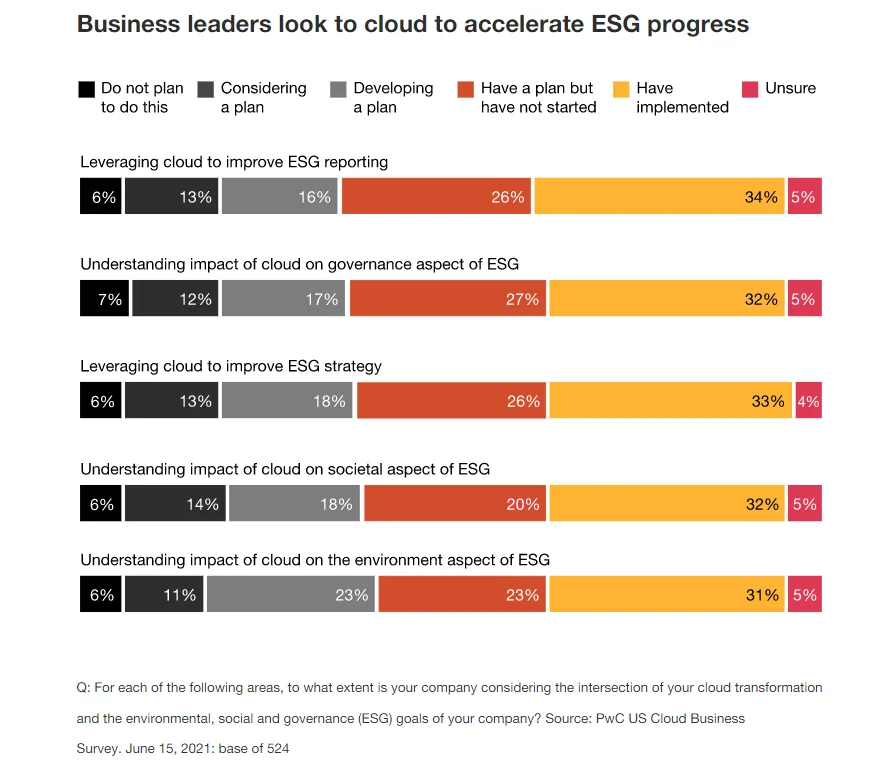
Organizations want to use cloud computing to meet ESG goals (Source: PwC)
Some companies are leveraging cloud computing to meet their environmental, social, and governance (ESG) goals. Check this out:
The remote desktop market will exceed $5.5 billion by 2025 (Source: Grand View Research)
The global remote desktop software market was valued at $2.2 billion in 2022, with forecasts projecting it to surpass $5.5 billion by 2025, growing at a CAGR of 15.1%. The continued shift to hybrid work and remote IT support drives this growth.
Edge computing market to hit $261 billion in 2025 (Source: IDC)
Global edge computing spend is projected to reach $261 billion in 2025, driven by real-time data needs and IoT adoption. IDC expects the market to grow to $378 billion by 2028, with energy, industrial, and transportation sectors leading adoption.
Green computing is on the rise (Source: GEC)
By 2025, IT could account for 8% of global GHG emissions. The Green Electronics Council estimates it has helped save nearly 400 million megawatt-hours through the 1.5 billion green products it has recommended so far.
What’s Next?
Ultimately, we’ll continue to see more workloads move to the cloud as the benefits of adopting cloud computing outweigh the challenges for many players.
We get it, though. It can be frustrating not knowing where your cloud spend is going — especially when you don’t know whether you are investing more or simply overspending.
We know this because we’ve helped:
- Drift reduce its annual cloud cost by $2.4 million.
- Obsidian reduce its AWS bill by 25%.
- ResponseTap reduce its overall AWS spend by 18%.
- SeatGeek save 6-8 hours of investigation time per question about cost.
- MalwareBytes conduct granular unit economics, in particular, cost per product, to know exactly where their cloud costs are going.
- Remitly allocate 50% more costs without tagging.
- Demandbase reduce its cloud bill by 36%, justifying $175 million in financing.
CloudZero will help you transform your cloud bill from this:

To this:
Simple, granular, and actionable cloud cost insights at your fingertips, including cost per customer, team, software feature, product, engineering project, computing environment, and more.
CloudZero’s unique code-driven cost optimization approach helps you achieve all this without endless cost allocation tags.
But don’t take our word for it. to discover how CloudZero can help you manage and optimize your costs across AWS, GCP, Azure, Snowflake, and Kubernetes, all in one place.


The Cloud Cost Playbook
The step-by-step guide to cost maturity